W o r l d . C r y p t o . G l o b a l

Loading

Welcome at World Crypto Global. This portal is packed with useful content and resources to built out your own crypto skills. WorldCrypto is a site member of Gabriel Vega Network.

Contact Info

CATEGORY: ar news


May 06, 2025 02:30

HBAR Price Faces Crucial Breakdown Risk, Will $0.15 Hold?

Hedera (HBAR) has been under sustained selling pressure, slipping from around 0.19 to below 0.175. After a sharp sell-off, the token made a brief attempt to recover but struggled to break resistance near 0.185. Continued downward momentum has kept the market in a bearish pattern, with lower highs and lows reinforcing the negative sentiment. HBAR […]

Jun 01, 2024 12:05

Near Protocol Breaks Out From Wedge Pattern: Why This Could Trigger A 37% Crash

Near Protocol has had a good year in 2024 so far and has continued to hold up quite nicely despite the multiple crashes that have rocked the market. However, it seems that the altcoin may have exhausted its runway, as a crypto analyst believes its earlier breakout is very bearish for the price. Near Protocol Breaks Out Of Wedge Pattern At the start of the month of May, the Near Protocol price had formed a wedge pattern after falling to $5.5 and then recovering slightly. This wedge pattern would hold its price in a tight range for a while. However, by the middle of the month, the Near Protocol price broke out of the wedge pattern and began a move upward. Related Reading: Shiba Inu Elliot Wave Count Falls Into Place, Heres Where The Bullish Wave 4 Says The Price Is Headed Following the breakout, the altcoins price saw an over 15% recovery that put its price firmly above $8, but this did not last for long. Once the Bitcoin price began to retrace and the crypto market followed, so did the Near Protocol price decline. This confirmed the bearishness hat was brewing in the price of the coin. Crypto analyst Kledji Cuni revealed in a TradingView post that this breakout remains bearish for the price. According to him, the pattern is still very solid, meaning that the breakout actually marked the beginning of the bearish trend. As for how the price will move from here, the analyst expects that Near Protocol will continue to fluctuate around its current level of $7.3. However, the downtrend is expected to happen regardless. The price may spend some time in the same zone before it moves down for an impulsive, he stated. Targets for the decline include an initial 8% drop to $6.78. Following this is another expected drop down to the $6 level. Then finally, the analyst expects the downtrend to bottom out around $4.6. If it goes this low, it would mean a total decline of 37% from its current price. A Reversal In The Cards? Recent developments in the metrics of Near Protocol lend credence to the crypto analysts prediction of an impending decline. For one, the coin is seeing losses in the last month after starting off 2024 on a very strong foot. This is in addition to the notable decline in its daily trading volume. Related Reading: Cardano Price Prediction: Crypto Pundit Forecasts 8,300% Rally To $38, Heres When The Near Protocol daily trading volume has dropped more than 18% in the last day to approximately $246 million. This decline suggests a decline in interest in the altcoin and could be a contributing factor to the decline. At the time of writing, Near protocol is trending $7.3, with a 0.89% decline in the last day and a 4.28% decline in the last week. Featured image from U.Today, chart from Tradingview.com

Apr 26, 2024 12:05

HBAR Prices Crashes 35% As BlackRock Denies Any Ties To Hedera

HBAR, Hederas native token, saw a sharp correction following clarification that the worlds largest asset manager, BlackRock, was not directly involved in the tokenization of its ICS Treasury Fund on the Hedera network.  HBAR Token Crashes By Almost 35% Data from CoinGecko shows that the HBAR token has declined by almost 35% since its price rose by over 100% on the back of the announcement, which many misinterpreted to mean that BlackRock tokenized its fund on the Hedera network. On April 24, the Hedera Foundation shared that Blockchain trading firm Archax and Infrastructure firm Ownera had collaborated to tokenize BlackRocks ICS US Treasury money market fund (MMF) on Hedera. Related Reading: XRP Price Ready For 70% Breakout As Long-Term Consolidation Nears Its End Members of the crypto community, including influencers like CrediBULL Crypto and Mason Versluis, misconstrued this as meaning that BlackRock had tokenized its fund on Hedera. This assumption immediately created a bullish narrative for the ecosystem, leading to HBARs price rallying by over 100% and peaking at $0.176.   However, the crypto token has since been on a downtrend, with BlackRock denying any involvement with Hedera. Specifically, a BlackRock spokesperson told Cointelegraph that the worlds largest asset manager has no commercial relationship with Hedera nor has BlackRock selected Hedera to tokenize any BlackRock funds. Meanwhile, Archaxs co-founder had also clarified on his X (formerly Twitter) platform that BlackRock wasnt directly involved in the whole move. He claimed that tokenization of the fund can usually be done without the permission of the asset manager. However, he revealed that BlackRock knew they were tokenizing on the network. Why The News Is Still Bullish For The Hedera Ecosystem Despite BlackRock not being directly involved in this development, crypto analyst CrediBULL Crypto offered some perspective on why this news is still bullish for Hedera and its HBAR token. He revealed that BlackRock is the fourth largest shareholder of ABRDN, a firm that is a primary investor in Archax. Related Reading: Brace For Impact: Worldcoin Team Plans To Sell 1.5 Million WLD Tokens Every Week For 6 Months Therefore, the crypto analyst believes that BlackRock must have signed off on this move, something he considers a de-facto endorsement of the product. Meanwhile, he also alluded to an interview that revealed that BlackRock chose Hedera, although ABRDN introduced them to the network.  CrediBULL Crypto noted that even if BlackRock wasnt building on the network, it is clear that major enterprises are using Hedera. They are actively involved with building on the network and are constantly pushing to move it forward behind the scenes, he added. He suggested that this puts Hedera above 99% of networks that cant boast of such achievements.  HBAR price crashes 35% from highs | Source: HBARUSDT on Tradingview.com Featured image from Vecteezy, chart from Tradingview.com

HBAR Breaks Above Massive Falling Wedge  Expert Sets $0.38 Target

Author: Sebastian Villafuerte
United Kingdom
Apr 24, 2025 12:05

HBAR Breaks Above Massive Falling Wedge Expert Sets $0.38 Target

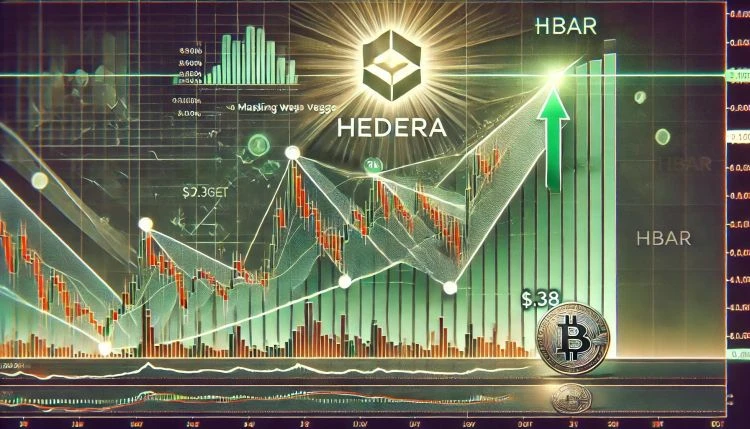
Hedera Hashgraph (HBAR) is showing strong signs of recovery, surging over 20% in the past week as bullish momentum sweeps across the broader crypto market. Despite continued macroeconomic uncertainty and global financial instability, Bitcoin’s recent price jumps have reignited optimism, lifting the entire market with it. HBAR is now trading near a critical resistance level, and traders are watching closely for confirmation of a sustained uptrend. Related Reading: XRP Network Activity Jumps 67% In 24 Hours Big Move Ahead? Top analyst Carl Runefelt shared insights on X, noting that HBAR has officially broken out of a massive falling wedge patternan important bullish technical signal. Falling wedge breakouts often precede sharp upside moves, especially when backed by strong volume and broader market support. As HBAR rides this momentum wave, investors are eyeing higher targets if key resistance levels are flipped into support. With renewed risk appetite across crypto and leading assets like Bitcoin paving the way, HBAR could be positioning itself for a significant continuation rally. However, market conditions remain volatile, and any pullback from broader sentiment shifts could test HBARs strength. For now, bulls appear to be in controland if the breakout holds, HBAR may soon target fresh local highs. HBAR Eyes Continuation Amid Renewed Crypto Momentum Hedera Hashgraph (HBAR) is trading at a crucial turning point as bulls continue to apply pressure following a sharp breakout from a long-standing downtrend. The asset remains over 50% down from its local highs earlier this year, but recent developments suggest that HBAR could be gearing up for a strong reversal, especially as broader market sentiment begins to improve. Global tensions and ongoing trade war fears between the US and China continue to rattle equities and traditional markets. However, crypto assets are beginning to diverge from this trend, with Bitcoin leading a notable move higher that has started to lift altcoins like HBAR. This decoupling could mark the beginning of a fresh rotation into digital assets as investors seek growth outside of conventional markets. Runefelt insights highlight that HBAR has broken out of a massive falling wedge pattern, typically a bullish reversal signal. This breakout confirms the potential for upward momentum, especially if HBAR can continue to push through current supply zones. The next key target sits around the $0.38 level, but for that to materialize, bulls must maintain pressure and sustain higher lows in the coming sessions. If momentum holds and macro fears ease even slightly, HBAR could be poised to surprise the market with a sharp rally. Related Reading: Ethereum Holds Above MVRV Band Low A Final Dip Before Recovery? Price Tests Key Resistance Amid Bullish Momentum HBAR is currently trading at $0.185 as it tests a critical resistance zone around the 200-day Exponential Moving Average (EMA). Bulls are now aiming to reclaim the $0.20 level, which also aligns closely with the 200-day Simple Moving Average (SMA). A clean breakout above this range would confirm the bullish momentum and potentially open the door for a rally toward higher levels, including the $0.25 mark. After surging more than 20% in the past week, HBARs price action is showing early signs of strength, but confirmation is needed. Holding above $0.185 and pushing through the $0.20 barrier would validate the recent breakout from a falling wedge pattern and suggest that bulls are in control. However, the rally remains fragile. If HBAR fails to hold above the $0.175 level, it could face a deeper retracement and return to previous support zones near $0.15. That would invalidate the current breakout structure and increase bearish pressure. Related Reading: Solana Short-Term Indicator Signals Potential Risk Reversal Or Pause? Traders are now watching closely as HBAR battles with long-term moving averageslevels that often serve as a dividing line between bear and bull phases. The next few sessions will likely determine whether HBAR confirms its uptrend or returns to consolidation. Featured image from Dall-E, chart from TradingView

Dec 28, 2021 02:45

BREAKING: First-Ever Blockchain Stock Exchange to Launch in Europe

An Entire European Stock Exchange Will Be Powered By Crypto and Blockchain Covered: Stock Exchange Acquired By Blockchain Firm Gibraltar’s Strong Stance On Crypto Endorsements/Partnerships Gibraltar Stock Exchange Acquired By Blockchain Firm Gibraltar is a British Territory on the South coast of Spain. While the small territory is a quiet place where those on holiday […]

The post BREAKING: First-Ever Blockchain Stock Exchange to Launch in Europe appeared first on CryptosRus.

Dec 26, 2021 02:45

Why Is NEAR Protocol Up 70% Over The Last Week?

Is NEAR the next LUNA? If so, how far is Near from the moon?  Covered: Why The Pump? UST Integration and Interoperability Why DeFi on Aurora and Near is Exploding NEAR Protocol is another Layer-1 blockchain that has been quietly flying under the radar for much of the year. In the 11th hour, though, Near […]

The post Why Is NEAR Protocol Up 70% Over The Last Week? appeared first on CryptosRus.

Dec 03, 2021 07:35

Stellar’s Lumenswap DEX Up 50% In Weekly TVL, Tops Charts

Stellar is leading weekly DeFi charts. Yes, you read that right. It’s thanks to Lumenswap which is up 50% in TVL. Why is this DEX built on a boomercoin doing so well?  Covered: Lumenswap Up 50% Stellar Lumens, The Smart Contract Protocol? Stellar And The Future Prospects Of Lumenswap Why Does Grayscale Still Hold Stellar […]

The post Stellar’s Lumenswap DEX Up 50% In Weekly TVL, Tops Charts appeared first on CryptosRus.

Nov 30, 2024 12:05

NEAR Q3 Market Cap Dive: Exploring The 27% Plummet And Key Financial Metrics

A recent report from research firm Messari provided an overview of the NEAR (NEAR) protocol’s performance during the turbulent third quarter (Q3) of 2024, when the broader cryptocurrency market experienced significant volatility. NEAR Protocol Q3 Performance Throughout Q2 2024, the crypto market saw a downturn that continued into Q3 for NEAR. The protocol’s circulating market cap fell to approximately $5.16 billion, reflecting a significant quarter-over-quarter (QoQ) decrease of about 27.52%.  NEARs token price also retraced slightly, closing the quarter at around $5.29, a marginal decline of 0.21% QoQ. Despite these challenges, NEAR managed to maintain its position as the 17th largest crypto by market cap, indicating relative stability among leading digital assets. However, over the past three weeks, it has gained 54% in terms of market capitalization, rising to $7.99 billion amid the broader market rally led by Bitcoin (BTC) and the catalyst that was Donald Trump’s election.  Related Reading: Ethereum Price On The Verge Of Repeating 2017-2021 Cycle Breakout, Target Above $20,000 One of the notable aspects of NEARs Q3 performance was its revenue, which measures network transaction fees while excluding storage staking. Revenue dropped to approximately $1.64 million, marking a 30.13% decline QoQ.  This dip is particularly significant as it represents the first quarter in the past year where revenue ended lower than it began. The report attributes this to a decline in transaction volume, which resulted in reduced transaction feesdown by approximately 10.48% QoQ and 34.23% year-over-year. As of the end of Q3 2024, about 93.46% of NEARs total token supply was in circulation, with 52.36% of that supply staked. The annualized nominal yield from staking stood at approximately 8.60%, while the annualized real yield was 4.09%. Despite the challenges in transaction volume, NEAR experienced an uptick in address activity. The average daily active returning addresses increased by 7.27% QoQ, and the average daily new addresses rose by 11.06%.  TVL Rises, Liquid Staking Sees Increase The report also highlighted a concerning trend in developer engagement. NEAR saw a significant drop in its weekly active core developers, decreasing by 41.28% from 177 to 104. Similarly, the number of weekly active ecosystem developers fell by 19.70%, from 286 to 230.  In terms of decentralized finance (DeFi), NEARs Total Value Locked (TVL) recorded a modest increase, ending Q3 at approximately $251.44 million, which is a 7.63% rise from the previous quarter.  Related Reading: Storm Ahead? Bitcoin Price Could Tumble 20% Due To M2 Supply Concerns Notably, NEARs liquid staking TVL also grew by 9.85% QoQ, reaching around $279.66 million. The LiNEAR Protocol accounted for a TVL of approximately $145.14 million, while the Meta Pool saw a 12.70% increase, totaling around $126.61 million. At the time of writing, the NEAR token is trading at $6.745 and has seen substantial gains of 27% and 46% in the fourteen and thirty day time frames respectively, while on a year-to-date basis it has seen a massive 266% surge.  Featured image from DALL-E, chart from TradingView.com

Oct 08, 2024 12:05

Crypto Analyst Predicts Hedera (HBAR) To Skyrocket 2900% This Bull Run

Crypto analyst Egrag has once again shared a bullish analysis of Hedera Hashgraph (HBAR), predicting a potential 30x increase (2,900%). His latest chart analysis (HBAR/USD) presents a view where HBAR stands in the current market cycle, highlighting key Fibonacci retracement levels and critical price points that could guide HBARs movement in the months ahead. At the time of Egrags analysis, HBAR is trading at approximately $0.0553, with a recent low marked around $0.0355. This price action in the 2-week chart is taking place along a key upward trendline that has acted as strong support multiple times since 2020. This trendline, which stretches over multiple years, has held HBARs price during dips and corrections, except for one instance in December 2019. Egrag also pinpoints several Fibonacci retracement levels, a popular tool used in technical analysis to identify potential support and resistance levels. These levels are derived from the Fibonacci sequence, where each level corresponds to a percentage of the price movement between a significant high and low. Related Reading: Hedera (HBAR) Q2 Update: Market Cap Climbs, Daily Transactions Boom, Revenue Follows In Egrags analysis, the chart showcases a range of Fibonacci levels, from Fib 0 at the absolute low of $0.0355 to Fib 1.618 at $3.27. Each of these levels indicates critical price points for HBAR as it moves through this market cycle. And according to Egrag, HBARs fundamentals are extremely strong and a 2,900% price surge is the absolute minimum. Last cycle, ADA skyrocketed a mind-blowing 17,000%! To put this into perspective, with HBAR’s bottom at 0.036c, a 170X move would take it to around $6! Thats why Im all-in on HBAR! Backed by a powerhouse Governing Council, Hedera is leading the charge with cutting-edge tech for seamless tokenization, delivering top-tier performance, rock-solid security, and unmatched compliance, Egrag notes. Key Fibonacci Levels For Hedera (HBAR) In This Bull Run Fib 0 – $0.03555: This is the lowest price on the chart, representing the local bottom that HBAR recently established. According to Egrag, this could be seen as the long-term support level and a significant historical low. Fib 0.236 – $0.0687: Currently, HBAR is trading just below this Fibonacci level. It has acted as a resistance point over recent weeks, making it a crucial zone to break through for upward momentum to continue. Historically, breaking through the Fib 0.236 level often signals the start of a bullish move towards higher retracement levels. Fib 0.382 – $0.1034: The next critical resistance level is Fib 0.382. A sustained move above this zone would indicate growing bullish momentum and a possible continuation towards even higher Fibonacci levels. Related Reading: Hedera Developer Community Remained Vibrant In Q2 2024: When Will HBAR Turn The Corner? Fib 0.5 – $0.1438: The Fib 0.5 level is one of the most closely watched by traders. It represents a psychological midpoint between the assets high and low. According to Egrag, $0.14-$0.15 is a critical range for HBAR. Until HBAR breaks above Fib 0.5 (0.14c-0.15c), everything else is just noisetime to accumulate for whats coming! Egrag claims. Fib 0.618 – $0.2004: Known as the Golden Ratio, Fib 0.618 is one of the most important levels in Fibonacci analysis. A break above this level often signals the end of a retracement and the resumption of the primary trend. For HBAR, a move above $0.20 could generate significant bullish interest, paving the way for a move towards new highs. Fib 0.702 – $0.2529: Egrag marks this level as a significant profit-taking zone. If HBAR reaches $0.25, it would represent a substantial 4.5x increase from current levels. This is a key target for traders looking to lock in profits before the next significant leg up. Fib 0.786 – $0.3199: Fib 0.786 is often the last line of resistance before an asset retests its all-time highs. Egrag identifies this as a crucial level, where many traders may choose to sell some of their holdings. Fib 1.0 – $0.5819: This level represents the previous all-time high (ATH) for HBAR. Breaking past $0.58 would indicate a complete recovery from the previous market cycle and set the stage for a potential new bull run. Egrag marks this as a key psychological level where his profit-taking area begins. Fib 1.272 – $1.2447: This is one of the extended Fibonacci levels, representing a point where HBAR could see additional gains in a bullish market scenario. Egrag mentions that breaking beyond ATH could push HBAR toward this level, making it another key profit-taking zone for long-term holders. Fib 1.414 – $1.8513: If HBAR continues its bullish momentum, it could climb towards this level, representing a major price extension. This level, according to Egrag, is where traders may choose to exit significant portions of their holdings, expecting a slowdown after a major uptrend. Fib 1.618 – $3.27: The ultimate profit-taking zone marked on Egrags chart is Fib 1.618, also known as the “Golden Extension.” A move to $3.27 would represent a near 60x move from the current price and a staggering 170x increase from the local bottom of $0.03555. Egrag views this as the maximum upside potential for HBAR in this cycle. Egrag concludes, With its killer fundamentals and cutting-edge tech, a 30X gain is right on the horizon, making HBAR my top macro play! At press time, HBAR traded at $0.0504. Featured image created with DALL.E, chart from TradingView.com

NEAR Protocol 2025 Price Prediction: Can It Reach New Heights?

Author: Arslan Tabish
Estonia
Oct 21, 2024 02:30

NEAR Protocol 2025 Price Prediction: Can It Reach New Heights?

NEAR Protocol has received massive attention on social media platforms and the expected price of the token in 2025 is still being debated. In a recent YouTube video, Cheeky Crypto laid out a detailed analysis of how high NEAR could go in the next couple of years. Applying Fibonacci retracement and Elliott Wave theory, the […]

Jan 09, 2025 02:00

Chaos on the Chains Announces Imminent Launch of The Next Frontier in Mobile AR Strategy

Genre-defining launch of a play-to-earn mobile MMORPG that blends strategy, adventure, and cutting-edge technology, powered by GPS, AR, AI, and blockchain planned for this year For the past three years, the team behind Chaos on the Chains has been quietly crafting an experience that pushes the boundaries of mobile gaming. Fusing AR, AI, and GPS […]

The post Chaos on the Chains Announces Imminent Launch of The Next Frontier in Mobile AR Strategy appeared first on CoinJournal.

Your Crypto Gateway

Claim 1,000
Free WCG Coins

World Crypto Global opens the door to digital freedom for everyone.
Manage your free WCG Coins securely—where simplicity meets global accessibility.

11 bn

FREE CRYPTO COINS

8.9 bn

AVAILABLE FOR RESERVATION

2.1 bn+

ALREADY ALLOCATED

× WCG Coin

🎉 Get 1,000 WCG Coins

No fees. No catch. Your crypto journey starts here.