W o r l d . C r y p t o . G l o b a l

Loading

Welcome at World Crypto Global. This portal is packed with useful content and resources to built out your own crypto skills. WorldCrypto is a site member of Gabriel Vega Network.

Contact Info

CATEGORY: bearish sentiment


Ethereum Is Retesting A 5-Year Long Trendline  Massive Rally Incoming?

Author: Sebastian Villafuerte
United Kingdom
Mar 19, 2025 12:10

Ethereum Is Retesting A 5-Year Long Trendline Massive Rally Incoming?

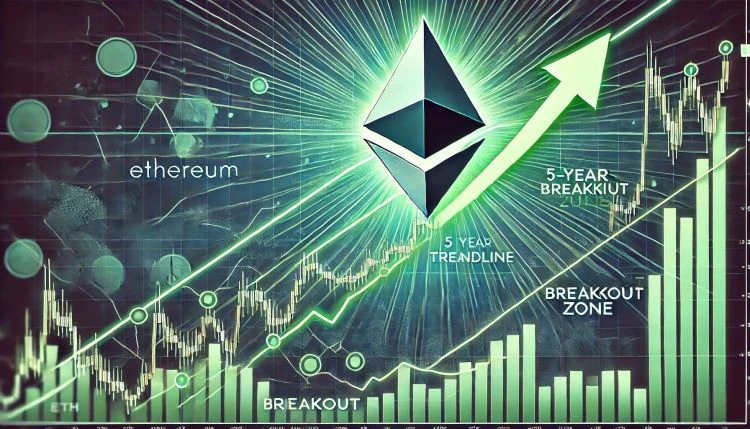
Ethereum is currently consolidating below the $2,000 mark, trading within a narrow range between $1,800 and $1,900 as market uncertainty persists. Bulls have lost control, and speculation about a potential continuation of the bear trend is growing among analysts and investors. With macroeconomic instability, rising trade war fears, and erratic policy decisions from US President Trump, both crypto and U.S. stock markets remain highly volatile, adding to Ethereums struggles. Related Reading: Solana Holds Bullish Pattern Expert Sets $140 Target To highlight Ethereums fragile position, top analyst Mister Crypto shared a technical analysis revealing that ETH is currently testing a 5-year-long trendline, a crucial level that has historically acted as strong support during major corrections. If Ethereum fails to hold this trendline, the market could see a deeper decline, reinforcing bearish sentiment and potentially pushing ETH toward lower demand zones. On the other hand, if Ethereum holds above this trendline, it could trigger a strong recovery, offering hope for bulls looking for a reversal. Over the coming days, Ethereums reaction at this level will determine its next major move, making this a pivotal moment for the second-largest cryptocurrency. Ethereum Faces Crucial Test as It Trades Below Multi-Year Support Ethereum has been under massive selling pressure, driven by macroeconomic uncertainty and trade war fears that have rattled both the crypto and U.S. stock markets. With risk assets struggling to find stability, ETH has lost key price levels and now trades below a critical multi-year support around $2,000, which could flip into strong resistance if bulls fail to reclaim it. Related Reading: 130,000 Ethereum Moved Off Exchanges Bullish Signal? Analysts warn that Ethereum’s downtrend may continue as broader economic conditions show no signs of improvement. Investors remain cautious, with global trade tensions, inflation concerns, and U.S. regulatory uncertainties weighing on market sentiment. However, despite these bearish factors, some experts believe Ethereum could be preparing for a long-term recovery. Mister Crypto’s technical analysis on X highlights that Ethereum is currently testing a 5-year-long support trendline, an even stronger level than the $2,000 demand zone. According to his insights, this trendline has historically held during major corrections and served as a key turning point for bullish reversals. If Ethereum maintains support above this level, it could trigger a significant recovery rally, pushing ETH back above $2,000 and beyond. Over the coming weeks, Ethereums price reaction at this crucial trendline will determine whether a reversal is on the horizon or if the bearish trend will extend further. ETH Bulls And Bears Battle For Control Ethereum is now at a crucial crossroads, with bulls struggling to reclaim the $2,000 mark, while bears fail to push ETH below $1,800. This prolonged consolidation phase has left investors uncertain about the next major move for ETH. For a recovery rally to take shape, bulls must reclaim the $2,300 level, which aligns with the 4-hour 200 moving average (MA) and exponential moving average (EMA). Breaking above this level would signal a shift in momentum and pave the way for further upside toward key resistance zones. However, failure to reclaim the $2,000 mark and hold above crucial moving averages could trigger another wave of selling pressure. A decisive drop below $1,800 would put Ethereum in dangerous territory, opening the door for a potential retest of lower demand zones around $1,600-$1,700. Related Reading: Whales Accumulate Over 150 Million XRP In Just 48 Hours Is A Rally Incoming? With macroeconomic uncertainty and market-wide volatility still in play, ETH traders should watch for a breakout or breakdown from the current range, as the next few sessions will determine the short-term trend for Ethereum. Featured image from Dall-E, chart from TradingView

May 11, 2023 04:45

Bitcoin Rebounds From $27,100 After Spike In Bearish Sentiment

Data shows the Bitcoin sentiment had turned quite bearish just before the asset’s price had rebounded up from the $27,100 level. Bitcoin Recovers Shortly After FUD Takes Over Market According to data from the on-chain analytics firm Santiment, investors showed high levels of fear around the time of the local bottom during the past day. The relevant indicator here is the “social volume,” which measures the total number of social media text documents that mention a given topic like cryptocurrency or Bitcoin. These social media text documents include a variety of sources, like Reddit, Twitter, Telegram, and other forums. The social volume only tracks how many such documents mention the term at least once. So this means that even if a post contains the keyword several times, its contribution to the social volume will still be only one unit. The significance of the social volume is that it tells us about the amount of discussion that certain topics are getting from social media participants at the moment. In the context of the current topic, social media is used to know the degree of the bearish and bullish sentiments in the market. Here is a chart that shows the trend in these social volumes for Bitcoin over the last week: Looks like the bearish sentiment has seen a sharp surge recently | Source: Santiment on Twitter To separate the social volume for discussions that imply a bullish mentality, terms such as “buy, bottom, bullish” have been chosen, while keywords like “sell, top, bearish” are the ones selected for pinpointing a bearish sentiment. Related Reading: Bitcoin Supply Is Moving From American Holders To Asian Wallets: Glassnode As displayed in the above graph, the Bitcoin social volume for the bearish sentiment seems to have observed a large spike during the past day. This surge in the indicator had come after BTC had plunged from above $28,000 to around $27,100. This suggests that the BTC investors had turned very fearful during this panic selloff. A similar level of bearish sentiment was also observed only a couple of days back, as the chart highlights. The turn in market mentality back then had also come following a decline (this time from the $29,000 mark to the low $27,000 levels), and interestingly, it had coincided with the local bottom in the price. Related Reading: Bitcoin Funding Rates On BitMEX Turn Deep Red, Here’s Why This Is Bullish The spike this time has also occurred simultaneously with the possible local bottom formation at $27,100, as the price of the cryptocurrency has recovered a little bit since then. Historically, whenever the market has held an opinion too unbalanced in any particular direction, the price has tended to move opposite to this opinion of the masses. Because of this, in times when the market has seen large amounts of greed, a local top has generally become more probable. Naturally, the same goes for local bottoms as well, since they have usually formed when FUD has taken over the minds of the investors. The recent spike appears to have been an example of this pattern, and so far, it looks like the latest bearish sentiment spike may also be the same. BTC Price At the time of writing, Bitcoin is trading around $27,500, down 5% in the last week. BTC seems to have been moving sideways in the last few days | Source: BTCUSD on TradingView Featured image from Maxim Hopman on Unsplash.com, charts from TradingView.com, Santiment.net

Aug 07, 2023 05:50

Report: US ETFs Signal Renewed Bitcoin Interest; BTC’s Limited ‘Hot Supply’ Eyes Bull Market

As interest in bitcoin exchange-traded funds (ETFs) heats up, a new report from blockchain analytics firm Glassnode examines how much bitcoin is actually available for purchase. The report, titled “How Many Bitcoin Are For Sale?” published on June 26, 2023, looks at exchange flows and onchain metrics to gauge bitcoin demand and supply dynamics. Bitcoin [...]

The post Report: US ETFs Signal Renewed Bitcoin Interest; BTC’s Limited ‘Hot Supply’ Eyes Bull Market appeared first on Crypto Breaking News.

Your Crypto Gateway

Claim 1,000
Free WCG Coins

World Crypto Global opens the door to digital freedom for everyone.
Manage your free WCG Coins securely—where simplicity meets global accessibility.

11 bn

FREE CRYPTO COINS

8.9 bn

AVAILABLE FOR RESERVATION

2.1 bn+

ALREADY ALLOCATED

× WCG Coin

🎉 Get 1,000 WCG Coins

No fees. No catch. Your crypto journey starts here.