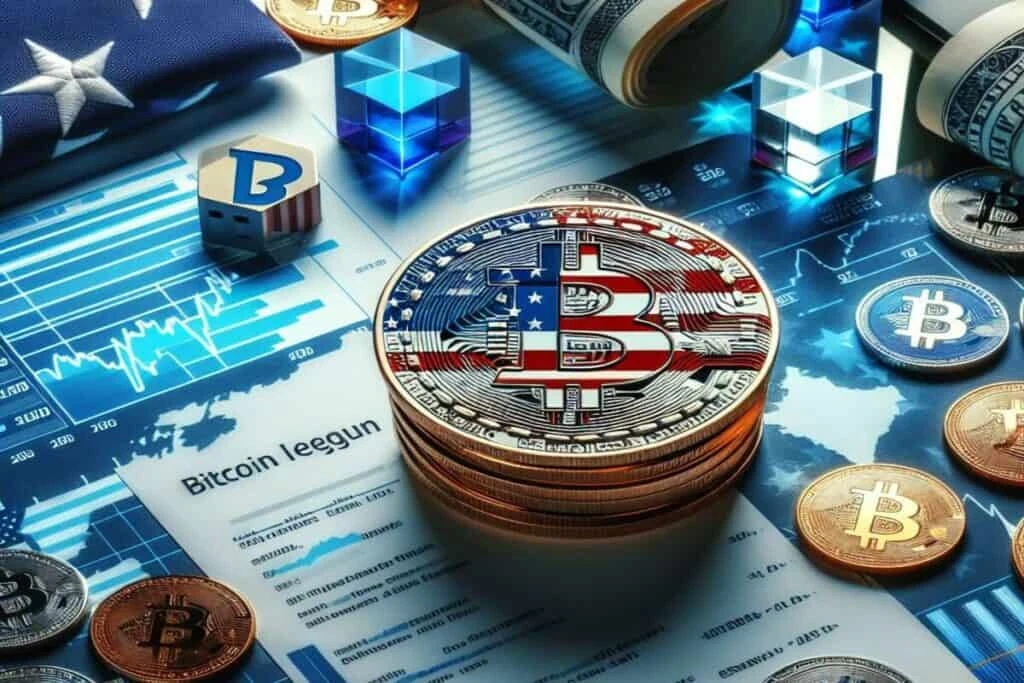
The BITCOIN Act of 2024
A brief overview of the recently proposed bill by Senator Cynthia Lummis to accumulate Bitcoin in a strategic US Reserve.
Loading
Welcome at World Crypto Global. This portal is packed with useful content and resources to built out your own crypto skills. WorldCrypto is a site member of Gabriel Vega Network.

A brief overview of the recently proposed bill by Senator Cynthia Lummis to accumulate Bitcoin in a strategic US Reserve.
The lack of retail participation is suspected of dropping Bitcoin wallet activities as celebrity memecoins attract speculators away from more established cryptocurrencies.
Sen. Cynthia Lummis reintroduces the Bitcoin Act to create a U.S. Strategic Bitcoin Reserve following President Trump's executive order on digital assets.
Data shows the Bitcoin exchange inflows and outflows have both shrunk recently as market activity has remained low. Bitcoin Exchange Inflows & Outflows Continue To Decline As per the latest weekly report from Glassnode, the BTC inflow volumes are now only around $350-$400 million per day. The “exchange inflow” is an indicator that measures the total amount of Bitcoin currently being deposited to centralized exchanges by holders. Its counterpart metric is the “exchange outflow,” and it naturally tracks the volume leaving exchange wallets. Generally, during periods of high activity in the market, both these indicators rise to high values as a large number of investors make their respective moves. However, the price may react in particular directions depending on which of these metrics is higher at the moment. Since one of the main reasons why investors use exchanges is for selling purposes, inflows outweighing outflows could be bearish for Bitcoin. On the other hand, outflows being more dominant can suggest there may instead be buying pressure in the market as investors are withdrawing their coins for accumulation. Now, here is a chart that shows the trend in the Bitcoin exchange inflows and outflows over the last few years: looks like both these metrics have declined in recent weeks | Source: Glassnode's The Week Onchain - Week 2, 2023 As shown in the above graph, the Bitcoin exchange inflows and outflows were both at high levels during the past couple of years, with their volumes remaining in the range of multi-billion dollars throughout. At the peak of inflows back in May 2021, between $2.8 billion to $3.5 billion per day was entering exchange wallets. Related Reading: Is The Bitcoin Bottom In Yet? Here’s What aSOPR Metric Suggests Recently, however, both the inflows and the outflows have significantly declined. Currently, the inflow volumes are between $350 million to $400 million per day, which are lows not seen since 2020. The outflows haven’t quite shrunk to these levels yet, possibly because of the fact that the collapse of FTX lead to renewed interest in self-custody among investors, which made them withdraw large amounts from centralized platforms. In the chart, data for the Ethereum exchange flows are also displayed. It seems like before May 2021, the Bitcoin exchange flow dominance was about 70%, which means the combined volumes of Ethereum inflows and outflows made up for 30% of the total between ETH and BTC during the period. But since May 2021, the share of the Ethereum flows has significantly increased as ETH inflows and outflows dominance is now 42%. This trend suggests that the relative trading interest in ETH has gone up in the last one and a half years, while BTC has lost some mindshare. Related Reading: Ethereum 1-Month Realized Volatility Drops To Rare Level Seen Only Thrice In History Though, in pure numbers, both cryptocurrencies have seen very little market activity recently as both their exchange inflows and outflows are at pretty low values. BTC Price At the time of writing, Bitcoin is trading around $17,200, up 3% in the last week. The value of the asset seems to have surged in the last couple of days | Source: BTCUSD on TradingView Featured image from Kanchanara on Unsplash.com, charts from TradingView.com, Glassnode.com
Quarterly returns on Bitcoin haven’t been this bad since it was trading under $20 in the early days of Mt. Gox, but the stock market isn’t faring so hot either.
Data shows that Bitcoin active addresses have sharply dropped despite the high transaction demand; here’s why this may be happening. Bitcoin Active Addresses Have Seen A Sharp Plunge Recently According to the latest weekly report from Glassnode, the active addresses are around cyclical lows of 566,000. The “active addresses” metric measures the daily number of unique Bitcoin addresses participating in some transaction activity on the blockchain. By “unique,” what’s meant here is that the indicator only checks whether an address has been involved in a transfer at least once. This implies that regardless of how many transactions an address might make, its contribution to the active addresses metric will remain just one unit. This restriction exists because the number of unique addresses can serve as an analog to the number of unique users visiting the blockchain, thus providing an estimate for the daily users on the network. Another indicator that’s made for tracking activity on the Bitcoin blockchain is the “transaction count,” which, as its name already suggests, tells us about the daily total number of transfers taking place on the network. When this metric has a high value, it naturally means that many transactions occur on the blockchain. Such indicator values imply a high demand for using the network currently, but the metric can’t say anything about how the activity is distributed; that’s where the active addresses indicator comes in. Related Reading: Bitcoin Miners Continue To Sell, Bearish Sign? Now, here is a chart that shows the trend in the Bitcoin transaction count (as well as its 30-day and 365-day simple moving averages) over the entire history of the asset: The value of the metric seems to have sharply surged recently | Source: Glassnode's The Week Onchain - Week 20, 2023 As displayed in the above graph, the Bitcoin transaction count has recently seen a rapid rise and has hit a new all-time high of about 682,000 daily transfers. The reason behind this explosion in the transaction count is the emergence of the BRC-20 tokens, fungible tokens created on the BTC blockchain using the Ordinals protocol (a way to inscribe data like text and images directly into the chain). These BRC-20 tokens have started a new memecoin mania, with PEPE being the largest example of such a coin. The insanely fast popularity of these tokens has meant that the demand for transacting on the network is more than ever before. What about the active addresses, though? Is this indicator also seeing a rise? Looks like the metric has plunged recently | Source: Glassnode's The Week Onchain - Week 20, 2023 From the chart, it’s apparent that the active addresses observed a rise at first, but then it plunged to a value of 566,000 addresses per day, around the current cyclical low. Related Reading: Stablecoins Interest Spikes As Traders Look To Exit Market This would mean that while the demand for making transactions is super high right now, the demand isn’t actually coming from a large number of users but a rather small number of them who are constantly making repeat transfers. “This is a curious scenario, whereby many BRC-20 users appear to have re-used their Bitcoin addresses,” explains Glassnode. “Perhaps due to having more familiarity with how account-based chains like Ethereum or Solana operate, and less so with the Bitcoin UTXO system.” BTC Price At the time of writing, Bitcoin is trading around $27,400, down 1% in the last week. BTC has shot up over the last 24 hours | Source: BTCUSD on TradingView Featured image from Kanchanara on Unsplash.com, charts from TradingView.com, Glassnode.com
On-chain data shows a majority of the Bitcoin supply hasn’t moved in more than two years, despite the fact that BTC has seen a significant uplift during this period. Bitcoin Inactive Supply Trend Suggests HODLing Behavior Remains Strong In a new post on X, Glassnode co-founder Rafael has discussed about the trend in the various bands of the Bitcoin Active Supply. The “Active Supply” includes that part of the BTC circulating supply that has been involved in at least one transaction over a given timeframe. Related Reading: Bitcoin Officially In Overheated MVRV Zone, Rally End Near? Below is the chart shared by the analyst that shows how the Bitcoin Active Supply has changed for a few different age bands over the last couple of years. From the graph, it’s visible that the age bands on the younger side like 1 month to 3 months and 3 months to 6 months have been observing growth recently, which suggests the relatively recent supply has been churning as a result of the price surge. The older bands, however, have been more or less showing a sideways movement on this indicator. The chart displays all the Active Supply bands up to the 1 year to 2 years group stacked on top of each other, to showcase what percentage of the total supply that they make up for. It would appear that these Active Supply bands add up to 46%, meaning that less than half of the cryptocurrency’s supply in circulation has witnessed some movement within the past couple of years. The 2-year cut off currently sits in November 2022, when the last Bitcoin bear market reached a bottom. Given the trend in the Active Supply, it seems that the investors who bought during and prior to the bottom have largely decided to HODL. Interestingly, this is despite the fact that the asset’s value has seen an uplift of more than 500% since then. “HODLing isn’t just a meme,” notes the Glassnode co-founder. Statistically, the longer investors hold onto their coins, the less likely they become to participate in selling, so considering that 54% of the supply hasn’t seen movement for over two years now, it’s possible a lot of these holders would only continue to sit tight in the near future. Related Reading: Shiba Inu Could See A 53% Surge If This Resistance Breaks, Analyst Explains In some other news, the Deribit exchange has observed massive Bitcoin outflows during the past day, as an analyst has pointed out in a CryptoQuant Quicktake post. In total, users of the platform have transferred out a net 31,000 BTC to their self-custodial wallets with these transactions. The investors may have made these moves for accumulation purposes, which can naturally be a bullish sign for the asset’s price. BTC Price Bitcoin has now gotten very close to the $100,000 dream target as its price is currently trading around the $98,900 mark. Featured image from Dall-E, CryptoQuant.com, chart from TradingView.com
The strategic Bitcoin reserve could set up Bitcoins price for an over $1 million valuation this market cycle, according to Adam Back.
The last Bitcoin halving took place in April when the block reward dropped from 6.25 Bitcoin to 3.125 Bitcoin Jesse Myers said Bitcoin’s price needs to go higher for a “supply-demand price” balance to happen When that occurs, the market will “flywheel into mania and a bubble,” which happened in the 2012, 2016, and 2020 […]
The post Post-halving 2024 market is pushing Bitcoin’s price, not just Trump, says Onramp Bitcoin co-founder appeared first on CoinJournal.
The momentum is on Bitcoin and cryptos side, and it wouldnt be surprising if the price surge continues until the end of the year. One of the biggest drivers of the current performance of Bitcoin is the election of Republican Donald Trump. Trumps rhetoric and friendly pronouncement on crypto helped propel the assets price past [...]
The post 6-Figure Treasury Asset Bitcoin Price Possible By Year-EndMarket Expert appeared first on Crypto Breaking News.
Multiple onchain metrics showed a surge in activity as Bitcoin price rallied to $68,000, possibly signaling that the price momentum is sustainable.
The Bitcoin Acts passage could eventually send BTCs price past $1 million per coin, industry executives say.
World Crypto Global opens the door to digital freedom for everyone.
Manage your free WCG Coins securely—where simplicity meets global accessibility.
FREE CRYPTO COINS
AVAILABLE FOR RESERVATION
ALREADY ALLOCATED

No fees. No catch. Your crypto journey starts here.