W o r l d . C r y p t o . G l o b a l

Loading

Welcome at World Crypto Global. This portal is packed with useful content and resources to built out your own crypto skills. WorldCrypto is a site member of Gabriel Vega Network.

Contact Info

CATEGORY: bitcoin dominance


Aug 24, 2024 05:50

Is Now a Good Time to Invest in Cryptos?

Is it a good time to invest in cryptos? I will give you 5 good reasons why you should consider investing in cryptos now. The last one is the most important. 1. Bitcoin Halving This year, in May, we had the Bitcoin halving. It’s an event that happens every 4 years, which cuts the number [...]

The post Is Now a Good Time to Invest in Cryptos? appeared first on Crypto Breaking News.

Crypto analyst doubts Bitcoin dominance is going back up to 70% again

Author: Cointelegraph by Ciaran Lyons
United States
Aug 19, 2024 12:00

Crypto analyst doubts Bitcoin dominance is going back up to 70% again

Crypto analyst Benjamin Cowen expects Bitcoin dominance to make its final move to 60% either in September or, at the latest, by December 2024.

Jul 25, 2024 05:50

When Will the Next Altcoin Season Start?

As the cryptocurrency market continues to evolve, many enthusiasts and investors are eagerly anticipating the onset of the next “altcoin season“. This term refers to a period when alternative cryptocurrencies (altcoins) experience significant price increases, often outpacing the growth of Bitcoin. But when can we expect this thrilling phase to begin? What is Altcoin Season? [...]

The post When Will the Next Altcoin Season Start? appeared first on Crypto Breaking News.

Bitcoins Grip Loosens: Market Expert Says Dominance Has Hit Its Ceiling

Author: Christian Encila
United Kingdom
May 10, 2025 12:10

Bitcoins Grip Loosens: Market Expert Says Dominance Has Hit Its Ceiling

Raoul Pal, Real Vision founder and prominent trading name, stated on Wednesday that the dominance of Bitcoin may have topped this cycle. In an X post, Pal said that DeMark Indicators’ signals point toward the potential that a change is imminent after several months of Bitcoin at the top of the market. Pal noted that daily, weekly, and monthly charts all are flashing top signals on Bitcoin dominance. Related Reading: XRP At $2.20? Analyst Insists Its Not Too Late To Get In Bitcoin dominance is now at nearly 65%, a figure that has increased steadily since December 2024. Despite this growth, it is still yet to reach the 2021 high of 74%, or the 2017 high previously. This, according to Pal, indicates a weakening trend in the percentage of the crypto market dominated by Bitcoin over time. DeMark Tops Flash Warning Signs Pal relied on technical analysis tools called DeMark Indicators, developed by market veteran Tom DeMark. They are used to identify when a trend could be losing momentum. Although Pal didn’t specifically state what the exact signals were that he watched for, one of the TD Sequential’s functions is to find turning points like this. I think BTC dominance topped today. There are daily, weekly and monthly DeMark tops in place and the top is well below 2021 top and that was below the 2017 top. If that plays out, it is the hallmark of the next phase of the Banana Zone. Let’s see… Raoul Pal (@RaoulGMI) May 8, 2025 Currently, Bitcoin is over 6% higher since the beginning of 2025 and has just reclaimed the $103k level. The coin is slowly making its way toward the $105,000 threshold. But while Bitcoin is going higher, most other cryptocurrencies have not been able to keep pace. Altcoins Have Fallen Behind Statistics indicate that the TOTAL2 index, which captures the value of the crypto market excluding Bitcoin, has fallen by almost 20% this year. It declined from $1.34 trillion to $1.07 trillion. This difference between Bitcoin and the rest of the market has contributed to increasing Bitcoin’s dominance. If Pal’s analysis is correct, this difference will soon begin to narrow. He thinks that as soon as Bitcoin dominance reaches a peak, money may begin entering altcoins. Traders usually move their focus from Bitcoin to smaller coins as soon as they feel the top coin has gotten its run out. That’s what happened before, and Pal believes the same may occur. The Banana Zone Theory Pal also mentioned what he refers to as the “Banana Zone.” It’s his terminology for a period where prices accelerate in a sharp, curved trajectory sort of like a banana. He divides this into three stages. Phase one, he says, began in November 2024, when the prices of crypto started to break out. Related Reading: Trump Trade News Ignites Bitcoin Mania$100K Coming? Now he believes were entering phase two, which he calls the Banana Singularity. Thats the part where altcoins start rising faster than Bitcoin, as more investors start hunting for bigger gains in riskier coins. This is usually when people start seeing major moves across smaller tokens. Altcoin Season May Be On The Way Pal’s message is crystal clear: Bitcoin’s time at the top may be slowing down. If the technical indicators are correct, altcoins may soon be taking center stage. It wouldn’t be the first time. In previous bull runs, capital rotated out of Bitcoin and into altcoins as the top coin’s dominance tailed off. Featured image from Unsplash, chart from TradingView

Can Altcoins Reclaim Strength as Bitcoin Dominates the Market?

Author: Arslan Tabish
Estonia
May 06, 2025 02:30

Can Altcoins Reclaim Strength as Bitcoin Dominates the Market?

Altcoins experienced their most significant price rally from the middle of 2023 until Bitcoin started incorporating its spot exchange-traded fund during January 2024. The price of major ALTs grew along with the upward movement of the OTHERS.D index across six months during that period. Since this rise in altcoin momentum that occurred in the second […]

May 22, 2025 12:10

The XRP Rebound Blueprint: Double Bottom Could Fuel A Run To $2.80 Resistance

In a recent update on X, market analyst CRYPTOWZRD highlighted a developing double bottom formation on the XRPBTC chart, suggesting a possible bullish reversal may be underway. Although XRP ended the previous session with indecisive movements, this emerging pattern could drive its price action higher. Should the reversal confirm, XRP is likely to push toward the $2.80 resistance zone.  Bitcoin Dominance Pressures Altcoins, XRP Included Expanding on his initial analysis, the analyst noted that XRP and XRPBTC closed their daily candles indecisively, reflecting ongoing market uncertainty and a lack of strong directional action. While XRPBTC is currently holding above a key double bottom formation, the analyst emphasized that the pair still appears relatively weak and requires more stable and constructive price action to confirm a bullish breakout. A strong reaction from this level could serve as a catalyst, helping XRP gain momentum from its current position on the chart. Related Reading: XRP Price Will Still Rally From Here, Crypto Veteran Raoul Pal Forecasts He also pointed out that Bitcoin dominance continues to exert pressure on altcoins, including XRP, causing them to underperform in their BTC pairs. As Bitcoin dominance approaches a major resistance level, the analyst anticipates a reversal that could shift capital flow back into altcoins. Such a reversal would provide a favorable environment and support a broader bullish continuation for XRP. Looking ahead, the analyst stated that his focus will remain on the lower time frames throughout the next trading session to determine the next scalp opportunity, particularly if XRPBTC begins to show signs of recovery and buyers step in with stronger momentum. Waiting On Confirmation: No Entry Without A Clear Move Concluding his analysis, the analyst provided his outlook for the near-term price action, noting that intraday trading was choppy and lacked clear direction throughout the session. Despite the indecisiveness, he predicts a potential upside continuation if the price breaks above the $2.4650 intraday resistance level.  Related Reading: Massive XRP Selling Pressure Is Stalling Price Action, Analyst Warns Conversely, he identified $2.3160 as a crucial intraday support level, where buyers may step in if the market pulls back. This zone will be important to watch, as a breakdown below it could delay any immediate bullish momentum and signal further consolidation. The price action between these two levels will likely define the short-term direction for XRP. He emphasized that patience is key at this stage, urging traders to wait for a clear and healthy move before considering new entries. With market conditions still uncertain, the analyst plans to stay focused on refined setups and mature formations to ensure higher-probability trades in the sessions ahead. Featured image from iStock, chart from Tradingview.com

May 03, 2025 01:05

This Surging Bitcoin Metric Suggests Altcoin Season Is Upon Us

Analyst warns Bitcoin's market share surge signals 'final leg' of macro uptrend before potential dominance collapse and altcoin rotation.

Bitcoin post-halving price consolidation could last 2 months  Bitfinex

Author: Cointelegraph by Gareth Jenkinson
United States
May 03, 2024 12:00

Bitcoin post-halving price consolidation could last 2 months Bitfinex

The Bitcoin halving is widely expected to have a positive impact on the price of the preeminent cryptocurrency, but analysts expect volatile price consolidation in the short term.

Bitcoin Dominance Dives in May as Altcoins Form Golden Cross

Author: W. E. Messamore
Bulgaria
May 19, 2025 01:00

Bitcoin Dominance Dives in May as Altcoins Form Golden Cross

Bitcoin Dominance, or market share among cryptocurrencies, took a sharp dive in May. Meanwhile, the altcoin sector has formed a bullish Golden Cross pattern on the price chart.

May 17, 2025 12:05

Ethereum Looks Ready To Break Out Of 4-Year Consolidation, Analyst Says Price Will Go Insane

Ethereum is again looking bullish following its gains of over 17% in the last seven days and the break above $2,500. Analysts have provided a positive outlook for the second-largest crypto by market cap, predicting that its price could soon go parabolic after an extended consolidation period.  Ethereum Primed To Break Out As Price Goes Parabolic  In an X post, crypto analyst Mister Crypto noted that Ethereum has been consolidating for four years and that the longer the consolidation, the bigger the pump. He added that he is extremely bullish, indicating that a breakout was imminent. His accompanying chart showed that ETH could reach a new all-time high (ATH) on this breakout.  Related Reading: Ethereum Price Completes Bullish Structure Break $3,000 Comes Next Crypto analyst Skyrexio also asserted that Ethereum will go insane soon. In a TradingView analysis, he stated that Bitcoins dominance is about to finish the uptrend, which can give ETH a second life. The analyst added that the bounce is already happening, although Ethereums price is struggling to break through $2,600.  He admitted that Ethereum could experience a small correction in the upcoming week but assured that the final uptrend has been confirmed. Analyzing ETHs weekly chart, Skyrexio opined that the crypto is on wave 3 of the Elliott wave structure. The analyst revealed a green dot on the Bullish/Bearish Reversal Bar indicator, which he claimed is a huge confirmation of the bull run.  Skyrexio stated that the target for wave 3 is the 1.61 Fibonacci at $6,500. He told market participants to consider the second scenario, when BTC dominance will reach 67% and ETH will retest the low. Whales are actively accumulating ahead of a potential price surge. Crypto analyst Ali Martinez revealed that nearly 1 million ETH have been withdrawn from exchanges in the past month.  ETH Has Broken Out Of The 3-Year Downtrend In an X post, crypto analyst Mikybull Crypto revealed that Ethereum has broken out of the 3-year downtrend. He added that from now on, ETH will outperform BTC till the cycle peak. His accompanying chart showed that the altcoin could rally to $9,000 before the end of this market cycle.  Related Reading: Ethereum Surge Above $2,200 Says Bear Market Is Over, Analyst Calls $5,791 Easy Target In another post, he reiterated this target while outlining between $8,000 and $10,000 as his targets for Ethereum in this cycle. He noted that ETH is looking to pull 2017 vibes, which is another reason he is confident that the crypto can eventually rally to as high as $10,000. Crypto analyst Titan of Crypto also predicted that the Ethereum price could soon enjoy a parabolic move, rallying to as high as $4,000.  At the time of writing, the Ethereum price is trading at around $2,587, up in the last 24 hours, according to data from CoinMarketCap. Featured image from Pixabay, chart from Tradingview.com

May 14, 2025 12:05

XRP Short-Term Movements Remain Uncertain, But 4-Hour Chart Shows Strength

XRP price action on lower timeframes, specifically under the 4-hour mark, remains notably uncertain, with erratic fluctuations and a lack of clear directional bias. However, a deeper analysis reveals that the broader structure on the 4-hour chart is offering more constructive insights. Despite the choppy short-term moves, the 4-hour timeframe maintains a bullish formation, suggesting that underlying momentum may be building.  The Bigger Picture For XRP A key insight shared by market analyst Andrew Griffiths suggests that a decisive move toward the bullish order block between 2.3907 and 2.3277, coupled with strong bearish momentum, could indicate the early signs of a structural breakdown. Related Reading: XRP Price Eyes Breakout: Can It Shatter Resistance and Reignite the Rally? In his recent post on X, Griffiths emphasized that this price zone has historically acted as a significant area of demand, where buyers typically step in to defend support. However, if sellers dominate this region and the price fails to hold, it could signal a shift in market dynamics, potentially invalidating the current bullish setup. Despite this technical vulnerability, the overall crypto market sentiment continues to lean bullish. Bitcoins dominance remains firm, while the TOTAL2 chart, which reflects the performance of altcoins excluding Bitcoin, maintains a bullish market structure.  These broader trends support the idea that current weakness may be a temporary shakeout rather than the start of a deeper reversal. As such, price action around the order block is key, as it could serve as a turning point in the days ahead. Trade Setup: Waiting for Confirmation at Key Levels Andrew Griffiths outlined a strategic trading approach centered around the 4-hour bullish order block between 2.3907 and 2.3277. According to Griffiths, a price test of this zone, if accompanied by weak bearish momentum, could present a favorable buying opportunity.  Related Reading: Analyst Says These Factors Will Drive XRP Price To $1,000, But What Does Market Cap Say? This aligns with his personal trading methodology, which focuses on identifying high-probability entries where price reacts to key levels with signs of exhaustion from the opposing side. For traders looking to capitalize on potential long setups, this zone may serve as an ideal area for entry, provided certain conditions align. Signs such as decreasing sell volume, long lower wicks (indicating rejection), or bullish candlestick formations within or just above the zone may act as confirmation of weakening bearish pressure.  Griffiths also emphasizes the importance of waiting for a clear reaction, rather than preemptively entering a position, to reduce the risk of a deeper breakdown. A well-placed stop-loss just below the lower boundary of the order block (2.3277) could offer a favorable risk-reward ratio, especially if the broader trend resumes to the upside. Featured image from Getty Images, chart from Tradingview.com

May 13, 2025 12:05

XRP Price Surge To $10: Analyst Reveals Factors That Will Make It Happen In 2025

Following the XRP price’s stellar performance in the current bull cycle, a crypto analyst has now predicted that the value of the third-largest cryptocurrency could soon soar to $10 or more in 2025. This bullish projection is backed by several key factors expected to drive strong demand and boost global adoption.  Factors That Could Push XRP Price To $10 Unlike past cycles, when XRP pumped toward the tail end of the bull market, this time, it has emerged as one of the top-performing altcoins early on. Expanding on this impressive performance, X (formerly Twitter) crypto analyst and XRP supporter Edo Farina has shared a video analysis of the cryptocurrency, predicting the tokens potential price outlook and outlining different factors that could drive this surge.  Related Reading: Analyst Says These Factors Will Drive XRP Price To $1,000, But What Does Market Cap Say? The analyst has highlighted the influence of Bitcoin Dominance (BTC.D), which he sees as a critical indicator for altcoin movements. According to him, BTC.D currently remains relatively high. However, historically, the dominance dropped from 40% to 30%, marking the onset of the altcoin season. This expected drop in Bitcoin’s Dominance could serve as the trigger for a broader altcoin market breakout, positioning the XRP price for a potential 4X rally from current levels. According to Farina, a 4X jump from $2.39 could easily propel XRP toward the $10 mark.  Key to this optimism and bullish outlook is the recent resolution of the lawsuit between the US Securities and Exchange Commission (SEC) and Ripple. With legal battles seemingly behind it, XRP is no longer classified as a security in the US, giving Ripple the green light to offer the token to financial institutions. Farina has suggested that this newfound regulatory clarity is expected to bolster investor confidence and lay the groundwork for global adoption. Achieving a $10 price point will also require more than a shift in market sentiment. Farina explains that it will depend heavily on XRPs integration into the global financial system. The analyst argues that XRP must become the cornerstone, especially in cross-border payments and Real World Asset (RWA) tokenization. Ripple has already taken significant steps in this direction, reportedly playing a role in the roll-out of the digital Euro.  Ripple is also making strategic acquisitions, such as its acquisition of Hidden Road and the potential  purchase of Circle, which could exponentially expand its influence in traditional finance. The analyst further notes that the possible launch of XRP ETFs could significantly impact the tokens price dynamics. If approved by the SEC and more ETFs hit the market, investor demand is expected to skyrocket, potentially driving prices toward or even beyond $10 in 2025. How Much Will 1,000 XRP Be Worth In 2025? In his analysis, Farina estimated how much 1,000 XRP could be worth in 2025 if its price surges to $10 and above. At $10, a modest holding of 1,000 XRP would be worth $10,000.  Related Reading: XRP Price Still On Bullish Path To $5 As Long As This Level Holds If financial adoption accelerates as Farina projects, XRP could climb well beyond $10, potentially reaching $100. In that scenario, a 1,000 XRP bag could soar to $100,000 profit, potentially offering life-changing returns for long-term investors. Featured image from Getty Images, chart from Tradingview.com

Is the altcoin market set for an explosive rally? Analysts eye these 3 indicators

Author: Cointelegraph by Ciaran Lyons
United States
May 13, 2024 12:00

Is the altcoin market set for an explosive rally? Analysts eye these 3 indicators

Although the altcoin market cap has declined nearly 20% over the past month, traders remain bullish, anticipating that an explosive rally phase is yet to come.

Apr 30, 2024 05:50

Bitcoin Dominance: Traders Preferring The OG To Dogecoin & Other Altcoins

On-chain data suggests Bitcoin has recently experienced an influx of investors while Dogecoin, Cardano, and other altcoins have seen a slowdown. Bitcoin Total Amount Of Holders Rise While Altcoins See Flat Movement According to data from the on-chain analytics firm Santiment, the number of Bitcoin investors has sharply increased recently. The on-chain metric of interest [...]

The post Bitcoin Dominance: Traders Preferring The OG To Dogecoin & Other Altcoins appeared first on Crypto Breaking News.

Apr 23, 2025 12:05

Ethereum At $9,200, XRP At $5,800, And Solana At $3,400? Analyst Says This Is Not Possible

Cryptocurrency prices are starting to grind through a period of slow but steady gains in the past 48 hours, with Bitcoin again leading the charge and most altcoins lagging in recovery. In a recent post on the X platform, popular Bitcoin maximalist and CEO of JAN3,  Samson Mow, described the misleading nature of unit bias among altcoins. According to Mow, Ethereum at $9,200, XRP at $5,800, and Solana at $3,400 is virtually impossible, given the current supply of these tokens. Unit Bias And Market Cap: The Numbers Don’t Lie Mow’s post on X challenges how investors perceive the value of altcoins like Ethereum, XRP, and Solana. He proposed a reframing of altcoin valuations by applying Bitcoin’s supply model to them. Bitcoin was created with a total possible circulating supply of 21 million units, with 19.85 million of those currently in circulation. Related Reading: Samson Mow Dumps Bitcoin Bombshell: Current Price Action Is Manufactured, Not Natural At the time of writing, one unit of 21 million Bitcoins is trading around $88,000. This price might be too much for retail traders. As such, the idea of owning a whole unit of XRP or Solana feels more accessible to newcomers and retail traders compared to buying a fraction of Bitcoin with the same capital.  To expose how misleading this mindset can be, Mow reimagines altcoin valuations by dividing their total market capitalizations by Bitcoins 21 million supply cap. This is essentially asking what one unit of these assets would cost if they had the same scarcity of supply as Bitcoin. Based on current market caps, Ethereum would be valued at approximately $9,200, XRP at $5,800, and Solana at $3,400.  Given the current price of Ethereum, Solana, and XRP, these figures are unrealistic and reveal how much of the altcoin appeal is driven by unit bias rather than actual value. Furthermore, it shows that Bitcoin has better fundamentals and scarcity in its supply dynamics. Narrative Of Bitcoin Dominance Getting Stronger For Mow and other Bitcoin maximalists, the disparity in Bitcoin supply and that of popular altcoins is yet another reason why Bitcoin dominance is likely to grow stronger in the long run. Notably, the inflows into spot Bitcoin ETFs and increasing recognition among traditional finance investors are strengthening the case for Bitcoin’s dominance going forward. Related Reading: Is It Time For Altcoin Season? Bitcoin Dominance Rises To Major Rejection Zone Notably, Mows perspective stands in opposition to the outlook held by some analysts who still anticipate an incoming altcoin season. These analysts believe that Bitcoin dominance, despite currently sitting at a yearly high of 63.5%, could be on the verge of a reversal. One notable technical analysis even projected a sharp crash in dominance toward the 40% mark in the coming months. At the time of writing, Bitcoin is trading at $88,530, up by 1.3% in the past 24 hours. Ethereum is trading at $1,620, representing a 1.5% decline over the same period. Solana is down 0.5% at $140, and XRP is trading at $2.09 after a 1.63% decline in the past day. Featured image from Pixabay, chart from Tradingview.com

Apr 20, 2025 12:05

Bitcoin Dominance At Risk Of Crash To 40%, Why This Is Good For Ethereum, XRP, And Altcoins

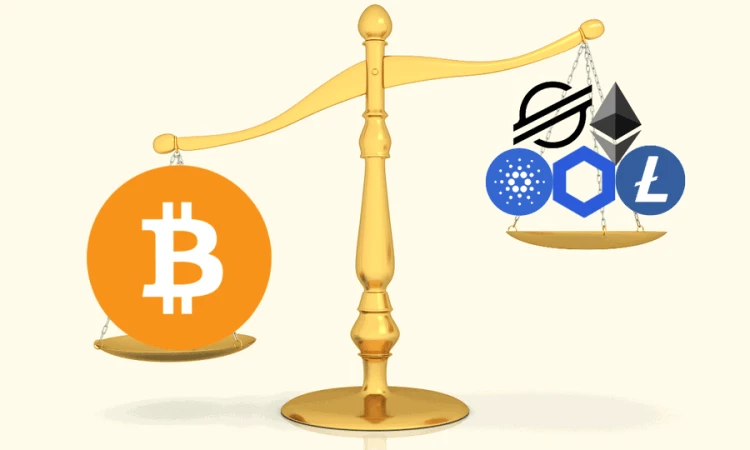
The Bitcoin dominance in the cryptocurrency market is inching dangerously close to a long-term resistance level that has triggered major reversals in the past. This resistance level is highlighted on the weekly BTC.D candlestick timeframe chart.  Each time the dominance taps this descending trendline, it struggles to break through and eventually tumbles. Notably, Bitcoin’s dominance is now back around this resistance, and a technical outlook posted on the TradingView platform points to a crash to 40% within the next months. Bitcoin Dominance Could Crash To 40%: Good For The Altcoin Market The dynamics behind Bitcoin’s dominance have been different this cycle compared to previous ones. This is because the dominance has grown massively since the beginning of this cycle, leaving little room for an altcoin season like many have continued to expect. At the time of writing, Bitcoin’s market dominance is sitting at a yearly high of 63.2%, according to data from CoinMarketCap. Related Reading: Solana Price Enters Consolidation Trend Above $130 That Could End In A Breakout However, an interesting technical analysis shows that the Bitcoin dominance is now tapping on a resistance trendline that puts it at risk of crashing below 40%, up until 34.9%. If that pattern holds true once again, the crypto market could be approaching a phase where Ethereum, XRP, and other altcoins regain strength in what many hope will be the next altseason. A drop in Bitcoin dominance will bode positively for altcoins, since it indicates that the altcoin market is outperforming Bitcoin. This will be characterized by a widespread increase in the prices of major altcoins, such as Ethereum, Solana, and XRP. In such a case, tokens like Ethereum, XRP, Cardano, Chainlink, BNB, and Litecoin, the so-called DINO coins that have survived multiple market cycles, are most likely to draw early attention from retail traders. However, unlike past bull runs, when only a few hundred altcoins existed and most received some attention, the crypto market is now saturated with thousands of altcoins. After the large market-cap altcoins, the rotation could move toward more niche sectors. Sectors such as Artificial Intelligence (AI), Real World Assets (RWA), and DeFi may also attract attention, but even within these categories, a strong filtering process will be applied to select the altcoins that will perform better.  Can Bitcoin Dominance Really Crash To 40%? The Bitcoin dominance crashing to 40% is not a new phenomenon, looking at how the 2017 and 2021 bull markets unfolded. However, such a phenomenon happening again is becoming increasingly difficult, considering Bitcoin’s position in the investment world today through Spot Bitcoin ETFs. These funds in these ETFs are locked up for the long term, meaning a rejection in BTC dominance may not automatically result in massive liquidity flows into the altcoin market, as seen in 2021 and 2017. Related Reading: Cardano Price Surge To $1.7: Here Are The Factors To Drive The Recovery Even if Bitcoin dominance crashes toward 40% and ushers in a new altcoin cycle, many altcoins will eventually end in brutal drawdowns. Across past market cycles, the majority of altcoins have suffered losses of over 90% once bullish sentiment fades and capital flows back into stablecoins. Featured image from Dall.E, chart from TradingView.com

Apr 16, 2025 12:05

Forget XRP At $3, Analyst Reveals How High Price Will Be In A Few Months

XRP may have spent the past few weeks struggling to hold above the $2 level, but one analyst believes the recent price action is only in its early stages of a much larger surge. For those who think $3 is a reasonable target, this outlook predicted that the real move could take the altcoin far beyond that mark and possibly much sooner than expected. Multi-Stage Price Path With $10 To $20 The $3 price level has become the psychological and technical battleground for bullish XRP investors this cycle, serving as the most active price point. Earlier in January, the token briefly surged past this level, coming within striking distance of its all-time high of $3.40, before a wave of selling pressure triggered a pullback. Related Reading: XRP Price Forms Rounded Bottom Within Descending Channel, Target Set Above $3 Since then, XRP has seen price corrections that pushed it as low as $1.65 on April 7. Yet, the outlook is once again tilting bullish. XRP has rebounded above $2 and is building a strong base to support another run toward $3. If the current momentum continues to gain traction, reclaiming $3 is not only likely, it could happen within a matter of weeks. One of the boldest predictions comes from a trader known as BarriC, who has laid out a roadmap that extends far beyond the $3 threshold. In a recent post on social media platform X, he forecasted that XRP, now trading near $2.20, will break $3 soon. But his outlook doesnt stop there. He predicted that by May, the sentiment surrounding XRP could shift so drastically that $5 would be seen as the new cheap price for XRP.  Taking things a step further, the analyst noted that if the broader crypto market transitions into a full-blown altcoin season, XRP could establish a new short-term trading range between $10 and $20 within the next few months. Utility Run Scenario Places Cheap XRP Closer To $1,000 Perhaps the most striking part of BarriCs analysis comes from what he describes as a utility run. This utility run is a scenario where XRPs real-world use cases as a bridge cryptocurrency start to gain adoption and reflect in its price. Under such conditions, the term cheap XRP would apply to prices below $1,000. Related Reading: XRP Price Flashes Symmetrical Triangle From 2017, A Repeat Could Send It as Flying To $30 At the time of writing, XRP is trading at $2.14, up by 1.4% in the past 24 hours. As ultra-bullish as it might seem, the analyst’s price prediction isn’t surprising, as the cryptocurrency has been subjected to similar bullish outlooks in the past few days.  Beyond bullish price targets, a few analysts now believe that XRP will flip both Ethereum and Bitcoin in the coming months. One such example is analyst Axel Rodd, who cited the breakdown in Bitcoin dominance as a reason why XRP will flip Bitcoin. Similarly, analysts at Standard Chartered recently predicted that the altcoin will flip Ethereum in market cap by 2028.   Featured image from Adobe Stock, chart from Tradingview.com

Apr 16, 2024 12:05

Increased Bitcoin ETF Adoption Propels BTC Dominance To Highest Level Since 2021

Bitcoin’s dominance within the cryptocurrency market has reached a three-year high, signaling strong demand for US spot Bitcoin ETF holding the largest digital asset and a challenging period for smaller tokens. Bitcoin accounted for nearly 55% of the $2.4 trillion digital asset market at the end of last week, a level not seen since April 2021. On Saturday, in particular, BTC’s dominance jumped to 57% as it briefly touched the $67,000 mark.  The next largest tokens by market share include Ethereum (ETH), Tether’s USDT stablecoin, Binance exchange’s native token Binance Coin (BNB), and Solana (SOL). BTCs Rise Fueled By Successful US Bitcoin ETF Launches According to Bloomberg, the recent success of the recently approved US spot Bitcoin ETFs from prominent issuers such as BlackRock and Fidelity Investments has played a significant role in Bitcoin’s rise.  These ETFs have garnered approximately $56 billion in assets, making their debut one of the most successful in fund category history. Related Reading: XRP Poised For Takeoff: Analysts Predict Huge Gains After Bitcoin Halving The inflows into these ETFs drove BTC to its current all-time high (ATH) of $73,798 in mid-March, a clear resistance level for the largest cryptocurrency on the market, as evidenced by its inability to consolidate above the $70,000 level following this achievement.  Although BTC is down about 6% since then, smaller digital assets such as Avalanche (AVAX), Polkadot (DOT), and Chainlink (LINK) have seen more significant declines of nearly 30% over the past month.  This drop coincided with reduced expectations for looser US monetary policy settings, often fueling speculative gains. Hong Kong-Listed ETFs Boosts Bitcoin And Ethereum Institutional investors’ allocations to the US Bitcoin ETF have greatly influenced Bitcoin’s performance relative to the rest of the market. Benjamin Celermajer, director of digital-asset investment at Magnet Capital, noted that strong institutional demand is a key driver. On Monday, Bitcoin and Ethereum, the second-largest cryptocurrency, saw notable price jumps following indications that asset managers are preparing to launch Hong Kong-listed ETFs on both tokens. Bitcoin rose 4.3% to $66,575, while ETH jumped 6.2% to $3,260.  These rallies had a positive impact on the broader crypto market, lifting other notable tokens such as Polygon (MATIC), Cardano (ADA), the dog-themed meme coin Dogecoin (DOGE), and Solana, which is now the top 5 cryptocurrency market winner, up over 8% on Monday. Related Reading: Shiba Inu Insider Reveals Top 5 Shibarium Investment Rules Interestingly, the Bloomberg Galaxy Crypto Index, which measures the performance of the largest digital assets traded in US dollars, has more than tripled since the beginning of last year, marking a significant rebound from the bear market experienced in 2022. Lastly, investors and traders eagerly anticipate the upcoming Bitcoin Halving, an event that will cut the new supply of the token in half, expected around April 20th.  Previous Halving events have acted as a tailwind for prices, although there are growing doubts about whether history will repeat itself given BTC’s recent all-time high achievement.  BTC has successfully maintained its position above the $66,000 threshold and has consolidated in this range. However, it is important to note that losses have accumulated over longer time frames.  Over the past fourteen and thirty days of trading, the cryptocurrency has experienced significant declines of over 21% and 24% respectively. Featured image from Shutterstock, chart from TradingView.com

Apr 12, 2025 12:05

Bitcoin Dominance: BTCs MVRV Outpaces ETHs For Record 812 Days

On-chain data shows the Bitcoin Market Value to Realized Value (MVRV) Ratio is currently on a record streak against the metric for Ethereum. Bitcoin Has Continued To Dominate Ethereum In MVRV Recently In its latest weekly report, the on-chain analytics firm Glassnode has discussed about the divergence forming between Bitcoin and Ethereum. First, below is a chart that shows how the two cryptocurrencies have compared in terms of the Realized Cap growth since the start of the bull cycle. The “Realized Cap” here refers to an indicator that measures the total amount of capital that the investors of a given asset as a whole have invested into it. Changes in this metric, therefore, reflect the amount of capital going in/out of the cryptocurrency. Related Reading: Bitcoin Breakout Above This Level Could Set Stage For $208,550 Top, Analyst Says From the graph, it’s visible that Bitcoin has observed a massive increase of $468 billion in the Realized Cap since the bear market bottom back in November 2022. In this same window, Ethereum has seen inflows amounting to only $61 billion. As the analytics firm explains, This disparity in capital inflows between the two assets partly underscores why these assets have experienced diverging performance since 2023. Ethereum has experienced a relatively smaller inflow of demand and fresh capital this cycle, which has resulted in weaker price appreciation and a lack of a fresh ATH, despite Bitcoin prices reaching over $100k in December. Divergence between the assets has also formed in another metric: the MVRV Ratio. This indicator keeps track of the ratio between the Market Cap of an asset and its Realized Cap. Since the Market Cap represents the value the holders are carrying in the present, its comparison against the Realized Cap in the MVRV Ratio tells us about the profit-loss status of the investors as a whole. As is visible in the above graph, Bitcoin’s MVRV Ratio diverged from Ethereum’s around the start of the bull market. This implies that BTC investors have consistently enjoyed a higher amount of unrealized profits in this cycle. In the recent market downturn so far, ETH has taken a larger hit than BTC, so its MVRV Ratio has also declined at a faster rate. BTC investors as a whole are still in the green, but ETH holders are now underwater as the indicator for it has dipped under the 1 mark. Related Reading: 62.8% Of XRP Realized Cap Held By New Investors: Sign Of Fragility? To better showcase the disparity in the MVRV Ratio of the two coins, Glassnode has charted the difference between the two. As displayed in the graph, the difference between the Bitcoin and Ethereum MVRV Ratio has remained positive for 812 consecutive days now, which is the longest streak in history. BTC Price At the time of writing, Bitcoin is floating around $79,300, down over 3% in the last seven days. Featured image from Dall-E, Glassnode.com, chart from TradingView.com

Mar 23, 2025 12:05

Bitcoin Dominance To Peak At 68% Altcoin Season Incoming?

Amidst the ongoing consolidation in the crypto market, an analyst with X pseudonym cryptododo7 has observed certain developments with the Bitcoin dominance that could spell significant implications.  Related Reading: Bitcoin Dominance Tipped To Hit 57% Altseason Incoming? Bitcoin Dominance Climbs Higher As Altcoins Prepare For Takeoff In a recent X post on March 21, cryptododo7 shared a technical analysis on the Bitcoin Dominance chart hinting at a possible altseason. The crypto analyst noted that Bitcoin Dominance may be poised for a sustained uptrend following a breakout and successful retest of a bullish pennant formation at the 61.25% level. Generally, the bullish pennant forms after a strong upward price movement as seen in early 2025 in the chart below. This price surge (known as the flagpole) is followed by a consolidation phase in which price movements make higher lows and lower highs thereby forming a symmetrical triangle i.e. the pennant. With a successful breakout and retest of the bullish pennant, Bitcoin Dominance has confirmed expectations of a major surge, with Cryptododo7 predicting a potential target of 67.51%. However, the crypto analyst cautions that this rise may not signal a market-wide rally,  as Bitcoin Dominance may surge alongside a decline in Bitcoin and altcoins price. Albeit, the analyst further states this projected dominance top of 67.51% will potentially represent the peak of Bitcoin Dominance in this bear market, signaling a possible altseason. The altseason, which is a prominent period in the crypto market cycle, is marked by altcoins outperformance of Bitcoin which is confirmed by a decline in Bitcoin Dominance. Certain analysts have previously beaten down the odds of an altseason in the current cycle citing a massive increase in altcoin numbers over the last four years. However, other analysts such as Cryptododo7 remain optimistic stating an altseason will likely follow Bitcoin Dominances surge to 67.51%. During this period, altcoins are expected to experience massive capital inflows potentially as high as $627 billion. Related Reading: Investors Withdraw 360,000 Ethereum From Exchanges In Just 48 Hours Accumulation Trend? MACD Curl Hints At Possible Reversal – More Positives For The Altseason? In other developments, X platform MoreCryptoOnline reports the Weekly MACD (Moving Average Convergence Divergence) of the total crypto market cap (excluding the top 10 coins) is beginning to curl upwards indicating a potential bullish shift in the altcoin market. For context, the MACD is a commonly used momentum indicator that helps identify potential trend reversals. And while this signal suggests a possible shift, it remains an early-stage confirmation of the altseason. At press time, the total crypto market capitalization stands at $2.76 trillion, with Bitcoin accounting for $1.67 trillion of this value. Meanwhile, the CoinMarketCap Altseason Index sits at 21, suggesting that an altcoin boom is not yet imminent. Featured image from DEXYNTH, chart from Tradingview

Your Crypto Gateway

Claim 1,000
Free WCG Coins

World Crypto Global opens the door to digital freedom for everyone.
Manage your free WCG Coins securely—where simplicity meets global accessibility.

11 bn

FREE CRYPTO COINS

8.9 bn

AVAILABLE FOR RESERVATION

2.1 bn+

ALREADY ALLOCATED

× WCG Coin

🎉 Get 1,000 WCG Coins

No fees. No catch. Your crypto journey starts here.