W o r l d . C r y p t o . G l o b a l

Loading

Welcome at World Crypto Global. This portal is packed with useful content and resources to built out your own crypto skills. WorldCrypto is a site member of Gabriel Vega Network.

Contact Info

CATEGORY: breakdown


Apr 07, 2025 12:10

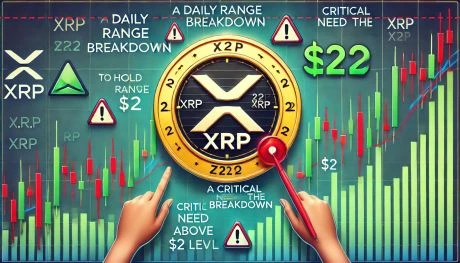
XRP High Stakes Setup: Analyst Warns Of Sharp Move To $17 Or $0.65

Renowned market analyst Egrag Crypto has shared another puzzling XRP price prediction stating the altcoin is at a major technical crossroads. This development follows a resilient price performance in the past week during which XRP gained by 2.07% as the broader crypto market stands bullish despite the announcement of new US trade tariffs. Related Reading: Cardano (ADA) At A Crossroads As Fibonacci Level Indicates Potential Fall To $0.42 Ascending Wedge Signals Incoming Volatility Which Way Will XRP Break? In an X post on April 5, Egrag Crypto issued a dual price forecast on the XRP market based on the potential implications of a forming Ascending Broadening Wedge pattern. Also known as the megaphone pattern, the chart formation signals increasing volatility and investor indecisions. It looks like a widening triangle with two diverging trendlines, as seen in the chart below. The Ascending Broadening Wedge presents high unpredictability and offers a 70% chance of a downside breakout and a 30% probability of an upside breakout. However, despite this statistical bias, the analyst postulates the chances of an upside remain valid if certain conditions are met. According to the analyst, XRP must first close above $3.50 for a bullish scenario to start taking shape. In doing so, the altcoin would surpass the local peak of the current bull cycle and confirm intentions of an upward momentum. Following this move, XRP bulls should then aim for the $5 rangeanother key resistance level that could determine the asset’s next major move. Interestingly, Egrag explains that a failure to convincingly close above $5 would only be a critical development that completes the formation of the Ascending Wedge Pattern and increases the likelihood of a breakout. If this rejection occurs, XRP is expected to retest the $1.90 area and make a second push toward the $5, this time breaking through and closing above $6. Egrag states the breakout above $6 would validate the bullish run and likely spark a surge toward double-digit territory with a potential target at $17.50 based on the Ascending Wedge Pattern. However, should XRP bulls fail to meet these conditions or follow this sequence, the historical 70% chance of a breakdown points to a downside target of around $0.65. Related Reading: Ethereum, Solana And Cardano Trend After Crypto Crash Heres What You Should Know XRP Price Overview At the time of writing, XRP trades at $2.14 reflecting a price gain of 0.60% in the past day. Meanwhile, the tokens trading volume is down by 62.92% in the past day indicating a fall in market engagement and a declining buying pressure following the recent market gain. In making any significant uptrend, XRP bulls must first reclaim the following resistances at $2.47 and $2.61 while avoiding any slip below the $2 support zone. Featured image from Outlook Business, chart from Tradingview

Mar 07, 2025 05:55

Reasons Behind Bitcoin Price Rebound Breakdown Before Reaching Key Level

After showing signs of recovery, the Bitcoin price rally faltered just before reaching a critical level. Let’s explore the reasons behind this unexpected breakdown in the market. Bitcoin, the leading cryptocurrency, experienced a brief resurgence in value before encountering a significant resistance level. This sharp reversal puzzled many investors who were hopeful for a sustained [...]

The post Reasons Behind Bitcoin Price Rebound Breakdown Before Reaching Key Level appeared first on Crypto Breaking News.

Mar 30, 2025 03:30

Walrus (WAL) Shows No Signs of Reversal: Watch for Break Below $0.3784

Walrus (WAL) is experiencing a steep decline, currently trading at $0.4035, reflecting a sharp 14.56% drop over the past day. This downturn aligns with Bitcoins massive price decline, which has triggered a widespread sell-off across the crypto market. Walrus Technical Breakdown: Bears in Full Control From a technical perspective, Walrus has fallen below all major […]

Solana Holds Bullish Pattern  Expert Sets $140 Target

Author: Sebastian Villafuerte
United Kingdom
Mar 18, 2025 12:10

Solana Holds Bullish Pattern Expert Sets $140 Target

Solana (SOL) has been under intense selling pressure, with the price failing to reclaim key resistance levels after weeks of fear-driven market conditions. Bulls lost control when SOL dropped below $180, a crucial support level that previously held firm. Since then, bearish sentiment has dominated, with speculation rising about a potential bear market for SOL and the broader altcoin sector. Related Reading: 640,000 Chainlink (LINK) Withdrawn From Exchanges In 24 Hours Bullish Accumulation? Despite this negative outlook, there may be a glimmer of hope for Solana bulls. Top analyst Ali Martinez shared a technical analysis on X, revealing that SOL is forming a bullish channel in the short-term time frame. This pattern suggests that if Solana holds within this formation, a surge to higher price levels could follow. For this bullish scenario to play out, SOL must hold the lower trendline of the channel and push toward higher resistances. A breakout from this pattern could signal a strong recovery, potentially reversing the downtrend that has dominated the market for weeks. However, if Solana fails to maintain this structure, the risk of further downside remains high. The next few days will be crucial in determining SOLs short-term direction. Solana Faces Risks Amid Volatility Solana has faced relentless selling pressure since hitting its all-time high of $261 in January, now down 61% from that peak. As hopes for a massive bull run fade, speculation around a potential bear market continues to grow. The broader macroeconomic environment remains unfavorable, with trade war fears and economic uncertainty pushing down not just the crypto market but also the U.S. stock market. Investors are now looking for signs of a reversal, and technical indicators suggest a potential short-term recovery. Martinez’s analysis on X reveals that Solana is forming a bullish channel and is eyeing a climb from the channels base to the upper resistance at $140. If this pattern holds, SOL could push toward $140 and even higher levels, signaling a relief rally. For this bullish outlook to materialize, Solana must maintain its current trendline support and break through key resistance levels. If SOL fails to hold this channel, it could face further downside, reinforcing fears of a prolonged bear market. The next few days will be crucial in determining whether Solana can reclaim momentum or continue its downward trajectory. Related Reading: Whales Accumulate Over 150 Million XRP In Just 48 Hours Is A Rally Incoming? Solana Struggles As Bulls Fight to Regain Momentum Solana (SOL) is currently trading at $129, following days of consolidation between $136 and $111. The price action remains uncertain, with bulls struggling to regain control after weeks of selling pressure. For a potential reversal, SOL must break above the $140 resistance level and push toward $160, a key level that would signal a shift in market structure. If bulls successfully reclaim these price points, a stronger recovery phase could begin, potentially attracting new buyers back into the market. However, if Solana fails to hold the $125 support, it could trigger a wave of selling pressure, sending the price toward lower demand zones. A break below this level could expose SOL to a drop toward $110 or even lower, reinforcing concerns that the current downtrend is far from over. Related Reading: Ethereum Must Reclaim $2,050 To Start A Recovery Rally Insights The next few trading sessions will be crucial in determining whether Solana can reclaim momentum or if further declines are ahead. Featured image from Dall-E, chart from TradingView

Mar 14, 2025 12:05

Solana (SOL) Retests Crucial Support Level Is A 50% Price Drop On The Horizon?

Solana (SOL) has seen a nearly 40% retrace over the past month, losing key support levels since February. As its price retests a key horizontal level, some analysts warn of a potential 50% correction to a yearly low. Related Reading: Solana Falls Under Realized Price: Heres What Happened Last Time Solana Loses Key Support Level Solana has been one of the leading cryptocurrencies of the cycle, fueled by the markets memecoin frenzy. The altcoin climbed over 270% in a year to its latest all-time high (ATH) of $270, registered nearly two months ago. Nonetheless, SOLs bullish sentiment has significantly decreased since January, recently plummeting to its lowest point in over a year. As a result, the cryptocurrency has dropped over 50% from its January 19 ATH. Solana lost the key $200-$220 support zone at the start of last month, with the February market crashes sending SOL to retest its next crucial levels. After losing the $180 mark two weeks ago, its price hovered between the $130-$150 range, surging to the $179 mark at the start of March. This weeks market correction, which saw Bitcoin (BTC) drop to $76,000 for the first time in four months, has sent Solana to new monthly lows. On Tuesday, SOLs price briefly dropped to $111, a level not seen since the August 2024 market crash, before bouncing back to $125. Amid the ongoing retest, pseudonym trader Crypto Busy warned that SOL must hold this crucial support to maintain a bullish sentiment above $100. Crypto analyst Ali Martinez previously noted that the most crucial zone for Solana appears to be between $110 and $125, as this horizontal level served as a key support during its 2021 and 2024 rallies. The analyst suggested that holding above this range could be key for the next move. SOL Price Risks Move To $60 Martinez also pointed out that Solana could be on the verge of a breakdown, as it has broken below its key level. According to the post, SOL risks a 50% crash to the $60 mark if it fails to hold the $125 support zone. The analyst highlighted that the cryptocurrency has been forming a right angle ascending broadening pattern since March 2024, when it first reclaimed the level during this cycle. During this period, every higher high on Solanas chart has created a rising trendline at the top of the pattern, while the $125 support has held as a strong horizontal support trendline. Related Reading: Ethereum Risks Another 15% Correction After Fall Below $2,000 Whats Next For ETH? However, SOLs break below this horizontal zone has increased the odds of a 50% price correction to the Q4 2023 levels. Additionally, Martinez recently warned of a potential correction based on Solanas trading pair against Bitcoin, which started to resemble ETH/BTCs chart. The analyst suggested that the SOL/BTC chart was looking like Ethereums trading pair against BTCs past price action, adding that if it continued to follow this pattern, the SOL/BTC chart could see a drop to the 0.0008 region. After the recent price action, the trading pair hit a 15-month low of 0.0014624 on Tuesday. As of this writing, Solana trades at $124, a 14% decline in the weekly timeframe. Featured Image from Unsplash.com, Chart from TradingView.com

XRP Flirts With A Daily Range Breakdown  Price Must Hold Above $2 Level

Author: Sebastian Villafuerte
United Kingdom
Mar 12, 2025 12:05

XRP Flirts With A Daily Range Breakdown Price Must Hold Above $2 Level

XRP has fallen below the $2 mark for the first time since early February, following the broader market breakdown that has pushed most cryptocurrencies lower. Despite the intense selling pressure, XRP has held up stronger than many other altcoins, avoiding the steep declines seen across the market. However, uncertainty remains high, with analysts divided on XRPs next move. Related Reading: Charts Reveal Cardano Holds Key Support Zone Staying Above Could Set The Next Move Some experts believe that if XRP can reclaim key resistance levels, it could trigger a recovery rally, bringing back bullish momentum. On the other hand, bearish analysts warn of further downside, arguing that XRPs failure to hold above support levels could lead to a deeper correction. Top analyst BigCheds shared a technical analysis on X, suggesting that XRP is on the verge of breaking down below the $1.90 mark. If this happens, XRP could see increased selling pressure, leading to a larger drop in price. With price at a pivotal level, traders are watching whether it can stabilize and recover or if further losses are on the horizon. The coming days will be crucial in determining XRPs short-term trend as market volatility remains high. Crypto and Stock Markets Struggle Amid Uncertainty The entire crypto market has been struggling as negative macroeconomic conditions continue to weigh on investor sentiment. U.S. President Trumps policies and global trade war tensions have created an environment of volatility and uncertainty, making it difficult for markets to stabilize. As a result, the U.S. stock market has plunged to its lowest levels since September 2024, adding to the overall risk-off sentiment across all asset classes, including cryptocurrencies. Related Reading: Bitcoin Could Rally Above ATH To $128K On-Chain Indicator Signals Potential Recovery With fear and uncertainty rising, analysts are calling for a continuation of the downtrend across both traditional markets and digital assets. Investors remain hesitant to enter long positions, and many are waiting for clearer signals before making any moves. XRP, despite holding up better than some altcoins, is not immune to the broader market turmoil. BigChed’s technical insights on X warn that XRP is flirting with a range breakdown on the daily chart. According to his analysis, if XRP loses the $2$1.90 support level, it could trigger a significant drop, opening the door for further downside pressure. As XRP hovers near this critical level, traders are closely monitoring whether bulls can defend key support or if the market-wide downturn will push prices even lower. With macroeconomic concerns and heightened volatility dominating the landscape, the coming days will be pivotal in determining XRPs short-term trajectory. XRP Holds $2 Amid Heavy Selling Pressure XRP is currently trading at $2.13 after experiencing massive selling pressure over the past few days. Earlier, the price briefly dropped to $1.89, testing a critical support level before bouncing back above the $2 mark. Despite the short-term recovery, XRP remains under bearish control, and bulls must hold firm above $2 to prevent further downside. For XRP to regain momentum, buyers need to push prices toward key resistance zones around $2.30$2.50. A strong move above these levels could confirm a recovery, helping XRP avoid a larger market-wide sell-off. However, failing to defend the $2 support would put XRP at risk of a deeper correction, with the next major demand zone sitting around $1.60. Related Reading: Ethereum Breaks Out Of Descending Triangle Pattern Fakeout Or Recovery Rally? With volatility increasing across crypto markets, XRPs price action remains uncertain. Bulls must step in soon to reclaim higher levels, or the risk of further losses will continue to grow. The next few trading sessions will be crucial in determining whether XRP can stabilize or if it will extend its decline toward lower price levels. Featured image from Dall-E, chart from TradingView

Solana Breakdown Fails  Holding $205 Is Crucial To Trigger a Push Higher

Author: Sebastian Villafuerte
United Kingdom
Feb 05, 2025 12:05

Solana Breakdown Fails Holding $205 Is Crucial To Trigger a Push Higher

Solana experienced extreme volatility on Sunday and Monday as the market reacted to fears of a U.S. trade war. The uncertainty sent the entire crypto space into a sharp sell-off, with SOL dropping over 25% from its Saturday highs. However, sentiment quickly shifted after reports emerged that President Trump is in negotiations with Mexico and Canada to lift tariffs, sparking a rapid market recovery. Related Reading: Ethereum Long-Term Bullish Structure At Risk $2,700 Support Is Key for a $7K Target Solana has since bounced nearly 25% from its lowest point, reclaiming key levels that suggest bulls are back in control. Top analyst Jelle shared a technical analysis on X, revealing that this was likely a failed breakdown for SOL. If the price holds above key demand zones, another push toward new highs is expected. With volatility at extreme levels, Solana traders remain cautious, but the structure still looks promising for a bullish continuation. The coming days will be crucial in determining whether SOL can sustain its recovery and break into new all-time highs. A confirmed hold above $205 will strengthen the case for further upside, while losing this level could lead to another leg down. The battle between bulls and bears continues, but for now, Solanas resilience is proving strong. Solana Holds Strong Amid Market Volatility Solana has experienced one of the most aggressive daily price moves in recent years, sending shockwaves through the market. After reaching an all-time high in late January, SOL has dropped over 40% in less than two weeks. This rapid decline has sparked fear among investors, with many expecting further losses in the coming weeks. The uncertainty surrounding macroeconomic factors, including U.S. trade war tensions, has only fueled this sentiment. However, not all analysts are convinced that the worst is ahead. Top analyst Jelle shared an analysis on X, revealing that Solana’s price action resembles a failed breakdown rather than a true bearish trend shift. Jelle states that if SOL holds above the $205 mark in the coming days, the market is set for another push toward the highs. This level has proven to be a critical support zone, and a strong defense by bulls could signal a renewed uptrend. Solana has been one of the top-performing assets since 2023, and its ability to recover from deep pullbacks has solidified its position as a market leader. The blockchain’s ecosystem continues to expand, and its high-speed, low-cost transactions make it an attractive option for developers and investors. Related Reading: Bitcoin Price Must Hold Above $97K To Sustain Momentum Metrics Additionally, meme coins and NFT projects built on Solana have fueled strong demand, contributing to its price action outperforming most other altcoins. If SOL reclaims the $220 level and consolidates above it, another leg toward all-time highs would be on the table. A break below $205, however, could signal deeper consolidation or even a correction toward the $180 support zone. Price Action Details: Key Demand To Hold  Solana (SOL) is trading at $208 after failing to reclaim the 4-hour 200 moving average around $221. This level has acted as a key resistance, preventing SOL from regaining bullish momentum in the short term. If bulls want to regain control, they must push the price above this level and hold it as support to confirm a trend reversal. For now, SOL remains in a tight range, with the $200 mark acting as an essential demand zone. If this level holds, a potential recovery could send the price back toward the $221 resistance, where a breakout would signal a continuation toward higher levels. However, if SOL struggles to maintain $200 as support, selling pressure could intensify, leading to a drop toward the $190 level. Related Reading: Bitcoin Trades At Discount For The Past Month Signaling Selling Pressure What This Means Market sentiment remains mixed, with investors watching key levels closely to determine the next move. The broader market trend and Bitcoins performance will also play a crucial role in SOLs short-term direction. A strong bounce from $200 would provide confidence for bulls, while a breakdown could signal further downside. The coming days will be critical for Solana as it battles to reclaim lost ground and avoid deeper corrections. Featured image from Dall-E, chart from TradingView

Solana Retraces TRUMP Meme Pump Gains  But Technicals Suggest A $300 Run

Author: Sebastian Villafuerte
United Kingdom
Feb 04, 2025 12:05

Solana Retraces TRUMP Meme Pump Gains But Technicals Suggest A $300 Run

Solana (SOL) faced a brutal selloff yesterday, mirroring the broader market collapse triggered by escalating U.S. trade war fears. The price plummeted over 19% in less than 24 hours, wiping out weeks of gains and sending shockwaves through the crypto market. Investors are now bracing for more volatility, as the bearish momentum could extend into the week ahead. Related Reading: Bitcoin Price Must Hold Above $97K To Sustain Momentum Metrics Top analyst Jelle shared a price chart on X, highlighting that Solana has completely retraced the TRUMP meme coin pump. The rapid decline saw SOL drop as low as $175, marking one of its steepest single-day corrections in recent months. This level is now a critical zone for bulls, as further weakness could expose Solana to deeper losses. With market sentiment shifting drastically from bullish to fearful in just hours, traders wonder if Solana can recover or if another leg down is imminent. The coming days will be crucial as SOL attempts to stabilize and reclaim key support levels to prevent further downside. Solana FacesSelling Pressure But Remains Strong After yesterdays brutal market selloff, Solana (SOL) has become a focal point for investors seeking strong plays amid the chaos. The entire crypto market plummeted as U.S. trade war fears triggered widespread panic selling.  Solana was no exception, dropping over 19% in less than 24 hours. However, despite the negative environment and extreme volatility, long-term price action remains intact, suggesting that Solana could recover faster than most assets once the market stabilizes. Top analyst Jelle shared a technical analysis on X, revealing that Solana has completely retraced the TRUMP meme coin pump, falling as low as $175 before finding support. Jelle remains optimistic about Solanas future, stating that its structure is still sound. He highlights that a close above M&W support would confirm another push higher, setting the stage for a strong recovery. According to his analysis, its only a matter of time before SOL revisits the $300 level, as long as it holds key structural levels. Related Reading: Bitcoin Trades At Discount For The Past Month Signaling Selling Pressure What This Means With the entire market facing heightened volatility due to macroeconomic uncertainty, this week will be crucial for Solanas next move. If SOL can reclaim major support levels and break through immediate resistance, a strong recovery could be on the horizon. However, if selling pressure persists, the market could see further downside before a new accumulation phase begins. SOL Holding Above Key Levels Solana is trading at $199 after a small recovery from the $175 low, surging over 13% in the past few hours. Despite the recent bounce, market sentiment remains fearful, and selling pressure could persist throughout the week. Bulls must reclaim key levels quickly to regain momentum and prevent further downside. If SOL wants to confirm a bullish reversal, it must push above the $220 mark in the coming days. This level acted as strong support before the recent breakdown, and flipping it back into support would signal strength. However, given the current market uncertainty, a recovery may take time, and SOL could see more choppy price action before making its next move. The key level to watch on the downside is $189, where the 200-day exponential moving average (EMA) currently sits. If SOL loses this level, a deeper correction could follow, potentially leading to a retest of lower support zones. Bulls need to hold this mark to prevent a more extended decline. Related Reading: Chainlink Could Target $30 Once It Breaks Bullish Pattern Top Analyst For now, all eyes are on SOLs ability to reclaim critical resistance levels. If the price stabilizes and demand picks up, Solana could be primed for a strong rebound. However, further weakness could extend the correction phase. Featured image from Dall-E, chart from TradingView

Ethereum Long-Term Bullish Structure At Risk  $2,700 Support Is Key for a $7K Target

Author: Sebastian Villafuerte
United Kingdom
Feb 04, 2025 12:05

Ethereum Long-Term Bullish Structure At Risk $2,700 Support Is Key for a $7K Target

Ethereum faced a brutal capitulation event on Sunday, plummeting over 30% in less than 24 hours as market-wide panic took hold. The dramatic sell-off was fueled by growing fears of a U.S. trade war, sending shockwaves across the crypto space and causing Bitcoin and major altcoins to drop significantly. ETH, which had been struggling to reclaim key levels, saw a sharp decline, shaking investor confidence and raising concerns about its long-term trend. Related Reading: Bitcoin Trades At Discount For The Past Month Signaling Selling Pressure What This Means Top analyst Ali Martinez shared a technical analysis, revealing that Ethereum is forming a long-term head-and-shoulders pattern. According to Martinez, ETH must hold above the crucial $2,700 level to maintain its bullish structure and prevent a deeper correction. A breakdown below this level could trigger an extended bearish phase, further delaying ETHs potential rally toward new highs. With volatility at extreme levels and uncertainty dominating the market, Ethereums next move will be critical. If bulls manage to defend key support, ETH could stage a strong recovery, but failure to hold could lead to even more downside. As investors assess the damage from this weekends crash, all eyes remain on whether ETH can stabilize and reclaim momentum in the coming days. Ethereum Faces A Key Challenge Yesterday, the crypto market witnessed the largest liquidation event in its history, with over $2 billion wiped out in just a few hours. Fear has taken over, and investors are bracing for extreme volatility this week as the U.S. market reacts to escalating trade war tensions. With uncertainty dominating the landscape, Ethereum has been one of the most impacted assets, shedding a significant portion of its value as panic selling intensified. Ethereums price plummeted over 37% since last Friday, marking one of its sharpest declines in recent years. The dramatic downturn has led analysts to question whether ETH can maintain its long-term bullish structure or if a deeper correction is imminent.  Top crypto expert Ali Martinez shared a technical analysis on X, revealing that Ethereum appears to be forming a long-term head-and-shoulders pattern. If this pattern is confirmed, ETH must hold above the critical $2,700 mark to keep its bullish structure intact. Losing this level could trigger a deeper selloff, potentially pushing prices toward lower demand zones before any recovery takes place. However, if bulls successfully defend this crucial support, Ethereum could still have a shot at reclaiming lost ground and targeting its long-term goal of $7,000. The coming days will be pivotal in determining ETHs trajectory as traders assess whether this is a temporary shakeout or the beginning of a prolonged downtrend. Related Reading: Solana Will Drop To $211 If It Fails To Break Key Resistance Level Analyst As macroeconomic fears and trade war tensions continue to influence market conditions, Ethereums price action will be a key indicator of broader investor sentiment. This week will likely set the tone for ETHs movement in the coming months, making it a defining moment for the second-largest cryptocurrency. Price Action Details: Key Levels To Watch Ethereum (ETH) is currently trading at $2,595 after an extremely volatile Sunday that saw its price plummet to as low as $2,150. The drastic drop has left bulls in a precarious position, as ETH has lost all major support levels and is now searching for demand to stabilize. With the market shaken and fear-dominant sentiment, ETH must hold above the $2,600 mark in the coming days to have a chance at recovery. However, after such a massive liquidation event, regaining bullish momentum may take time, and the likelihood of further downside remains high. Traders and investors are watching key levels closely as Ethereum struggles to find its footing. Related Reading: Bitcoin Price Must Hold Above $97K To Sustain Momentum Metrics If ETH manages to reclaim the $2,800 level and push above $3,000, confidence could return to the market, signaling the first steps of a recovery. Until then, uncertainty remains the dominant force, and the potential for another leg down cannot be ruled out. The next few days will be crucial in determining whether Ethereum can bounce back or if it will continue its decline toward lower support levels. Featured image from Dall-E, chart from TradingView

Dogecoin Open Interest Declines 67% In Three Months  Can Meme Coins Recover?

Author: Sebastian Villafuerte
United Kingdom
Feb 28, 2025 12:05

Dogecoin Open Interest Declines 67% In Three Months Can Meme Coins Recover?

Dogecoin is trading at key demand levels after two weeks of massive selling pressure, with bears pushing DOGE down more than 30%. The meme coin sector has been hit the hardest during this market-wide correction, which began in mid-January, and as the market leader, Dogecoin has suffered the most. Related Reading: Solana Transfer Volume Crashes To $14.5M Whats Next for SOL? Investors have started to question the sustainability of the meme coin rally, especially as sentiment continues to weaken across the board. Glassnode metrics confirm this downward trend, revealing that Dogecoins open interest has dropped by 67% over the past three months. With DOGE now at a critical level, traders are watching whether bulls can step in to hold support and push prices higher. If buying pressure returns, Dogecoin could start a strong recovery rally, but if the trend continues, further liquidations and losses could follow. The next few days will be crucial as investors assess whether DOGE can recover or extend its decline in this volatile market. Dogecoin Faces Selling Pressure After this week’s market breakdown, Dogecoin has struggled to reclaim key price levels and still faces a serious risk of further declines. The meme coin sector has been one of the hardest-hit areas in the crypto space, with analysts blaming speculative meme coin trading as a key factor behind the broader crypto correction. As sentiment weakens, DOGE and other meme coins continue to lose ground, unable to recover from massive sell-offs. Top analyst Ali Martinez shared Glassnode data on X revealing that Dogecoins open interest has declined by 67% over the past three months. Open interest fell from an all-time high of $4.07 billion to just $1.33 billion today, highlighting that traders have lost interest in DOGE and that speculation has dried up. This data confirms the negative environment surrounding meme coins, and as the market leader, Dogecoin is setting the tone for the entire meme sector, which continues to struggle. For DOGE to regain momentum, bulls must step in and defend key demand levels. A break below current support could lead to even more selling pressure, while a reclaim of higher resistance levels could signal a potential recovery rally. With open interest and volume declining, Dogecoin remains in a critical position, and the next few weeks will determine whether bulls can take back control or if the downtrend will continue. Related Reading: XRP Breaks Down Below Key Demand Analyst Expects A Drop To $1.65 DOGE Dogecoin (DOGE) is currently trading at $0.21 after weeks of underwhelming price action. Bears remain in control, and momentum continues to push the price into lower levels, making it difficult for bulls to reclaim strength. DOGE has been in a steady downtrend, struggling to gain traction as meme coins face increasing selling pressure across the market. If bulls want to regain control, DOGE must push above the $0.24 level and hold it as support. Reclaiming this level would signal short-term strength and could trigger a relief rally toward higher resistance zones. However, with market sentiment still bearish, a breakout seems unlikely unless overall conditions improve. On the downside, if DOGE fails to hold current levels, a drop toward $0.15 could be expected. This level represents a significant psychological and technical support, but losing it would put DOGE in uncharted territory for this cycle. With open interest declining and liquidity drying up, bulls need to step in soon, or the downtrend could accelerate. Related Reading: Solana Loses Long-Term Support Level Analyst Shares Insights The next few days will be crucial as DOGE attempts to stabilize or continues to bleed out. If market conditions remain weak, further downside pressure could push DOGE into even lower demand zones.

Your Crypto Gateway

Claim 1,000
Free WCG Coins

World Crypto Global opens the door to digital freedom for everyone.
Manage your free WCG Coins securely—where simplicity meets global accessibility.

11 bn

FREE CRYPTO COINS

8.9 bn

AVAILABLE FOR RESERVATION

2.1 bn+

ALREADY ALLOCATED

× WCG Coin

🎉 Get 1,000 WCG Coins

No fees. No catch. Your crypto journey starts here.