Bitcoins bull rally will continue another 350 days: Bybit
Bitcoin's 2024 bull run was mainly driven by institutional inflows, which could be the key to unlocking the next leg up.
Loading
Welcome at World Crypto Global. This portal is packed with useful content and resources to built out your own crypto skills. WorldCrypto is a site member of Gabriel Vega Network.

Bitcoin's 2024 bull run was mainly driven by institutional inflows, which could be the key to unlocking the next leg up.
The price of Bitcoin has shown no significant movement in the last day rising by only 0.78% according to data from CoinMarketCap. Following a widescale crash in the global financial markets, the crypto market leader pulled off a strong recovery in the past week, gaining by 16% to reach a peak of $62,000. As Bitcoin [...]
The post Bitcoin To Rally To $250,000 If This Condition Is Met, Analyst Says appeared first on Crypto Breaking News.
The CEO and founder of the on-chain analytics firm CryptoQuant has explained how this Bitcoin bull cycle could probably last till mid-2025. Profit-Taking From Old Bitcoin Whales Lasted For 18 Months In Previous Cycles In a new post on X, CryptoQuant founder and CEO Ki Young Ju has discussed about a pattern that old whales have followed in terms of profit-taking during the past cycles. “Old whales take profits during bull markets,” notes Young Ju. “Their selling brings new capital into accumulation addresses, raising realized prices.” Accumulation Addresses refer to the Bitcoin wallets that have no history of selling. These addresses also have a few other conditions, such as they must have at least two deposits and shouldn’t be connected to miners or centralized exchanges. They should also carry a balance of at least 10 BTC, and their last transaction should have been within the past seven years. Related Reading: Shiba Inu, XRP Forming Bullish Divergence, Analytics Firm Reveals The Accumulation Addresses basically reflect the perennial HODLers of the market, who only buy more and never sell. During bull markets, as old whales break their silence to harvest their profits, demand from these HODLers absorbs the selling. To display this trend, the CryptoQuant CEO has made use of the “Realized Price” metric, which keeps track of the cost basis of the average investor belonging to this cohort. When the value of this indicator is above the spot price of the cryptocurrency, it means the cohort as a whole is in a state of unrealized loss right now. On the other hand, it being under BTC’s value implies these diamond hands are currently carrying profits. Now, here is a chart that shows the trend in the Realized Price for the Bitcoin Accumulation Addresses over the past decade: As shown in the above graph, the Realized Price for this cohort observed a rise during the last two Bitcoin bull runs. This would suggest that these HODLers were buying as prices were going up, thus raising their average cost basis. This accumulation likely corresponded to profit-taking from other entities in the market. As Young Ju has pointed out, this profit-taking spree lasted for about 18 months in these past cycles. Related Reading: Bitcoin Crashes To $64,000: Will This Historical Support Hold? From the chart, it’s visible that the indicator has once again started showing an uptrend with the price rally this year. This would suggest that the Accumulation Addresses are back to absorbing profit-taking from old whales. So far, this rise has lasted for around four months, which means that there could still be around another fourteen months of it left, if the last two cycles are anything to go by. Based on this, the analyst thinks this latest Bitcoin bull cycle could end up running into mid-2025. BTC Price Bitcoin has edged close to the $70,000 level during the past day after observing a surge of around 3%. Featured image from Dall-E, CryptoQuant.com, chart from TradingView.com
Bitcoins decisive move above $65,000 and miners' return to deep profitability could lead to BTC hitting $220,000.
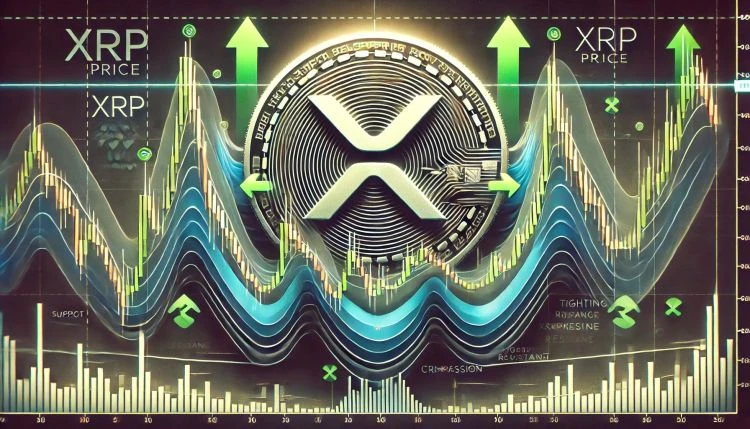
XRP is trading at a pivotal level as the broader crypto market regains strength and bullish sentiment returns. While macro uncertainty and volatility persist, XRP has remained resilient, holding firmly above key demand zones. The asset is now attempting to reclaim higher supply levels, with bulls pushing for a breakout that could define its next major move. Related Reading: Ethereum Consolidates As Accumulation Trend Develops New Bullish Phase Ahead? Top analyst Ali Martinez recently shared a technical view showing that XRP is currently trading within a very tight range. This period of consolidation has compressed volatility, setting the stage for a potential explosive move. According to Martinez, a decisive daily close outside this range could determine the direction of the next major trendeither a breakout toward previous highs or a drop toward lower support levels. For now, XRP appears to be leaning bullish as it tracks the momentum seen across other major cryptocurrencies. Traders are watching closely to see if XRP can reclaim the $0.70$0.75 range, which could open the door to a broader rally. Until then, the current structure suggests that XRP is coiling for a breakout, and the next few sessions could be decisive in confirming the trend ahead. XRP Trades Above $2 As Market Awaits Breakout Or Breakdown XRP is trading above the $2 mark, holding strong amid rising volatility and uncertainty across the crypto market. While bulls are showing signs of strength, they continue to struggle with the $2.35 resistance levela barrier that has capped recent upward momentum. At the same time, bears have been unable to push the price below current support levels, keeping XRP locked in a tight consolidation range. The broader market is heating up, with Bitcoin testing key resistance near all-time highs, creating an environment where altcoins like XRP could soon follow with significant moves. Analysts are closely watching this setup, with many calling for a bullish expansion phase if XRP can break through overhead resistance and confirm strength. Martinez has identified two critical levels that will likely define XRPs short-term trend: $2 and $2.26. According to Martinez, a decisive daily close outside this range could set the tone for the next major trend moveeither a breakout toward new highs or a breakdown into deeper consolidation. However, market risks remain. Ongoing geopolitical tensions between the US and China continue to influence risk sentiment, and traders remain cautious as these macro factors develop. Still, XRPs price structure shows strength, and if bulls can overcome $2.35, the asset could gain serious momentum. For now, all eyes are on XRP as it coils near key levels. The next few days will be crucial in determining whether this consolidation resolves to the upside or signals another round of range-bound price action. Either way, a major move appears to be on the horizon. Related Reading: Cardano Struggles At Resistance Expert Sees A Retest of Lower Support Levels Price Analysis: Technical Details XRP is currently trading at $2.14 after bouncing off recent lows near the $2.05 level. The 4-hour chart shows the price holding just above the 200-period simple moving average (SMA) at $2.11 and slightly below the 200-period exponential moving average (EMA) at $2.17. This positioning highlights a key zone of indecision, with bulls and bears locked in a tug-of-war around a major support and resistance confluence. The price structure remains neutral but constructive. After a failed attempt to push above the $2.30$2.35 resistance range in late April, XRP has entered a phase of consolidation. Despite the pullback, bulls have defended the $2 psychological level multiple times, indicating strong demand in that area. Volume has remained steady, and XRP appears to be forming a higher low, which could serve as a launchpad for another attempt at the range highs. A breakout above the $2.26$2.35 zone would likely confirm bullish continuation and open the path toward $2.50 and beyond. Related Reading: Ethereum Breaks Massive Downtrend Price Structure Momentum Shift? However, a breakdown below $2.05 could invalidate the current setup and expose XRP to further downside. For now, XRP remains at a pivotal level, and the next 48 hours will be critical in determining its short-term direction. Featured image from Dall-E, chart from TradingView
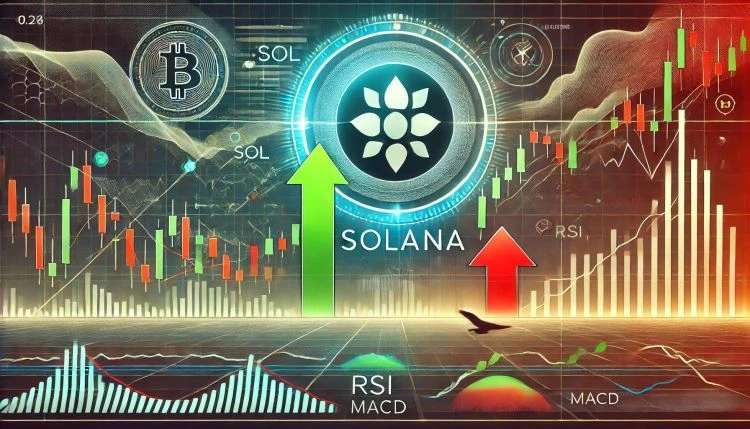
Solana is trading at a critical level as the broader crypto market consolidates below key resistance zones. After an impressive 90% surge since early April, SOL has experienced a modest pullback, sparking speculation that this may be the final dip before a significant move higher. While many assets are struggling to maintain momentum, Solana has shown remarkable strength and resilience, bolstering bullish expectations. Related Reading: Dogecoin Momentum Fades Analyst Expects $0.213 Retest Top analyst Cas Abbe shared a technical view suggesting that the long-term bullish structure for Solana remains firmly intact. According to Abbe, last months retest of the multi-year trendline marked a pivotal moment for the asset, reinforcing support and resetting sentiment for a potential continuation. Since the bounce from that level, SOL has continued to climb steadily, and many now believe that Solana is gearing up for another leg up. With fundamentals improving and historical patterns pointing to renewed upside, the market is watching closely. A successful reclaim of nearby resistance levels could be the trigger that drives Solana back toward its previous all-time highand potentially beyond. For now, SOL holders are eyeing this consolidation phase as the calm before the storm. Solana Holds Critical Support As Market Eyes Bullish Continuation Solana is testing a crucial demand zone around the $165 level, attempting to establish a foundation for its next major move. This range has become a key battleground between bulls and bears, especially as broader market sentiment is shaped by Bitcoins struggle to push past its all-time high. With BTC stalling just below $109K, uncertainty clouds the outlook for many altcoins, including SOL. However, Solana continues to show signs of relative strength. Despite recent pullbacks, the overall trend for Solana remains bullish. According to Abbe, the assets multi-year uptrend remains intact. Last month, Solana successfully retested its long-term trendline, which Abbe believes marked the bottom of the recent correction. Since that bounce, SOL has surged over 50%, demonstrating strong investor confidence and solid underlying momentum. Abbe maintains that the $290 high seen earlier was not the final peak for Solana, projecting a new all-time high sometime in 2025. His bullish thesis is supported by improving fundamentals across the Solana ecosystem, including rising developer activity, growing DeFi participation, and increasing on-chain usage. Related Reading: Range-Bound Ethereum Sees Volatility High Timeframe Levels Hold The Key SOL Price Analysis: Holding The Line Before A Big Move Solana (SOL) is currently trading at $167.76 after a sharp rally in early May that pushed the price above both the 200-day EMA and 200-day SMA. The chart shows SOL climbing over 90% since its April low, confirming bullish momentum and renewed interest across the market. However, the price is now stalling just below the 200-day SMA at $181.03, which is acting as dynamic resistance. The key support lies near the 200-day EMA at $162.55. As long as SOL holds this level, the short-term structure remains bullish. A clean break above the $181 level would open the door for a move toward the psychological $200 mark and potentially higher. But if bears regain control and price breaks below $160, the uptrend could be in jeopardy. Related Reading: Chainlink Struggles At Key Resistance Level $10 Support Back In Focus Volume has decreased slightly since the early May breakout, hinting at possible exhaustion or consolidation before another leg. Traders are closely watching for confirmation either a breakout above $181 or a breakdown below the EMA. Featured image from Dall-E, chart from TradingView
This crypto cycle achieved some remarkable feats during Q1 2024, including the highest monthly and quarterly close in Bitcoin (BTC) history. However, BTC suffered a retrace that dragged Ethereum (ETH) and the rest of the crypto market down as the year’s second quarter started. Now that we are one month into Q2, the market faces another correction. The most recent retrace became the deepest of the cycle, with Bitcoin nosediving into the $57,000 support zone and Ethereum falling below $3,000. Despite the markets stumble, analysts remain optimistic for whats to come. Related Reading: Is This Cycles Bitcoin Bottom In? Analysts Forecast BTC Bounce Back What Makes This Cycle Different? Traders and analysts have urged investors not to panic about the retraces yet. A broader look shows that the market is above levels not seen since the last bull run. As many have discussed, theres a significant resemblance between this cycles performance and previous ones. However, analysts have also pointed out the singularities of this bull run. Compared to the 2020 cycle, altcoins didnt even run that hard over the last few months, as renowned analyst Altcoin Sherpa highlighted. After Wednesdays correction, trader and economist Alex Krüger weighed in on this cycles performance. Krüger concurs with some of Sherpas points, considering that the markets too many options have made the playfield more convoluted. Some thoughts on the current crypto cycle #1 The crypto cycle has been almost entirely driven by the bitcoin ETF. #2 ETH has been a major disappointment, but it has performed well overall for stakers and airdrop farmers. #3 Solana established itself as the chain of choice for — Alex Krüger (@krugermacro) May 1, 2024 Similarly, he also has noticed the desire to focus on making a quick buck and investing in short-term hype rather than on longevity. The trader highlighted that the Bitcoin exchange-traded funds (ETFs) have almost entirely driven this cycle. Besides BTC, memecoins have been the dominating narrative of the bull run, ranking among the top gainers of Q1 2024. Moreover, Krüger asserted that most market participants who missed the Bitcoin ETF run went all in on altcoins to compensate. As a result: They deployed late and poorly, going in larger at higher levels, and are now seething and at a loss, as too many altcoins have given up their entire 2024 gains in the last month. Ethereum Disappointing Run One of the crucial points of Krügers analysis is Ethereums overall unsatisfactory performance. To the crypto veteran, the second-largest cryptocurrency by market capitalization has been a major disappointment even though it has performed well for stakers and farmers. Despite seeing massive gains alongside Bitcoins run, Ethereum has not been able to challenge its all-time high (ATH) price set over two years ago. Furthermore, Solana overtook Ethereum after establishing itself as the chain of choice for retail traders. Its worth noting that the turmoil surrounding Ether and the Ethereum Network has seemingly affected the tokens recent performance. The king of altcoins is currently facing severe regulatory scrutiny. The suspicion of a spot Ether ETF rejection from the US Securities and Exchange Commission (SEC), alongside the news of the agencys investigation on the assets classification as an unregistered security, seems to have created uncertainty around ETH. Ethereum’s current landscape has reignited deeming conversations against its founders and the asset, possibly fueling the doubtful sentiment surrounding a sector of the crypto community. Despite the challenging landscape, many analysts consider that investors should not be bearish on Ethereum. After falling 4.5% and 14.39% in the weekly and monthly timeframes, ETH has recovered 3.3% of its price in the past 24 hours. Ultimately, Krügers consideration concludes that the cycle is not over. However, he points out that investors need to move out of the panic area and reignite the majors before finding a new narrative for this run. Related Reading: Ethereum Price Revisits Key Support, Can Bears Take Over? Ether is trading at $2,999.80 in the three-day chart. Source: ETHUSDT on TradingView Featured Image from Unsplash.com, Chart from TradingView.com
Bitcoin is facing growing risks of a pullback as bullish momentum begins to fade near key resistance. After weeks of impressive gains, BTC is now consolidating in a tight range just below its all-time high, with buyers struggling to push the price into price discovery. This ongoing indecision has raised concerns among traders and analysts, who are closely watching for signs of either a breakout or a deeper retracement. Related Reading: Ethereum Multi-Year Consolidation Could Spark A Parabolic Move Details Crypto analyst Daan offered a broader perspective on the situation, noting that Bitcoin initially surged in response to the recent tariff-related tensions, significantly outperforming equities in the process. However, as trade uncertainty began to ease and traditional markets regained momentum, Bitcoin lost steam and failed to follow through. While stocks continued their uptrend, BTC stalledan unusual divergence that suggests caution may be creeping back into the crypto space. With the price now hovering around the $103K mark and key resistance near $105K remaining untouched, bulls must act decisively to reclaim control. A failure to do so could trigger a larger correction, especially if macro conditions shift or equity markets show renewed weakness. For now, all eyes are on the range and which side breaks first. Bitcoin Bulls Eye Breakout But Caution Grows Near Resistance Bitcoin is just 5% away from its all-time high of around $109,000, trading near $103K as bulls attempt to reclaim momentum. After weeks of strong upward movement and consolidation above key levels, many analysts believe BTC is preparing for a decisive breakout. If price can clear the $105K resistance, it could trigger a new leg into price discovery and signal the start of a powerful bull phase. However, selling pressure at current levels remains strong. Bitcoin has struggled to break higher, and some traders see this consolidation as a sign of potential exhaustion. Daan offered insights on the recent behavior, noting that BTC surged sharply following the tariff-related macro drama, outperforming equities in the process. Yet, as some trade uncertainty faded, stocks kept climbing while BTC stalled near resistance. Daan considers $90K his line in the sand for long-term spot exposure. If Bitcoin were to drop below that mark, it would suggest a structural breakdown that hasnt occurred during this cycle. For now, he remains cautiously bullish while BTC stays above that level, but admits the risk-reward was more attractive when BTC was 2030% cheaper. He also warns that if equities correct after their aggressive ralliesmany stocks have surged 3050% in a single monthit could drag Bitcoin lower in a short-term flush. With BTC showing relative weakness near resistance, the next move will be critical for confirming either continued upside or the start of a broader pullback. Related Reading: Dogecoin Whales Accumulate 1 Billion DOGE In A Month: Fueling Price Surge Speculation Tight 4H Range Signals Imminent Price Breakout The 4-hour chart shows Bitcoin consolidating tightly between $105,700 resistance and $100,700 support, creating a narrow range that suggests a strong move is imminent. Price has been ranging sideways for several days, with multiple failed breakout attempts above $103,600. This level continues to act as a key barrier for bulls. Notably, Bitcoin remains above both the 200 EMA ($96,121) and the 200 SMA ($94,622), reinforcing the medium-term bullish structure. Momentum is neutral in the short term, as shown by the indecisive price action and declining volume. However, the trend remains intact as long as BTC holds above $100,000 the psychological and technical line in the sand. If price breaks above $103,600 with volume, it could trigger a move toward the $105,000$109,000 range and initiate a push into price discovery. On the other hand, failure to hold this support zone could open the door for a quick flush to retest the $98,000$96,000 area, where the moving averages align. Related Reading: Solana Sees Renewed Demand As Capital Flows Turn Positive Details Traders should watch for a clear breakout or breakdown, especially as moving averages and prior highs converge. This tight setup rarely lasts long, and a decisive move could define Bitcoins trend for the rest of the month. Featured image from Dall-E, chart from TradingView
Bitcoin has flipped its old resistance into support as USDTs market cap continues to grow rapidly in 2024.
The growth of the money supply is historically correlated with previous Bitcoin price bull runs.
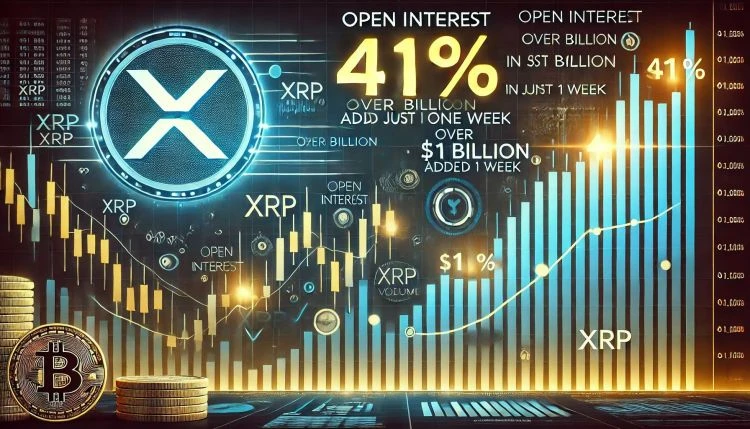
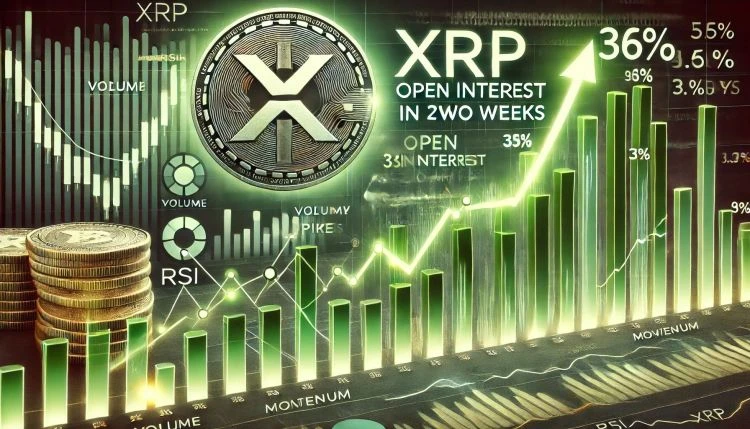
XRP has gained significant momentum over the past several days, posting a sharp 24% rally since last week as bullish sentiment returns to the broader crypto market. With Bitcoin holding above $100K and Ethereum reclaiming the $2,200 mark, altcoins like XRP are beginning to show strength after months of subdued performance. Analysts are now calling for a potential breakout, emphasizing the importance of XRP reclaiming key resistance levels in the coming days to confirm a sustained move higher. Related Reading: Ethereum Recovery Gains Strength: Massive Comeback Above Key Support Fueling this optimism is new data from Glassnode revealing a dramatic surge in XRP Futures Open Interest. The metric has climbed over $1 billion in just one week, rising from $2.42 billion to $3.42 billiona 41.6% increase. This spike suggests a growing wave of speculative interest and directional conviction among traders. As leverage builds, all eyes are on XRPs next move to determine whether this momentum can evolve into a full-blown rally. The rise in open interest alongside price appreciation often points to sustained bullish intent, adding weight to calls for a continued surge. With volatility returning to the altcoin market, XRP could be gearing up for one of its most critical breakouts in months. XRP Leads With Strong Momentum And Rising Leverage XRP is emerging as one of the strongest performers in the market, displaying remarkable resilience during recent downtrends and now showing clear strength in the current bullish environment. After consolidating through volatile conditions, XRP has surged above the $2.50 level, firmly positioning itself as a leader among large-cap altcoins. The price action remains tight, with bulls continuing to test the $2.60 zone while bears are unable to push the price below the new support levels formed near $2.35. This price compression, combined with broader market optimism, suggests that XRP may be gearing up for a major move. With Bitcoin consolidating near its all-time highs and Ethereum testing crucial resistance zones, analysts are paying close attention to XRPs trajectory. The altcoin market is heating up, and XRPs technical structure hints at a bullish expansion phase if current levels are maintained or reclaimed with volume. Supporting this bullish outlook is recent data from Glassnode, showing that XRP Futures Open Interest has soared by over $1 billion in the past week. It jumped from $2.42 billion to $3.42 billiona 41.6% increasecoinciding with a price rally from $2.14 to $2.48. This surge in leverage underscores growing speculative interest and strong directional conviction among traders. Elevated open interest, particularly when paired with upward price movement, often signals sustained momentum and institutional participation. With XRP firmly above key support and showing signs of renewed investor confidence, the next few sessions could be pivotal for determining whether XRP will finally break out into a new macro trend. Related Reading: Ethereum Hits Major Level After Biggest Weekly Candle In Years What Comes Next? Price Action Signals Strength Amid Market Momentum XRP is showing strong bullish momentum as it continues to trend higher, currently trading around $2.55. The chart reveals a well-established uptrend, with XRP recently breaking above key resistance levels and holding above both the 200-day Simple Moving Average (SMA) and Exponential Moving Average (EMA), currently at $2.13 and $2.02, respectively. This alignment of moving averages below the current price reinforces the bullish structure. Over the past two weeks, XRP has surged more than 24%, confirming higher lows and higher highs in the process. After briefly stalling at $2.60, the price is now consolidating with low volatility just below that levelindicating potential for another breakout if buying pressure resumes. Volume also picked up significantly during the initial leg of this move, signaling strong interest from market participants. Related Reading: Solana Rallies Into Pivotal Zone $180 Level Could Define Next Move The next resistance level to watch is near $2.80, which marked a major rejection zone earlier in the year. On the downside, the $2.35 zone has now turned into strong support and would be a critical level for bulls to defend if momentum weakens. Featured image from Dall-E, chart from TradingView
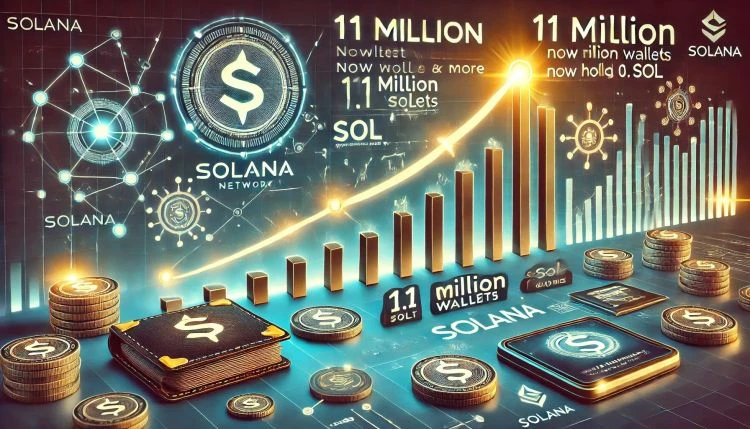
Solana has rallied more than 22% since last Thursday, riding the wave of renewed bullish momentum across the broader crypto market. As Bitcoin pushes toward all-time highs and Ethereum breaks key resistance levels, Solana has followed suit with impressive strength. The price surged to a local high of $181 before encountering resistance, where it now consolidates just below that mark, searching for support to fuel the next leg higher. Related Reading: Ethereum Hits Major Level After Biggest Weekly Candle In Years What Comes Next? While price action cools at a pivotal level, on-chain data shows significant growth in Solanas user base. According to Glassnode, the number of wallets holding 0.1 SOL or more has surged to 11.04 million in the past two weeks. This rapid increase in smallholder wallets points to a rising wave of adoption and network participation, particularly as interest in altcoins intensifies. Solanas consolidation just under $181 may act as a healthy pause before a continuation if bullish momentum persists. With the market heating up and retail interest returning, the current price structure could offer the foundation for a strong breakout in the coming sessions. The combination of price performance and rising user engagement suggests Solana may be positioning for a larger role in the next phase of the bull cycle. Solana Holds Key Support As Wallet Growth Signals Optimism Solana is now facing a crucial test as it consolidates just below the $181 resistance zone. After a sharp 22% rally over the past week, bulls must defend current levels to validate the uptrend and sustain momentum. Holding above the $170$175 support range would confirm strength and could pave the way for a renewed push toward the $200 level. However, the path forward isnt without risk. The broader macroeconomic environment remains fragile, with persistent fears of a global slowdown and continued uncertainty around inflation and interest rate policy. Despite these headwinds, the crypto market is staging a powerful recovery, and Solana is among the top performers. This rally may be more than just a short-term bounceit could mark the early stages of a larger bullish phase with significant upside potential. Investor sentiment is improving, and so is user engagement across key ecosystems. Top analyst Ali Martinez shared compelling on-chain data that reinforces this perspective. According to Glassnode, the number of wallets holding 0.1 SOL or more has surged to 11.04 million over the last two weeks. This rapid growth in smaller holders suggests growing retail interest and a widening user basecritical indicators for long-term strength. If bulls can maintain control at current levels and macro conditions dont worsen, Solana could be poised for a major move. The combination of technical momentum and on-chain engagement provides a strong foundation for the next leg higher. All eyes are now on whether the $181 resistance breaksor if Solana needs more time to build strength before the next phase of the rally begins. Related Reading: Ethereum Recovery Gains Strength: Massive Comeback Above Key Support Solana Faces Resistance As Price Pulls Back To Retest Support Solana (SOL) is consolidating just below the $181 level after a strong 22% rally from last week. As shown in the chart, price action surged above both the 200-day EMA ($161.88) and 200-day SMA ($181.11), signaling renewed bullish momentum. However, the current pullback from $180 to around $173.48 shows that the $181 level is acting as a key resistance, which has previously served as a rejection zone multiple times in the past. Volume remains healthy, and the recent move shows strong market participation, but bulls now need to hold the $170$172 range to maintain control. A successful retest of this area as support could set the stage for a breakout above $181. Failing to hold above this zone, however, could trigger a correction back to the $160$165 region, near the 200 EMA. Related Reading: HYPE Bulls Regain Control After Sharp Recovery Approaching Yearly Highs? Technically, SOL is attempting to break a multi-month downtrend and is forming a higher high structure for the first time since late December. The convergence of the moving averages suggests a pivotal moment. If buyers step in with conviction, a move toward $200 becomes likely. Until then, traders will closely watch the $181 level for a decisive breakout or rejection. Featured image from Dall-E, chart from TradingView
Bitcoin is trading confidently above the $100,000 mark, having recently marked a local high near $104,300. After months of choppy action and uncertainty, bulls are now firmly in control, reigniting momentum across the broader crypto market. As BTC retests key supply levels last seen near the previous all-time high, optimism is building that this breakout could be the beginning of a sustained move higher. Related Reading: Bitcoin Whale Entry Prices Diverge Sharply Confidence Builds At Higher Levels The entire market appears to be waking up, with altcoins following Bitcoins lead and liquidity flowing back into risk assets. Traders are watching closely to see if BTC can maintain this strength and convert $100K into solid support. Top analyst Big Cheds shared a technical update highlighting the current 4-hour chart structure, noting that BTC is exhibiting a bullish consolidation. This pattern typically signals continuation, as price compresses just below resistance before attempting a breakout. With no signs of exhaustion yet, the setup suggests that Bitcoin may have more room to run, especially if bulls can maintain momentum through the weekend. Bitcoin Tests Key Resistance Amid Bullish Momentum Bitcoin has surged with strength over the past few days, breaking through multiple resistance levels and reclaiming the $100K mark with conviction. Now trading near $104,000, BTC is facing a critical resistance zone that could determine whether the rally continues toward new all-time highsor pauses for consolidation. This level coincides with the upper boundary of a previous supply zone and has become a focal point for both bulls and bears. While price action remains clearly bullish, macroeconomic conditions still pose risks. Persistent global uncertainty, concerns about inflation, and tight monetary policies from central banks could weigh on risk assets in the short term. If sentiment shifts or external shocks hit the market, Bitcoin may experience a pullback despite the strong structure it’s built recently. Cheds offered insights into Bitcoins current setup, highlighting that the 4-hour chart is showing a high and tight bullish consolidationa classic continuation pattern. According to Cheds, this formation reflects strength, as BTC consolidates at elevated levels rather than pulling back, suggesting that buyers remain in control and are absorbing any sell pressure. If Bitcoin can push above the $104K mark with volume, the next logical target would be a retest of the previous all-time high around $109K. However, traders should remain cautious. Despite the bullish technical setup, short-term volatility and external market risks could lead to sudden reversals. For now, Bitcoin holds a bullish bias, and as long as it continues consolidating above $100K, the case for a continuation higher remains intact. The next few sessions will be crucial in determining whether BTC has the strength to break out or needs more time to build. Related Reading: Ethereum Breaks Key Resistance In One Massive Move Higher High Confirms Momentum Price Analysis: Forming A Bullish Structure Bitcoin is currently trading just above $103,000, consolidating after tagging the $104,300 level earlier in the day. The price action confirms that bulls are firmly in control, having reclaimed the $100K level with strength and cleared multiple layers of resistance. However, the chart shows that BTC is now testing a major supply zone between $103K and $103.6K a level that previously acted as resistance in January and February. Volume has spiked in recent days, signaling strong demand behind this breakout. Still, the latest candle shows a long upper wick, hinting at some short-term selling pressure as BTC faces overhead resistance. If bulls manage to push above $103.6K with sustained volume, a breakout toward the $109K all-time high could follow. Related Reading: Cardano Approaches Critical Resistance Break Above Could Trigger Move To $0.80 On the downside, the $100K level now acts as immediate support. Below that, the $95K and $90K zones previously consolidation areas could offer additional structural backing. The daily 200-day simple moving average (SMA) at $91,227 and the 200-day exponential moving average (EMA) at $87,004 remain well below the current price, reinforcing the strong bullish trend. Featured image from Dall-E, chart from TradingView
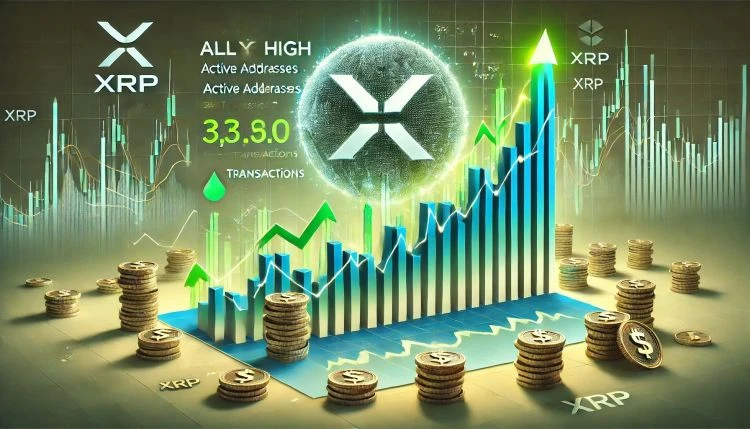
XRP has broken down from critical support levels, joining the broader crypto market in a wave of selling pressure driven by growing macroeconomic uncertainty. As risk sentiment weakens, bulls are struggling to defend key zones that previously held firm. Now, the focus shifts to reclaiming a pivotal level that could reverse the recent bearish trend and restore some confidence to investors. Related Reading: XRP Breaks Out Of Head-And-Shoulders Pattern Eyes Move Toward $1.30 Despite the harsh market conditions and price volatility, on-chain data reveals a promising development beneath the surface. According to Glassnode, the XRP network has reached a new all-time high of 6.26 million addresses holding 1 XRP or more. This metric signals growing adoption and distribution, even as prices slide a potential bullish divergence that often precedes long-term strength. The surge in small wallet growth suggests that retail investors are still entering the market, seeing value in XRP at current levels. While the short-term price action remains uncertain, the expanding network base may point to renewed demand once market conditions stabilize. Is this trend a sign of strength or simply a temporary reaction to lower prices? In a market full of fear, such network milestones could serve as a glimmer of optimism for XRPs long-term outlook. XRP Holds Below $2 As Analysts Split on What Comes Next XRP is now facing a critical test just below the $1.80 mark a level that many analysts view as the last key support before a potential steep decline. Market sentiment remains fragile, with bulls under immense pressure and bears steadily gaining ground. If XRP fails to hold this zone, some analysts warn that a sharp drop toward lower demand levels could follow, further weakening investor confidence. The atmosphere is tense and filled with uncertainty. Bulls argue that once broader market conditions begin to recover, XRP could be one of the first altcoins to rebound and reclaim its previous range highs. On the other hand, skeptics believe that XRPs trend has clearly broken down, and a return to bullish momentum could take longer than many anticipate if it happens at all. Despite the conflicting views on price action, on-chain data offers a glimmer of optimism. Top analyst Ali Martinez shared insights on X, revealing that the XRP network is quietly growing stronger. According to Glassnode, the number of wallets holding at least 1 XRP has reached an all-time high of 6.26 million. This surge in network participation could be a signal of long-term strength and resilience. If the broader market stabilizes, such steady growth in network fundamentals may give XRP the momentum it needs to mount a serious recovery. But for now, the $1.80 level remains the line in the sand and all eyes are on whether it holds or breaks. Related Reading: Oversold Altcoins Like Solana Flash Bullish Divergences Are Relief Bounces Coming? Price Struggles Below Key Averages as Selling Pressure Mounts XRP is currently trading at $1.82 after a sharp drop below the 200-day Exponential Moving Average (EMA) at $1.94 and the 200-day Simple Moving Average (MA) at $1.85. These technical levels were acting as key support during recent consolidation, but bulls failed to defend them, signaling growing weakness in the current trend. The breakdown began when XRP lost the $2 mark a psychological and technical level that had previously provided stability. Since then, bearish momentum has intensified, and buyers have struggled to regain control. With XRP now firmly below major moving averages, the risk of continued downside remains high. However, all is not lost. A decisive reclaim of the $1.95 level, ideally with strong volume and follow-through, could spark a recovery back above the $2 threshold. Such a move would likely restore short-term bullish sentiment and provide the foundation for a broader rebound. Related Reading: Ethereum Capitulation May Be Nearing End Will A Fed Pivot Spark A Recovery? On the flip side, losing the $1.80 support would be a major blow for bulls. If this level fails to hold, XRP could rapidly descend toward the $1.50 zone, where the next meaningful support lies. For now, traders are watching these levels closely as XRP battles to regain stability amid broader market turbulence. Featured image from Dall-E, chart from TradingView
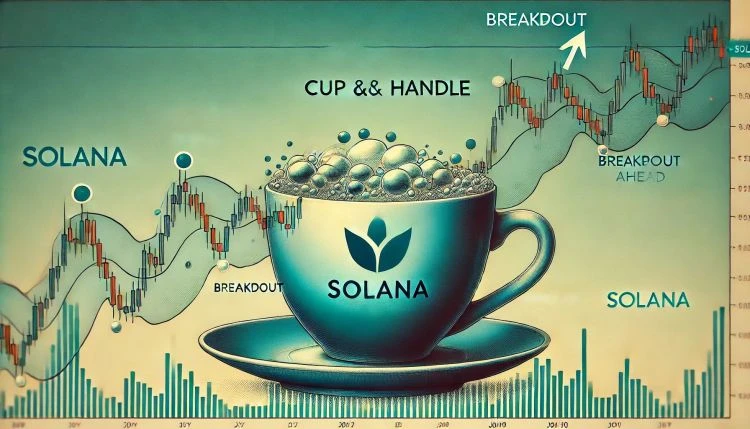
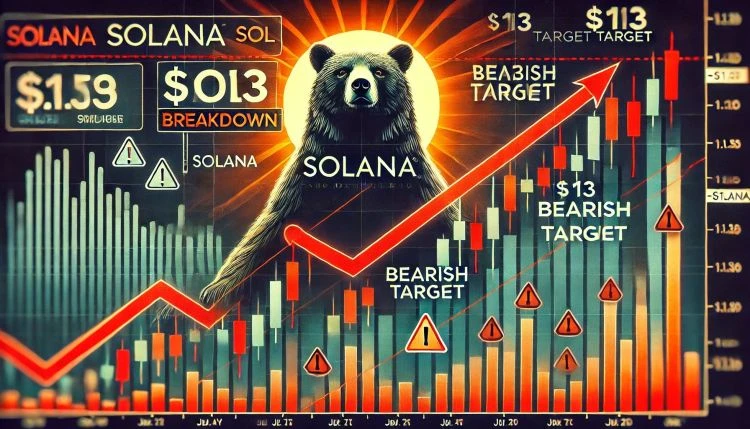
Solana is trading at critical levels after several days of trying to decisively break above the key $155$160 resistance zone. Bulls are slowly building momentum, as the broader crypto market shows signs of strength and hints at the possibility of a sustained rally. However, global risks remain elevated, particularly as no clear resolution has been reached in the ongoing US-China trade conflict, which continues to shape macroeconomic sentiment and investor behavior. Related Reading: Ethereum Reclaims Local Range Against BTC Can Bulls Target The Range High? Despite the uncertain backdrop, technical indicators are beginning to favor a bullish outlook for Solana. Top analyst Ali Martinez shared new insights, highlighting that when zooming out, Solana appears to be forming a textbook-perfect cup and handle pattern a classic technical setup typically associated with major bullish breakouts. If validated, this pattern could set the stage for a strong upside move in the coming weeks. Still, caution is warranted, as broader market volatility and unresolved geopolitical tensions could disrupt the developing momentum. The next few days will be pivotal for Solana’s trend, as bulls must defend key levels and build enough pressure to attempt a true breakout above resistance. Solana Shows Strength Amid Shifting Market Dynamics Solana is up 58% since early April, showing impressive recovery momentum as market dynamics start to shift. After months of weakness and selling pressure, Solana is now emerging as one of the stronger performers among major altcoins. Analysts are closely watching the $160 level, with many calling for a decisive breakout that could unlock further gains. However, risks remain elevated. The broader macroeconomic environment remains unstable, with global trade conflicts and financial market volatility weighing on investor sentiment. Solana has been particularly sensitive to this uncertainty. Since January, SOL lost over 65% of its value, highlighting the growing selling pressure and speculative behavior that dominated the market during the first quarter of 2025. Despite this, the recent surge has shifted short-term momentum back in favor of the bulls, offering hope for a broader recovery if key levels are reclaimed. Martinez’s analysis supports a bullish outlook for Solana. He points out that zooming out reveals Solana is forming a textbook-perfect cup and handle pattern. This classic technical structure often precedes strong upward movements, especially when accompanied by growing volume and supportive macro conditions. If confirmed, this setup could mark the beginning of a major rally for SOL in the weeks ahead. Related Reading: Solana Will Face A Pivotal Moment In May Bear Market Bounce Or Bull Market Dip? SOL Price Action Remains Tight Below Key Resistance Solana (SOL) is trading at $151 after several days of consolidation below the crucial $160 resistance zone. Bulls have managed to defend recent gains, but momentum has slowed as the price struggles to push higher. Reclaiming the $160 level is essential for bulls to regain full control and continue the recovery. A clean breakout above $160 could trigger a rally toward the $180 mark, which aligns with the 200-day moving average (MA) a critical technical barrier that, if flipped into support, would confirm a strong trend reversal. However, risks remain elevated if bulls fail to reclaim the $160 resistance soon. A failure at this zone could expose SOL to a deeper correction, potentially dragging the price back toward the $120$100 support area. This would not only erase recent gains but could also damage market sentiment, slowing Solanas recovery efforts. Related Reading: Ethereum Flips Key Resistance Into Support Can Bulls Reclaim $2,000 Level? For now, consolidation just below resistance suggests that buyers are attempting to build strength. However, the next few days will be critical to determine whether SOL can break higher or enter another corrective phase. All eyes remain on the $160 breakout level as the battle between bulls and bears intensifies. Featured image from Dall-E, chart from TradingView
Solana is now facing critical liquidity resistance as the broader crypto market attempts to stabilize following weeks of extreme volatility and uncertainty. After a brutal downtrend that saw SOL lose more than 47% of its value since early March, buyers are finally stepping in. This shift in momentum has sparked cautious optimism, but challenges remain ahead. Related Reading: Ethereum Long-Term Holders Show Signs Of Capitulation Prime Accumulation Zone? SOL had been under immense selling pressure for nearly two months, dropping from its peak to levels not seen since late 2023. After briefly falling below $100, Solana has bounced back and is now testing a key trendline resistance a level that could determine whether the recent rebound gains traction or fizzles out. Top analyst Ted Pillows shared a technical view on X highlighting that Solana is now 60% down from its peak, suggesting that capitulation has likely taken place. According to Pillows, the current setup looks like a retest of trendline resistance, which has historically acted as a major barrier for price recoveries. As Solana nears this critical level, traders are closely watching for signs of a breakout or rejection. The next few days could determine whether SOL reclaims lost ground or resumes its downward trend. Solana Eyes Breakout As Bulls Return After Brutal Correction Solana has finally shown signs of life after weeks of relentless selling pressure. Following a sharp correction that drove SOL to a low of $95, the asset bounced over 25% since Monday, signaling renewed buying interest. The recovery came in tandem with a broader market rebound triggered by U.S. President Donald Trumps announcement of a 90-day pause on reciprocal tariffs for all countries except China, whose tariffs were raised from 125% to 145%. Pillows shared a chart suggesting that Solana is once again testing a key trendline resistance, and capitulation may have already occurred. According to Pillows, this could be the turning point for Solana provided bulls can secure a decisive daily close above $130. Looking forward, multiple bullish catalysts are lining up for Solana. The highly anticipated Firedancer upgrade is expected to significantly boost scalability and performance. In addition, talks around the potential approval of Solana ETFs, as well as its inclusion in the Digital Asset Stockpile, add to investor optimism. On-chain activity is also rising, with stablecoin supply on Solana up 140% and DEX volume seeing a notable resurgence. If SOL can push past this trendline resistance and close above $130, a sustained rally could follow one that finally shifts market sentiment back in favor of bulls. Related Reading: Solana Eyes $200 Target As It Gains Momentum Recovery Could Mirror 3-Month Downtrend SOL Price Holds Key Support as Bulls Eye Recovery Solana (SOL) is currently trading at $117 as bulls attempt to reclaim momentum after weeks of selling pressure. The short-term goal remains clear: reclaim the $125 resistance zone, which has acted as a major barrier since the recent downtrend began. A decisive push above this level could open the door for a run toward $145, where the next liquidity zone sits and a full recovery rally may begin. However, maintaining support above $112 is absolutely critical. This level has become a key pivot area in the 4-hour chart, and bulls must defend it to avoid triggering a bearish reversal. If this support fails, the probability of SOL dropping back below the $100 mark increases significantly, potentially reigniting panic selling. Related Reading: XRP Network Activity Hits All-Time High Despite Market Volatility Bullish Signal? Despite market-wide volatility, SOL has shown resilience, bouncing more than 25% from its recent lows around $95. This upward momentum, however, needs to be sustained with consistent volume and strength above resistance levels. Investors are closely watching for a breakout above $125 as a potential confirmation that the recent bounce is more than just a relief rally. Until then, Solana remains in a tight range, with $112 and $125 defining the immediate battle zone. Featured image from Dall-E, chart from TradingView
In an analysis posted on Tradingview, cryptocurrency analyst Tradingshot presents a view where bitcoin might cross the $330,000 threshold. Utilizing a blend of historical pattern disruptions and the Theory of Diminishing Returns (TODR), the market analyst posits that the upcoming cycle may break from the traditional pattern of lesser yields. Bitcoin’s Journey Towards a Possible [...]
The post Crypto Analyst Predicts Bitcoin Could Surpass $330,000, Breaking Historical Growth Patterns appeared first on Crypto Breaking News.
Bitcoin is currently trading at $90,800 after a strong 13% rebound from the $81,000 level, as bulls attempt to regain control of price action. After days of volatility and uncertainty, Bitcoins recovery has renewed optimism in the market, but traders remain cautious as BTC faces key resistance levels. Related Reading: 2.23 Million Chainlink Moved To Exchanges In Two Weeks Selling Pressure Incoming? All eyes are now on Fridays President Trump Crypto Summit, where he is expected to announce a definitive plan for the U.S. Strategic Crypto Reserve. This event could have a major impact on Bitcoins trajectory, as regulatory clarity and institutional involvement could drive renewed investor interest. Top analyst Ali Martinez shared a technical analysis on X, highlighting a crucial resistance level at $97,000. According to his analysis, if Bitcoin reclaims $97K, it could gain momentum for a massive rally toward $150,000. This level is a key breakout zone, which could trigger a new leg up in the current market cycle. With Bitcoin hovering just below significant resistance, the next few days will be critical in determining whether BTC can push higher or faces another retracement. Traders are closely watching for confirmation of a breakout, with the Crypto Summit set to be a potential catalyst for the next big move. Bitcoin Prepares For A Breakout Bitcoin has faced massive volatility and sharp price swings since last week, keeping traders on edge as it struggles to establish a clear trend direction. After reaching $96,000, BTC plunged over 18% to $78,000, triggering panic selling and widespread liquidations. This sharp drop wiped out overleveraged positions, leading to heightened uncertainty as investors looked for signs of stabilization. Related Reading: Whales Bought 420 Million Cardano After Trumps U.S. Strategic Crypto Reserve Announcement Insights Since the crash, Bitcoin has been swinging up and down, failing to confirm a decisive move in either direction. Every attempt at a sustained breakout has met with selling pressure, while dips have been met with demand, leaving BTC stuck in a high-volatility phase. Martinez’s technical analysis on X points out that if Bitcoin reclaims $97,000, it could gain momentum for a move toward $150,000. His analysis is based on the Pi Cycle Top indicator, a historically reliable tool for identifying market cycle peaks and major trend reversals. Bitcoin could prepare for a massive rally if price follows previous cycle behavior, assuming key supply levels are reclaimed. For now, the $97,000 resistance remains a critical barrier. If BTC can flip this level into support, the market could see a rapid bullish expansion. However, failure to reclaim these levels could lead to further consolidation or another leg down before any major trend shift occurs. BTC Trading Above $90K: Can Bulls Hold It? Bitcoin is currently trading at $90,800 after enduring days of massive selling pressure and negative sentiment. Despite recent attempts to regain momentum, BTC has struggled to establish a clear trend, leaving traders cautious about its next move. For Bitcoin to confirm a recovery, it must stay above $90,000 in the coming days. Holding this level would signal renewed strength and could set the stage for a massive breakout. If BTC maintains this position, a push toward higher levels above $95,000 and beyond could follow, bringing the market back into bullish territory. However, if Bitcoin fails to hold $90,000, the situation could quickly turn bearish again. More importantly, losing the $85,000 level would likely trigger renewed selling pressure and even panic selling as traders rush to protect their positions. A breakdown below this key support zone would indicate further downside risks, potentially sending BTC to lower demand levels. Related Reading: 2.23 Million Chainlink Moved To Exchanges In Two Weeks Selling Pressure Incoming? With market volatility still high, the next few days are critical in determining Bitcoins short-term direction. Whether BTC stabilizes above $90K or faces another leg down will shape the markets momentum in the coming weeks. Featured image from Dall-E, chart from TradingView
Solana (SOL) is currently holding above the $125 mark, a level that has acted as support in recent weeks. While this may appear a sign of strength, the broader sentiment around SOL remains cautious. Analysts are warning that the latest surge in price could be nothing more than a bull trap, setting the stage for further downside. Despite the recent bounce, price action continues to show weakness, with lower highs forming on multiple timeframes a classic sign of bearish continuation. Related Reading: XRP Must Break Above $3 To Invalidate Bearish Pattern And Flip Bullish Analyst The overall crypto market remains under pressure, and many investors fear that a deeper bear market could be unfolding. Macroeconomic uncertainty, combined with rising risk-off sentiment, has added to the concern. As a result, confidence among retail and institutional investors is fragile. Some are exiting positions, while others are choosing to hold through the volatility, sitting on unrealized losses in hopes of a long-term recovery. With SOL struggling to establish clear momentum, analysts believe the path of least resistance remains to the downside unless bulls can reclaim higher levels with strong volume. A failure to maintain the $150 level could confirm bearish continuation and open the door for a move toward lower support zones. Until buyers return with conviction, Solana remains in a precarious position caught between the fading momentum of a short-lived rally and the growing weight of market uncertainty. The coming days will be crucial in determining whether SOL can recover or if more pain lies ahead. Solana Key Test As Bearish Sentiment Grows Solana price action shows signs of weakness as bulls struggle to build momentum. The recent market surge brought temporary relief to altcoins, but many analysts warn it may have been a bull trap a short-lived rally within a larger downtrend. With volatility rising again, Solana is now facing a critical test that could define its short-term direction. Investor sentiment remains divided. Some fear a deeper bear market is on the horizon, pointing to macroeconomic instability, rising interest rates, and broader risk-off sentiment. Others continue to hold through unrealized losses, hoping for a long-term recovery despite mounting uncertainty. As SOL trades in this fragile zone, conviction remains low, and every move is being closely watched. Runefelt highlighted a significant technical risk: if Solanas current ascending support fails, the token could drop to as low as $113. This support line has so far held up against sell pressure, but repeated tests without a clear bounce raise the risk of a breakdown. A drop to $113 would mark a major correction and erase much of the gains made earlier in the year. Until bulls can reclaim higher resistance levels and confirm a breakout, the dominant trend remains bearish. Analysts are warning that unless Solana can hold its current structure, the next leg down could come quickly. With the market on edge and momentum fading, Solanas price action over the coming days will be crucial in determining whether the asset can stabilize or if further declines are ahead. Related Reading: Avalanche 12-Hour TD Sequential Flashes Sell Signal After Nailing 50% Rally Details Bulls Aim To Reclaim Momentum Solana (SOL) is trading at $128 after two consecutive days of selling pressure, which erased a portion of its recent gains and pushed the asset back below key resistance levels. The markets sudden shift in sentiment has left bulls on the defensive, with price action weakening across the board. For SOL to regain momentum and confirm a bullish reversal, reclaiming the $180 level in the coming days is essential. The $180 zone has acted as a significant resistance point during previous rallies, and a decisive move above it would likely trigger renewed buying interest and open the door to a broader recovery. Without this breakout, however, the outlook remains fragile. If bulls fail to push prices higher and reclaim critical levels, Solana risks falling deeper into bearish territory. Continued weakness could lead to another leg down, as traders eye lower support zones and brace for a potential bearish surge. Related Reading: Ethereum Fails To Break $2,100 Resistance Growing Downside Risk? Market conditions remain volatile, and macro uncertainty continues to weigh heavily on risk assets. For now, SOLs short-term future hinges on whether buyers can step in soon and drive a move back above the $150$180 range to avoid a steeper decline. Featured image from Dall-E, chart from TradingView
XRP is trading above key support levels after several days of intense volatility driven by macroeconomic concerns and mounting trade war fears. Since March 11, XRP has jumped more than 35%, showing signs of renewed strength as bulls attempt to reclaim higher price levels and ignite a fresh rally. The move comes at a time when broader altcoin sentiment remains fragile, with no clear direction for the market in the weeks ahead. Related Reading: Ethereum Reclaims Realized Price Bulls Face Strong Resistance At $2,300 Despite the uncertain landscape, XRPs recent price action has caught the attention of traders and analysts alike. One of the more notable developments is the sharp rise in capital flowing into XRP futures. According to on-chain data from Glassnode, total capital allocated to XRP futures contracts has surged 36% in just two weeks. This increase in open interest points to rising trader confidence and suggests that many are positioning for more upside. Still, macro headwinds and technical resistance levels pose challenges. For XRP to maintain momentum, bulls must hold current levels and continue pushing toward key breakouts. With volatility likely to remain high, all eyes are on XRPs next move as market pressure continues to mount. XRP Bulls Eye Breakout Amid Market Uncertainty XRP is at a pivotal moment, with price action showing early signs of strength that could lead to a major breakout if bulls manage to reclaim key levels. After a 35% surge since March 11, the token now faces strong resistance zones that could either trigger a powerful rally or confirm investor fears of a bull trap. The broader market context only adds to the uncertainty. Since late January, financial markets including crypto have been shaken by growing trade war concerns and erratic policy signals from U.S. President Donald Trump. This instability has made traders more cautious, with many questioning whether current altcoin gains can be sustained. Selling pressure remains a threat, and failure to hold support levels could quickly reverse recent progress. Despite these concerns, XRPs on-chain and derivatives data suggest that bullish momentum is building. Top analyst Ali Martinez shared on X that the total capital allocated to XRP futures contracts has surged 36% in just two weeks, rising from $2.12 billion to $2.89 billion. This spike in open interest reflects increased confidence from traders and suggests that many are positioning for further upside. However, confirmation is still needed. XRP must reclaim critical resistance zones and sustain its gains to avoid a deeper pullback. Related Reading: Solana Tags Upper Bollinger Band For First Time Since ATH Is Momentum Returning? Bulls Defend Key Support At $2.25 XRP is currently trading at $2.35 after several days of failed attempts to break above the $2.60 resistance level. This price zone has proven difficult to overcome, with repeated rejections keeping the bullish momentum in check. For XRP to initiate a strong upward move, bulls must reclaim $2.60 with conviction a breakout that could trigger a surge toward the upper boundary of its current range. On the higher timeframe, XRP remains locked in a clear weekly range between the $2 support level and the $3.40 resistance. This range has defined price action for weeks, and traders are closely watching for a breakout in either direction. The $2.60 level sits just below the mid-range, making it a critical point for bulls to reclaim in order to gain control of the trend. Related Reading: Ethereum Accumulation Is Almost Over Breakout Above $2,200 Could Trigger Expansion Phase However, if bulls fail to hold the $2.25 support zone, a move back toward the bottom of the range is likely. A breakdown below $2.25 could open the door for a retest of the $2 level a key psychological and structural support. Until then, XRPs next major move hinges on whether buyers can push past resistance or fold under renewed selling pressure. Featured image from Dall-E, chart from TradingView
World Crypto Global opens the door to digital freedom for everyone.
Manage your free WCG Coins securely—where simplicity meets global accessibility.
FREE CRYPTO COINS
AVAILABLE FOR RESERVATION
ALREADY ALLOCATED

No fees. No catch. Your crypto journey starts here.