W o r l d . C r y p t o . G l o b a l

Loading

Welcome at World Crypto Global. This portal is packed with useful content and resources to built out your own crypto skills. WorldCrypto is a site member of Gabriel Vega Network.

Contact Info

CATEGORY: bullish prediction


Sep 29, 2024 12:05

Analyst Backs Bitcoin Hitting $290,000 In Bull Run Heres Why

In what has been an unusual September, Bitcoin (BTC) has now recorded another positive weekly performance.  According to data from CoinMarketCap, the maiden cryptocurrency surged by 5.07% in the last seven days, moving its cumulative gain in this month to 11.30%. Interestingly, with Bitcoin halving since gone, analysts remain highly expectant of the traditional market bull run by the largest digital asset. Related Reading: Heres Who Has Been Driving The Bitcoin Price Recovery Above $65,000 BTC In Consolidation As It Gathers Momentum For Breakout In an X post on Friday, popular analyst Crypto Rover predicted BTC will hit a $290,000 price mark in the upcoming bull run. Interestingly, this price projection tallies with previous statements from analysts who put a six-figure price target for BTC following the introduction of the Bitcoin spot ETFs which represents an increased institutional demand for the crypto market leader. Notably, BTC has been moving between $55,000 – $70,000 over the last seven months which represents a state of consolidation.  According to Crypto Rover,  following a breakout from this current sideways movement, Bitcoin is likely to enter the banana zone i.e. the phase of outrageous price growth, as seen in previous bull cycles.     The crypto analyst predicts that during this period which traditionally lasts for 12-18 months, BTC could trade as high as $290,000 representing a 339.39% gain on the assets current price. For many crypto enthusiasts, it is likely that the much-anticipated breakout will occur in the fast-approaching weeks as Bitcoin has now formed an inverse head and shoulders pattern as highlighted by Crypto Rover in another post. To explain, the inverse head and shoulders pattern is a common bullish indicator of potential reversals of a downtrend. If the price breaks above the neckline with significant volume, it indicates a shift to bullish control. These sentiments on a price breakout are further strengthened by the upcoming Q4 which has proven to be the most bullish period for Bitcoin with an average gain of 88% over the last 11 years.   Related Reading: MicroStrategys Bitcoin Bet Pays Off In Multiple Ways As Stock Surges 317% Bitcoin Exchange Stablecoins Ratio Shows Bullish Signal In more positive news for the Bitcoin community, the Bitcoin Exchange Stablecoin Ratio is currently indicating a buy signal. According to CryptoQuant analyst with username EgyHash, this metric which measures BTC reserves (in USD) to the combined stablecoin reserves on exchange is currently at the low levels seen at the start of 2024. EgyHash explains that a low ratio indicates traders have an increased buying power due to high stablecoin holdings which could translate into investments in Bitcoin, thus resulting in a price gain. Therefore, the current low Bitcoin Exchange Ratio adds to the list of bullish signals for Bitcoin investors. At the time of writing, the premier cryptocurrency continues to trade at $66,064 with a 1.14% gain in the last day. Meanwhile, Bitcoins daily trading volume is down by 12.92% and valued at $32.01 billion.  Featured image from Cwallet, chart from Tradingview

Sep 29, 2024 12:05

Notcoin Set For More Gains Following 13% Price Rally Details

Telegram-based cryptocurrency Notcoin has attracted investors interest in the last 24 hours with impressive price performance. According to data from CoinMarketCap, Notcoin notched a 12.75% profit on Friday to emerge as the markets top gainer. While the assets momentum appeared to have cooled following a price correction in the last few hours, certain trading indicators encourage investors to retain a bullish sentiment. Related Reading: Crypto Analyst Says Telegram-Based Notcoin Is Ready To Fly, Heres How High Notcoin To Hit $0.014 If Buying Pressure Persists: Analyst In an X post on Friday, popular crypto analyst Ali Martinez shared a bullish prediction on Notcoin. According to Martinez, the SuperTrend indicator on the NOTs daily chart has shown a buy signal following the tokens most recent ascent out of a falling wedge. The SuperTrend indicator just flashed a buy signal on the #Notcoin daily chart as $NOT breaks out of a falling wedge! Increased buying pressure could potentially push #NOT toward $0.012 to $0.014. pic.twitter.com/fJfWMDXCvV Ali (@ali_charts) September 27, 2024 Generally,  the SuperTrend is a simple technical indicator used to predict the potential direction of an assets price. A buy signal occurs when the price moves above the SuperTrendine suggesting the asset would likely maintain its upward trajectory.  According to Martinez, if investors are influenced by the SuperTrend indicator, thus increasing capital influx into Notcoin market, the token could likely surge trade as high as $0.012 – $0.014 representing a potential 41.41% gain on its present market value. In the presence of an overwhelming bullish pressure, NOT could rise to around $0.020 reaching price levels last seen in early August. Alternatively, if a price fall were to occur perhaps due to news events or macroeconomic factors, the telegram-based asset will likely find support around $0.0069.   Related Reading: Notcoin (NOT) Ignites Crypto Market, Analyst Predicts 25% Rally NOT Price Overview  Notcoin emerged as a play-to-earn token on the messaging platform Telegram, allowing people to earn by tapping a virtual coin and participating in game tasks.  Following its official launch in May,  Notcoin drew much attention, rising by over 380% to hit an all-time price of $0.029. However, the tokens value gradually declined in the following weeks and has since failed to return to such heights.  Nevertheless, NOT has quickly grown into a major digital asset, earning a spot in the top 100 cryptocurrencies with a market cap of $1 billion. At the time of writing, Notcoins price hovers around $0.0098 following a correction from the peak price of $0.0105 on Friday. The cryptocurrency boasts significant gains of 31.66% and 8.08% in the past seven and thirty days respectively.  Meanwhile, NOTs trading volume is up by a stunning 145.17% and valued at $374.18 million.   Featured image from Techopedia, chart from Tradingview

Jul 30, 2024 05:50

Dogecoin Ready For $0.3? Analysts Bullish On DOGE Price Breakout Attempt

Over the weekend, Dogecoin (DOGE) soared 11% after the general market performance. The price surge led the dog-themed token to retest key resistance levels, which fueled a bullish prediction by crypto analysts. Investors also shared a positive sentiment following Elon Musks recent comments regarding cryptocurrencies and the largest memecoin by market capitalization. Dogecoin Attempts To [...]

The post Dogecoin Ready For $0.3? Analysts Bullish On DOGE Price Breakout Attempt appeared first on Crypto Breaking News.

May 12, 2024 12:05

Why Bitcoins Post-Halving Rally Is Certain, Analyst Explains

Bitcoin experienced a price decline of 3.06% on Friday, falling as low as $60,372.36 based on data from CoinMarketCap. With the crypto market leader now in a consolidation phase, a trading analyst with X username Titan of Crypto has expressed resilient faith in Bitcoins ability to produce a post-halving price rally. Related Reading: Bitcoin Down 20% From March But Glassnode Analysts Are Very Bullish: Heres Why Bitcoin Rise Inevitable, Analyst Pinpoints $150,000 Price Target In a series of X posts on Friday, Titan of Crypto shared some interesting bullish predictions on the Bitcoin market. Firstly, the analyst noted that amidst BTCs price decline, the tokens price pattern on the daily timeframe had formed a bullish signal. Titan of Crypto referred to this signal as the bullish engulfing candle which occurs when a larger bullish candle completely emerges from the previous smaller bearish candle, thus indicating a potential reversal from a downtrend to an uptrend. Following these observations, the analyst also predicted Bitcoin to soon experience a massive post-halving price gain. Titan of Crypto described this forecast as inevitable citing data from Bitcoins price history. The crypto analyst said:  To understand the present you have to search in the past. And what the past is telling us is there is no occurrence of #BTC  not having a rally after the halving. Titan of Crypto also acknowledged that short-term price movements may be confusing however he expects BTC to maintain an upward trajectory in the long room. Based on previous post-halving rallies, Titan of Crypto predicts Bitcoin to trade at $150,000 in 2025. Related Reading: Bitcoin Short Term NUPL Value Turns Negative, What This Means For Price BTC Close To Bottom Price As Dip Buy Interest Drops In other news, blockchain analytics website Santiment also predicts the recent downturn in Bitcoins price could soon end stating the token is near a bottom i.e. the lowest point in a market fall at which price stops falling and starts rising exponentially. Interestingly, this prediction by Santiment is based on a decline in the dip-buying activity of Bitcoin investors. The analytics platform reports that the trading interest in Bitcoin following its most recent decline on Friday is far below levels associated with previous price falls. At the time of writing, Bitcoin continues to trade around $60,968, with an overall price loss of 3.26% in the last week. On the monthly chart, the digital coin also remains in the red zone, reflecting a decline of $13.64%. However, Bitcoins daily trading volume remains positive by 9.73% and $27.88 billion.  BTC trading at $60,922 on the daily chart | Source: BTCUSDT chart on Tradingview.com Featured image from Investopedia, chart from Tradingview

SUI Forms Inverse Head And Shoulders  Can Bulls Break Above $2.52?

Author: Sebastian Villafuerte
United Kingdom
Apr 04, 2025 12:05

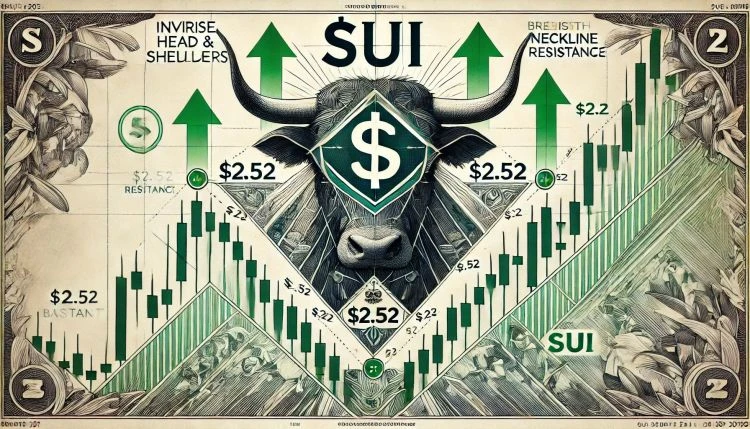
SUI Forms Inverse Head And Shoulders Can Bulls Break Above $2.52?

SUI is currently down 56% from its January all-time high, consolidating around a key support level as the broader market battles ongoing volatility and selling pressure. Like much of the crypto space, SUI has been hit hard by global macroeconomic uncertainty and investor risk aversion, leading many analysts to expect a continuation of the downtrend. With both traditional and crypto markets under pressure, bearish sentiment continues to dominate headlines. Related Reading: Chainlink Consolidates In Triangle Pattern Is A 35% Breakout Imminent? Despite the negative outlook, some analysts see early signs of a potential reversal forming. Top crypto analyst Ali Martinez shared a bullish observation, noting that SUI is showing an inverse head and shoulders pattern on a short-term time frame a technical formation often associated with a shift in momentum and a possible upward breakout. While the overall trend remains fragile, the emergence of this bullish structure may suggest a short-term rebound is possible if confirmed. For now, traders are watching closely to see whether this pattern will hold and ignite a rally or if broader market weakness will continue to drag SUI lower. SUI Holds Support As Bullish Pattern Forms Amid Market Turmoil SUI continues to face selling pressure as global markets react to heightened economic uncertainty. The latest wave of volatility followed U.S. President Donald Trumps announcement of new tariffs on what he declared Liberation Day, rattling investor confidence across both traditional and crypto markets. Risk assets, including altcoins like SUI, have been particularly vulnerable to these geopolitical shocks. Despite the turbulence, some analysts believe the worst may be over. They argue that the current environment could mark the beginning of a consolidation phase a necessary reset before the next major move. SUI appears to reflect this dynamic, with price action tightening between two key levels. Bulls have struggled to push SUI above the $2.50 mark, a critical resistance zone that has held strong through recent attempts. At the same time, bears have failed to break the $2.20 level, indicating solid demand at lower prices. Adding to the optimistic outlook, Martinez shared a bullish technical setup. According to his analysis, SUI has formed an inverse head and shoulders pattern a classic reversal formation on the short-term chart. If SUI can manage to decisively break above $2.52, this could trigger a short-term bullish reversal and open the door to further gains. While macroeconomic headwinds remain strong, the formation of a reliable bullish pattern amid consolidation is a positive sign. Traders are now closely watching the $2.52 level, which could serve as the catalyst for the next big move. If confirmed, the breakout could mark the start of SUIs recovery phase even as broader markets remain on edge. Related Reading: Whales Dump 760,000 Ethereum in Two Weeks Is More Selling Ahead? Price Action: Bulls Defend Key Support Levels SUI is currently trading at $2.30 after spending the past month below both the 200-day moving average (MA) and exponential moving average (EMA). This prolonged weakness has kept the asset under pressure, with bulls struggling to regain momentum. The current price zone is critical, and holding above this level is essential to avoid further downside. To initiate a meaningful recovery, bulls must push SUI higher and reclaim key resistance levels. The most important area to watch is the $2.85 mark, which aligns closely with the 200-day EMA. A breakout above this level would signal a potential trend reversal and could trigger renewed bullish momentum. Until then, price action remains vulnerable. If bulls fail to reclaim the $2.85 zone in the coming sessions, SUI risks another leg down. The next major support lies around $2.00 a level that could attract buyers but also marks the edge of a deeper correction if breached. Related Reading: XRP MVRV Ratio Dips Below The 200-Day MA Trend Shift Underway? With market sentiment still uncertain, the next move will largely depend on whether bulls can defend current levels and overcome resistance. A failure to do so could extend the consolidation or lead to more downside in the near term. Featured image from Dall-E, chart from TradingView

SUI Shows Relative Strength Against Bitcoin  New Uptrend In Play?

Author: Sebastian Villafuerte
United Kingdom
Apr 27, 2025 12:05

SUI Shows Relative Strength Against Bitcoin New Uptrend In Play?

SUI has been trading with impressive strength since setting a local low around $1.71 just over two weeks ago. Since Monday, SUI has gained more than 79% in value, reflecting a surge in bullish sentiment and positioning itself as one of the standout performers in the current market environment. Related Reading: Bitcoin Rally Lacks On-Chain Support Analyst Warns Of Vanishing Network Activity However, risks remain elevated as tensions between the US and China continue to escalate, creating uncertainty across financial markets. Trade conflicts and geopolitical friction could still weigh heavily on risk assets if conditions worsen. Top analyst Kaleo shared an analysis highlighting that SUI is gaining strength against Bitcoin, marking one of the first times in recent months that an altcoin shows significant relative performance compared to BTC. This strength is notable as most altcoins have struggled to outperform Bitcoin in a market dominated by caution and defensive positioning. The next few days will be critical in determining whether SUI can sustain its breakout or if a period of consolidation will follow. SUI Leads Layer-1 Blockchains as Momentum Builds SUI has positioned itself as one of the leading Layer-1 (L1) blockchains during the recent market rally. A Layer-1 blockchain refers to a base blockchain network, such as Bitcoin or Ethereum, that processes and finalizes transactions without relying on another external chain. These networks operate independently with their own security protocols, native tokens, and decentralized validators, forming the backbone of the broader crypto ecosystem. Over the past two weeks, SUI has shown remarkable strength, significantly outperforming many other assets. If the market enters a sustained bullish phase for altcoins, SUI is likely to continue leading the pack, thanks to its recent resilience and strong relative performance. However, the environment remains extremely high risk. Some analysts are warning that current levels across crypto and equities could trigger a sharp market-wide retrace if sentiment shifts. Kaleos recent analysis on X suggests that SUIs strength against Bitcoin is a particularly encouraging sign. He notes that SUI might be one of the first major L1s to hit new all-time highs during this bounce, reflecting strong underlying demand. The next week will be critical; US equities are now testing major resistance zones, and uncertainty around the ongoing US-China trade conflict continues to weigh heavily on global markets. How financial markets react over the coming days will likely influence whether SUI can extend its rally or enters a period of consolidation alongside broader risk assets. Related Reading: Ethereum Attempts First Major Horizontal Reclaim In Months Can Bulls Hold the Line? SUI Battles Key Levels As Bulls Push Forward SUI is currently trading at $3.53 after several days of aggressive buying pressure that has propelled the price higher. The bullish momentum has been impressive, positioning SUI as one of the strongest-performing Layer-1 blockchains in the market. However, for this momentum to sustain, bulls must defend critical levels. The most important short-term level is $3.20, which aligns closely with the 200-day moving average (MA). Maintaining price action above this zone would confirm a bullish market structure and offer a solid foundation for further gains. If SUI manages to hold above the 200-day MA, it would signal strong underlying demand and reinforce bullish sentiment around the asset. Related Reading: Bitcoin Reclaims Key Levels New ATHs May Be Closer Than Expected For a continuation of this aggressive uptrend, the key challenge lies at the $4.00 mark. Reclaiming and consolidating above this resistance would open the path toward a potential new all-time high (ATH), especially if momentum remains strong across the broader crypto market. Featured image from Dall-E, chart from TradingView

Apr 22, 2024 12:05

Bitcoin Tipped To Attain Six-Figure Value Following Fourth Halving Details

With the Bitcoin halving event now completed, analysts and market experts turn their attention to a much-anticipated bull run based on historical trends in the BTC market. In particular, a crypto analyst with the X handle ecoinometrics has tipped the maiden cryptocurrency to at least achieve a six-figure in the current bull cycle. Related Reading: Battle For The Halving Block: Bitcoin Users Spend Record $2.4 Million On Block 840,000 How High Can Bitcoin Rise Post Halving?  In an X post on Saturday, ecoinometrics shared a strong bullish prediction of Bitcoin price following the fourth halving event on April 19. The crypto analyst stated that if  BTC produced a similar growth pattern seen in previous bull cycles, its market price would likely range between $140,000 – $4,500,000.  For context, the bull run, which forms the latter part of the Bitcoin bull cycle, occurs in the months following the halving event, according to BTCs price history. During this period, the market leader is known to record massive price gains, as seen after previous halvings in 2012 (7,592.30%), 2016 (1,818.8%), and 2020. Price range for Bitcoin in the 4th halving cycle: upper bound ~ $4,500,000 lower bound ~ $140,000 That is *if* Bitcoin ends up following a growth trajectory in the range of the previous cycles. pic.twitter.com/s93yldJEI0 ecoinometrics (@ecoinometrics) April 20, 2024 Ecoinometrics stated that a repeat of such positive performance could see Bitcoin trade as high as $ 4,500,000 per unit. However, other speculators have attacked this prediction, believing BTC will likely soon experience some level of diminishing returns. Thus, such a high price level seems unfeasible. In response, ecoinometrics stated that Bitcoin currently operates similarly to megacap tech stocks, which have shown notable defiance to this economic theory. However, the analyst acknowledged that $4,500,000 may be an unrealistic price target for BTC, but there is much confidence that the digital asset will achieve a mid-six-figure value. Related Reading: Polkadot Unveils Major Upgrade Plan: Relay Chain Replacement And 10M DOT Prize Incentive Bitcoin Price Overview Bitcoin is currently trading at $65,043, with a modest 2.21% gain over the last 24 hours. However, its daily trading volume has declined massively, falling by 52.88% to a substantial $21.62 billion, underscoring decreased market activity and investor interest.  Over the past week, Bitcoin has also shown fair improvement resulting in a total gain of 1.86%. However, despite these recent gains, the monthly chart reflects a decline of 4.16%, following some significant price dips and massive liquidations in the past week.  On a larger scale, Bitcoin remains quite impressive, with its year-to-date growth percentage of 131.69%. With a market cap value of  $1.28 trillion, the premier cryptocurrency remains the largest digital asset in the world. BTC trading at $65,270.47 on the daily chart | Source: BTCUSDT chart on Tradingiew.com Featured image from iStock, chart from Tradingview

Apr 21, 2024 12:05

Analyst Predicts Cardano (ADA) To Rally By 75% As MVRV Ratio Plummets

In recent weeks, ADA, the native token of the Cardano network. has drawn much speculation due to a rather turbulent price performance resulting in a decline of 18.77% in the past month. This negative price movement is similar to the majority of the cryptocurrency market following unprecedented massive dips in the price of Bitcoin.  However, despite ADAs troubles, popular crypto analyst Ali Martinez is backing the coin to pull off a remarkable rebound. Interestingly, Martinezs prediction comes as the digital asset attempts to find its feet, gaining by 9.92% in the last day, according to data from CoinMarketCap. Related Reading: Crypto Analyst Predicts Cardano Rally To $3 As Price Reaches Ultimate Support Test ADA Tipped To Hit $0.80, Record Yearly High In a post on X on April 19, Ali Martinez shared that ADA may soon record an impressive price surge. Martinez predicted the tenth largest cryptocurrency could soon record a 75% gain due to its MVRV Ratio being lower than -22%. For context, the Market Value to Realized Value (MVRV) ratio is a metric used in crypto technical analysis to assess the valuation of a digital asset relative to its realized value. It is basically used to know if a token is overvalued or undervalued based on its market price compared to the average cost basis of its holders.   An MVRV ratio of -22% indicates that the market value of ADA  is significantly less than its realized value. However, Ali Martinez notes the last time the coin was this undervalued was in June 2023, after which it rose by 75% in the next month.  Based on such historical price data, the crypto analyst predicts ADA could replicate a similar performance over the next few weeks, attaining a market price of $0.80, which would represent its highest value in the last year. At the time of writing, ADA trades at $0.46, with a 2.43% gain in the last hour. In a similar fashion, the tokens daily volume is up by 43.07% and $595.30 million. Related Reading: Cardano (ADA) Prints Undeniable Bull Run Signal: Crypto Analyst Cardano Launches New Era Of Decentralized Governance  In other news, the Cardano network is set to commence a new era in decentralized governance, according to an announcement by the CEO of the Cardano Foundation, Frederick Gregaard. In an X post on April 18, Gregaard stated the full constitution for this change in government is on the horizon, with an interim constitution now going into effect. According to the Cardano Foundation boss, the interim constitution emphasizes core network values such as transparency, openness, and responsible decision-making. It aims to grant each ADA holder an influence in determining the future of the Cardano ecosystem via an inclusive government in which all stakeholders are privileged to certain rights and responsibilities as listed in the constitution.  ADA trading at $0.4778 on the daily chart | Source: ADAUSDT chart on Tradingview.com Featured image from Forbes, chart from Tradingview

Mar 10, 2025 12:05

Polkadot (DOT) Nears Critical Zone: A Reversal Could Trigger 180% Surge

Polkadot (DOT) prices have declined by 4.38% in the past day as bearish forces continue to gain stronger market control. According to data from CoinMarketCap, DOT’s price fall only underlines the asset’s form in recent days as indicated by the 7.99% loss in the last week. However, market analyst Ali Martinez postulates that this downtrend could soon result in something positive. Related Reading: Polkadot Price Crisis: Further Losses Incoming After DOT Falls Under $4.8 Polkadot Approaches Key Support Can DOT Hold And Rebound To $10.80? Following the intense price volatility that swept across the crypto market last week, Polkadot slipped below a key support level at $4.47, signaling an increased bearish pressure. According to Ali Martinez, the altcoin appears to be heading to a crucial support zone at $3.80, which could potentially halt the current decline. Based on the presented analysis, DOT is undergoing a wide range of consolidation moving in a parallel channel that stretches as far back as July 2023. Therefore, if the current downtrend persists, the altcoin will likely retest at $3.80 which represents the lower boundary of this parallel channel. According to historical patterns, market bulls are expected to step in at this support zone and ramp up demand to prevent further decline. Martinez explains that if this projection occurs, Polkadot could experience a price bounce to around $6.40 i.e. midpoint of the parallel channel. With strong buying pressure, DOT investors could expect a price rise to around $10.80 i.e.the upper boundary of the parallel channel, representing a potential 180% price gain. On the other hand, if DOT bulls fail to hold the $3.80 support level, the altcoin could slide to $2.30 with potential price targets around $1.25-$1.45. Related Reading: Polkadot (DOT) Defies Market Volatility, Holds Strong Above $4.8 Support Level Polkadot Market Overview At press time, Polkadot trades at $4.32 following a daily price decline of over 4% as earlier stated. In tandem, the asset’s trading volume has reduced by half in the past 24 hours and is now valued at $145.81 million. A drop in price with falling trade volume can signal a waning selling pressure presenting the potential for a price reversal as postulated by Ali Martinez. Looking at the technical indicators on its daily chart, the Relative Strength Index (RSI), used to determine overbought or oversold market conditions, currently stands at 39 but is headed downward. This reading adds more support for DOT’s predicted bullish rebound. However, the asset’s price is far below its 100-day Simple Moving Average (SMA) suggesting the projected price rally may not occur immediately. Meanwhile, with a market cap value of $6.72 billion, Polkadot continues to rank in the 30 largest cryptocurrencies in the world. Featured image from Dreamstime, chart from Tradingview

Mar 09, 2025 12:05

Will XRP Hit $27? Historical Data Suggests Another 718% Price Surge

The XRP market has experienced some significant bullish action in the past week with prices rising by 7.05%. Amidst this surge, popular market analyst Egrag Crypto has provided an interesting bullish prediction highlighting two potential price targets for the altcoin. Related Reading: Solana (SOL) Crashes 15% After Massive Profit-Taking Spike XRP Price Outlook: Analysts Eye $9.7 And $27 Breakout Targets In an X post on March 7, Egrag Crypto shared an audacious technical analysis of the XRP price action suggesting the altcoin may be gearing up for a major price upswing following recent gains. Egrag Crypto’s positive prediction is based on XRP’s potential ability to repeat a price surge from its 2017-2018 bull cycle. While past performance does not guarantee future results, the repeating nature of market cycles has led certain analysts to believe that XRP could experience another parabolic move. Notably, in early 2018, XRP moved from a breakout range of $0.35-$0.39 to a local market peak of around $2.89. However, for XRP to show any potential in validating a repeat of this price surge, market bulls must reclaim the $3.4 price level, which represents the local peak of the current bull cycle.  Using this price level as a reference point, Egrag Crypto identifies $9.7 as the first major price target for XRP, mirroring the midpoint of its 20172018 breakout. The analyst explains that for investors looking to take profit, it would be ideal to sell at or around this price level i.e. $8, $9, $10, rather than waiting for an exact market peak. The second, more intriguing target would happen if XRP produces an exact 718% price surge, suggesting a potential price target of approximately $27. Related Reading: SUI Rallies 10% After Securing Deal With Trump Finance Arm XRP Price Overview At the time of writing, XRP trades at $2.34 reflecting a 5.34% decline in the past 24 hours. However, its daily trading volume has increased by 8.56% and is now valued at $8.63 billion.  In realizing Egrag Crypto’s bullish prediction, the altcoin must push past immediate resistance levels at $2.62 and $3.0 before a fated encounter at the $3.4 price barrier. Furthermore, there must be a significant increase in buying volume and market participation. Other potential bullish factors include a clear regulatory stance around XRP. While its addition to the US digital assets stockpile is a much-welcome development, a termination of the SEC’s appeal case against Ripple would erase all regulatory and legal concerns around XRP. Finally, a widescale bull run across the crypto market is another potential bullish driver. Notably, XRP was one of the best-performing crypto assets in the late Q4 2024 crypto rally, rising by over 460% in three weeks following the US elections. Featured image from iStock, chart from Tradingview

Mar 24, 2025 12:05

SUI Poised For Price Rally? Ascending Channel Suggests Move Toward $2.50

SUI was stuck in a choppy price action in the last week, eventually recording a 2.48% loss. Just like the rest of the crypto market, the altcoin has remained largely in consolidation for the past two weeks with little indication of its next price breakout. However, amid this sideways movement, crypto analyst Ali Martinez has identified potential for some significant short-term gains. Related Reading: SUI Bulls Test Key Resistance A Breakout Or Rejection Ahead? Staying Above $2.26 Is Key To SUI Bullish Structure In an X post on March 22, Martinez shares a positive technical analysis of the SUI market based on recent price movements on the 4-hour chart. The crypto analyst notes that SUI has been moving within an ascending channel since March 11 and is likely poised for an imminent upswing. An ascending channel is a popular bullish pattern formed by two parallel trend lines sloping upwards. Both trendlines act as resistance and support keeping an assets price within range. Despite this limited price movement, an ascending channel is considered bullish as it indicates a significant buyer’s influence. Based on the chart provided by Martinez, SUI has recently retested the support line of its ascending channel at $2.26 showing intentions of an uptrend. Provided that SUI suffers no sudden dip below this support, the crypto analyst projects a rise to around $2.50 representing the resistance (upper trendline) of the ascending channel. In the presence of a strong market demand, SUI could break out of this ascending channel with an immediate target of $3.0. However, any decisive price fall below $2.26 support could result in prices as low as $1.75. Related Reading: SUI Ready For 15% Move Amid Key Level Retest Breakout Or Breakdown Ahead? SUI Market Overview The SUI community showed much excitement in the last week as Canary Capital filed an application for a SUI spot ETF with the US Securities and Exchange Commission (SEC). This move followed a trust registration for the proposed fund in Delaware earlier in March. Prospects of a spot ETF are considered highly bullish due to the promise of institutional investment as seen with Bitcoin and Ethereum over the last year. At the time of writing, SUI was trading at $2.28, reflecting a 0.84% gain in the past day. Meanwhile, the assets trading volume has crashed by 31.69% indicating a decline in market participation. Notably, the altcoin is also down by 30.21% on its monthly chart due to a strong bearish influence over the past few weeks. Nevertheless, SUI remains a major headliner of the current cycle following an impressive price performance between Q4 2024 to early January 2025 where it surged to establish a new all-time high of $5.35. And with the cycle potentially far from over, certain analysts are backing the bullish potential of SUI describing the current downtrend as a good buying opportunity. Featured image from Boxmining, chart from Tradingview

Mar 17, 2025 12:10

Stellar (XLM) Price Could Surge To $0.38 Analyst Explains How

After a turbulent start to the week, the Stellar price seems to be finding some stability, briefly climbing above the $0.28 level this weekend. This growing momentum has sparked interest from market enthusiasts, with prominent crypto analyst Ali Martinez projecting the XLM token to soon experience a sustained price rise. Related Reading: Bitcoin Price Breaking Out Of This Pattern Can BTC Reclaim $90,000? XLM Primed For 40% Price Gain  In an X post on March 15, Martinez shared an intriguing projection for Stellar price after rebounding off a crucial level. Martinez noted that the altcoin could be on its way to a new local high over the coming weeks. This bullish projection is based on the formation of a descending channel pattern on the XLM daily chart.  For context, a descending channel is a common pattern in technical analysis characterized by two major (downward-sloping) trendlines. The upper boundary line connects a series of lower highs and the lower channel line connects the lower lows. The assets price typically persists within the channel; with the upper boundary line acting as resistance and the lower channel line considered a support floor. The descending channel formation is usually a bearish pattern, indicating the persistence of a downward trend. When the price breaks down the lower channel line, it signals the continuation of the downtrend. Conversely, a break out of the descending channel can be used to identify trend reversal points usually from a bearish trend to an upward trend.  XLM’s price has been in this descending channel since November 2024, recently bouncing back from the lower boundary line. As observed in the chart above, the altcoin fell to support around the $0.23 level in early March, but it has since turned around toward the channels midline. According to Martinez, the next price target for XLM is $0.30 at the channels midline. However, the analyst believes Stellar could make a play for as high as $0.38 at the upper boundary line i.e. representing a potential 40% surge from the current market price. The last time the Stellar traded around the $0.38 region was in early February and has since plummeted as low as $0.23 since then.  Stellar Price Overview As of this writing, the XLM token is valued at around $0.27, reflecting a 0.83% gain in the past 24 hours. According to data from CoinMarketCap, the Stellar price is down by 0.76% in the last seven days despite the woeful start to the week. Meanwhile, the altcoins value has declined by 17.25% in the past month. Related Reading: XRP Price To $110? Bollinger Bands Creator Reveals Why It Will Become A Market Leader Featured image from Medium, chart from Tradingview

Dogecoin Holds Critical Support Level  Can Bulls Reclaim $0.25?

Author: Sebastian Villafuerte
United Kingdom
Mar 02, 2025 12:05

Dogecoin Holds Critical Support Level Can Bulls Reclaim $0.25?

Dogecoin is trading above the $0.20 level after days of intense selling pressure and market-wide volatility. Bulls have lost control of the price action, and DOGE is now at risk of further declines if it fails to hold key support. The broader meme coin market has also been hit hard, contributing to Dogecoins struggles as sentiment remains weak. Related Reading: Ethereum Retraces To Critical Monthly Demand Level Can ETH Hold Selling Pressure? Top analyst Ali Martinez shared a technical analysis on X, revealing that DOGE is testing a high-time-frame support level around $0.18. This level has historically acted as a strong demand zone, making it crucial for bulls to defend it. If DOGE manages to hold above this support and reclaim the $0.22 level, a short-term recovery rally could be possible. However, if selling pressure persists and DOGE loses the $0.18 support, the next stop could be significantly lower. Market conditions remain uncertain, and traders are closely watching whether Dogecoin can stabilize or if further downside is on the horizon. The next few days will be critical in determining whether DOGE can recover or if it will continue to follow the bearish trend that has dominated the market in recent weeks. Dogecoin Testing Long-Term Demand Level Dogecoin is trading below the $0.25 mark, a key price level that will determine short-term direction. Analysts are warning of further downside risks as the market continues to face heavy selling pressure. The meme coin sector has been hit the hardest during this correction, and Dogecoin is leading the way with a 36% drop in the past two weeks. Sentiment remains bearish, and investors are looking for signs of stability before considering any potential recovery. Martinez shared a technical analysis on X, revealing that Dogecoin is trading above a critical support level around $0.18. This level is crucial for maintaining the long-term bullish structure. If bulls manage to hold above this mark, it could prevent further downside and provide a foundation for a recovery rally. Martinez also notes that DOGE is currently holding around the lower boundary of a macro ascending channel. Historically, this level has acted as a strong support zone for price rebounds. Related Reading: Is Solana In A Macro Trend Move? Charts Show Potential Shift If Dogecoin holds this level, a massive rally could follow, potentially pushing the price back toward the $0.25 resistance level. However, if the support fails, DOGE could experience a deeper correction. The next few days will be critical in determining whether DOGE can sustain its bullish structure or if it will continue its downward trend. Crucial Phase For DOGE Price Action Dogecoin is trading at $0.20, sitting at a crucial short-term resistance level just below $0.21. Bulls are trying to regain control, but selling pressure remains strong, making it difficult for DOGE to break above this key price point. If bulls successfully reclaim the $0.21 level and push above the $0.25 mark, a strong rally into higher prices could follow, potentially shifting market sentiment in favor of buyers. However, the downside risk remains significant. If DOGE fails to hold its current levels and loses support at $0.18, it could trigger a deeper correction, pushing the price toward lower demand zones. This level has historically acted as a critical support for Dogecoin, and losing it could lead to further sell-offs in the broader meme coin market. Related Reading: Litecoin Holds Solid Structure Amid Market Breakdown Analyst Forecasts A Big Move The next few trading sessions will be crucial in determining the direction of DOGE. A breakout above resistance could signal the start of a recovery, while a failure to hold key levels may result in further bearish momentum. Traders are watching closely for confirmation of either scenario as meme coins continue to face heavy volatility in the current market conditions. Featured image from Dall-E, chart from TradingView

Can SUI Break Past $2 Resistance? On-Chain Metrics Reveal Growing Demand

Author: Sebastian Villafuerte
United Kingdom
Oct 03, 2024 12:05

Can SUI Break Past $2 Resistance? On-Chain Metrics Reveal Growing Demand

SUI has experienced an impressive surge of over 160% since the start of September, with its price now hovering around $2. This remarkable rally has analysts and investors highly optimistic about the future of the layer-1 blockchain. Beyond its soaring price, SUI is showing strong growth across key metrics, signaling increasing adoption and usage. According to data from DefiLlama, SUIs total value locked (TVL) has reached new all-time highs, indicating a robust demand for its decentralized finance (DeFi) ecosystem. The rising TVL highlights a growing interest from users and developers, further boosting confidence in SUI’s long-term potential. Related Reading: Solana (SOL) Could Go Parabolic Once It Breaks $200 Resistance Analyst The price surge is not just driven by market sentiment but is backed by tangible growth in the platform’s fundamentals. With both TVL and user engagement increasing, the positive outlook for SUI continues to build. Investors are now eyeing higher price targets as they anticipate further growth for the layer-1 blockchain in the coming weeks. As SUI pushes to higher levels, its performance reflects both strong market support and underlying network growth, making it one of the most talked-about projects in the crypto space. SUI TVL Signals Ongoing Rally SUI is currently testing a crucial supply level around the $2 mark, a psychological barrier that, once surpassed, could pave the way for a surge to new highs. Analysts are watching this level closely, as breaking through it would likely trigger a strong bullish move. On-chain data from DefiLlama supports this optimism, revealing that SUI’s total value locked (TVL) has reached an all-time high of $1.07 billion. This marks a remarkable 65% increase in TVL over the past 30 days, signaling growing confidence in the platforms utility and long-term potential. The rise in TVL is a net positive for the SUI coin, as it reflects the increasing adoption of the Sui ecosystem. As more value flows into the network, the demand for SUI tokens will likely grow, creating upward pressure on its price. Investors often view rising TVL as a bullish signal, suggesting that the platform is gaining traction and trust among users. Related Reading: XRP Price Bullish Potential Grows A Surge Above $0.65 Will Trigger Buyers If these positive trends in TVL and overall network activity continue, a rise above SUI’s previous all-time high of $2.16 seems likely in the coming weeks. With momentum building, many expect SUI to achieve further gains, reinforcing its position as a leading layer-1 blockchain. Price Action: Liquidity Levels To Watch SUI is currently trading at $1.89, just 15% away from its all-time high of $2.18. The recent price action has been promising, with an 8% surge in the past hours. Many analysts believe that if SUI can break above the critical $2 level, the chances of reaching new all-time highs are very high. This psychological barrier could trigger a wave of buying pressure, pushing the price to new levels. However, some investors are cautious, expecting a healthy correction before further upward movement. If SUI fails to break past the $2 mark, a retracement to support levels around $1.60, or even down to $1.45, would not be unexpected. Such a correction could provide a solid foundation for the next bullish leg, allowing SUI to gather momentum before attempting to breach the $2 resistance again. Related Reading: Dogecoin Could Target $0.20 Soon, Analyst Predicts Is DOGE Primed For A Rally? Despite this, the overall sentiment remains optimistic, with many investors holding out for a new all-time high shortly. SUIs recent performance and market dynamics suggest that the coming days will be crucial for determining its next move. Featured image from Dall-E, chart from TradingView

Oct 13, 2024 12:05

Bitcoin Price Hits $63,000 Is The Market Set For Takeoff?

According to data from CoinMarketCap, Bitcoin (BTC) gained by 4.08% in the last 24 hours as it briefly traded above the $63,000 price mark. Notably, this price rise comes following a decline that saw the market leader trade below $59,000 on Thursday. While the market sentiment is currently bullish, certain conditions are needed to procure an actual bullish breakout. Related Reading: Bitcoin Price Crash: $1.83 Billion Makes Its Way To Exchanges, Is A Bloodbath Coming? Bitcoin On The Brink Of Short-Term Bullish Run Following Bitcoins price ascent to around $62,000 on Friday, CryptoQuant analyst with the username Yonsei_dent shared a key insight on the asset’s potential price movement.  In a Quickake post, Yonsei_dent highlights $62,700 to be the key price level for short-term holders i.e. $62,700 represents the average price at which many short-holders acquired Bitcoin, which the analyst states has remained consistent for the last three months. Therefore, this presents a critical price level for BTC, a movement above which signals a change in a market shift and can spur buying activity from short-term holders. However, Yonsei_dent notes that Bitcoin needs to rise above $63,000 to initiate a significant bullish momentum over the coming weeks.   Since this price commentary, Bitcoin has traded above $63,000, albeit temporarily before retracing to around $62,300. This brief breakout can be traced to a lack of significant trading volume, a condition critical to the short-term bullish breakout deceived by Yonsei_dent. Currently, Bitcoins trading volume is valued at $30.75 billion, however, reflecting only a minor 2.94% gain in the last 24 hours.  If the price of BTC returned above $63,000 with a marked increase in trading activity, the premier cryptocurrency could rise to around $67,000, at which lies its next significant price resistance level. Related Reading: Is The Bitcoin Bull Run Over? Top Analyst Predicts Whats Next For Crypto Bitcoin Approaches Critical November  In contrast to popular sentiments, Bitcoin has so far experienced a rather tumultuous experience in October. And while the crypto market leader may eventually pull off an Uptober, November is shaping up to potentially provide the needed bullish drivers for the BTC market. Firstly, investors expect the Federal Reserve to implement a 25 basis points cut which would avail more liquidity for volatile assets such as Bitcoin.  Furthermore, the upcoming US elections have also gained significant influence in the crypto market with digital asset regulation becoming a major policy discussion. If pro-crypto Republican candidate Donald Trump secures victory over Vice President Kamala Harris, analysts are hopeful the Bitcoin bull run will finally take off.  At the time of writing, Bitcoin trades at $62,697 reflecting a 1.07% gain in the last week.  Featured image from Forbes, chart from Tradingview

Jan 27, 2025 12:05

Dogecoin Appears Poised For Explosive 10,000% Gain Analyst

Dogecoin (DOGE) has shown some upward mobility in the last day following a rather bearish trading week. Based on data from CoinMarketCap, the premier memecoin remains an investors favorite amidst the current bull season with almost 90% of its community confident in future price gains. Notably, prominent crypto analyst Ali Martinez has dropped another bullish prediction on Dogecoin suggesting the token’s potential register a 10,000% price gain. Related Reading: Think Dogecoin Has Topped Out? Two Factors That Say No Way Could Dogecoin Repeat Bullish Feat? In a recent post on X, Martinez shared a positive analysis of Dogecoin based on historical price data. According to the crypto pundit, DOGE experienced a 10,000% price gain in the last bull cycle in 2021. During this period, the memecoin’s value increased from around $0.007 to $0.700 within 98 days. Looking at DOGEs current trading chart, the cryptocurrency presents a similar situation to when the price surge began in 2021. Martinezs predictions indicate if Dogecoin is able to mirror such robust bullish movement, it could attain a market price of $14.78 by May 2025.   As earlier stated, bullish sentiments around Dogecoin are currently heightened creating significant potential for this highly favorable scenario. A substantial portion of this positive market sentiment is centered around the possibility of a Dogecoin Spot ETF. Amidst the many developments in the past week, prominent asset manager Bitwise has filed a proposal for a Bitwise Dogecoin ETF  to the Division of Corporation, US Department of State, Delaware. NewsBTC reports that Bloomberg analyst Eric Balchunas has also confirmed the authenticity of the proposed DOGE Spot ETF which is likely coming soon. Interestingly, Ali Martinez previously predicted the Dogecoin spot ETF can serve as a positive market driver pushing DOGE’s prices to around $15 in line with his most recent price forecast. These projections are based on the nature of the Spot ETF which is designed to attract institutional demand as seen with Bitcoin. Related Reading: Still Waiting For An Altcoin Season? These Metrics Show Why It Might Never Happen DOGE Price Overview At press time, Dogecoin is valued at $0.354 after a 1.72% gain in the past day. On the other, its daily trading volume is down by 30.09% indicating decreasing investor activity. On larger timeframes, DOGE reflects an 11.43% loss on its 7-day chart but an impressive 13.96% profit on its monthly chart indicates an overall positive performance In recent weeks. For short-term traders, a crypto analyst with X username Kev_Capita_TA believes Dogecoin may be entering an upward consolidation phase that is likely to last till early February. During this period, the market expert warns it is important for market bulls to avoid a price breakdown as DOGE could potentially fall as low as $0.26.  Dogecoin, with a market cap of $52.43 billion, holds the title of the largest memecoin and is the seventh-largest cryptocurrency globally. Featured image from Gadgets 360, chart from Tradingview

Your Crypto Gateway

Claim 1,000
Free WCG Coins

World Crypto Global opens the door to digital freedom for everyone.
Manage your free WCG Coins securely—where simplicity meets global accessibility.

11 bn

FREE CRYPTO COINS

8.9 bn

AVAILABLE FOR RESERVATION

2.1 bn+

ALREADY ALLOCATED

× WCG Coin

🎉 Get 1,000 WCG Coins

No fees. No catch. Your crypto journey starts here.