W o r l d . C r y p t o . G l o b a l

Loading

Welcome at World Crypto Global. This portal is packed with useful content and resources to built out your own crypto skills. WorldCrypto is a site member of Gabriel Vega Network.

Contact Info

CATEGORY: bullish sign


Is Chainlink (LINK) $12 Breakout Imminent? Data Reveals A Rising Open Interest

Author: Sebastian Villafuerte
United Kingdom
Sep 12, 2024 12:05

Is Chainlink (LINK) $12 Breakout Imminent? Data Reveals A Rising Open Interest

Chainlink is in a consolidation phase after weeks of volatility and selling pressure. The price currently holds above a support level of $10, a crucial liquidity level. The altcoin attracts the attention of analysts and investors who anticipate higher prices soon.  Related Reading: Solana (SOL) Surges Past $130 Resistance As Funding Rate Signals Bullish Momentum Data from Santiment reveals rising open interest, which signals sustained demand for Chainlink. As more traders and investors build positions, this increase in open interest suggests that a price rally could be on the horizon. This stabilization around the $10 mark has given some confidence to those who believe LINK may be poised for a breakout. Many analysts see this as a potential turning point for Chainlink, with its current price action reflecting growing optimism for future gains. If the consolidation holds and momentum builds, LINK could potentially push past its recent resistance and aim for higher levels. Chainlink Investors Showing Confidence  Chainlink is testing key supply at its current levels, and top traders and investors are confident in a potential rise for LINK in the coming weeks. One significant indicator signaling strength is the rising Open Interest (OI), as revealed by Santiment. OI tracks the number of active contracts tied to a cryptocurrency, serving as a reflection of market engagement. When OI increases, it signals growing liquidity and interest in the market, while a decrease in OI typically points to reduced exposure. From a price analysis perspective, a rise in OI combined with a price dip often confirms a continuing downtrend. On the other hand, if OI decreases while the price rises, it may signal a bearish reversal. In Chainlinks case, both OI and price are increasing, which suggests that the current uptrend could persist. As investors monitor the market, many are waiting for price confirmation above current levels to keep the momentum going and shift the overall negative sentiment that has clouded Chainlink in recent weeks. Related Reading: Cardano (ADA) Rally Brewing? On-Chain Metrics Suggest Investors Optimism LINKs breakout could fuel a bullish run, as traders expect a more bullish trajectory in the short term. The rising OI serves as a strong indicator that market participants are increasingly confident in LINK’s potential for further gains. LINK Price Testing Supply At $10.8 Chainlink (LINK) is trading at $10.40 after testing local resistance at $10.83, positioning for a potential breakout toward higher prices. The price is struggling to clear the 4-hour 200 moving average (MA) at $10.71, a key indicator that has acted as a resistance since late August. For bulls to maintain momentum, LINK must reclaim the 4H 200 MA and target the next resistance at $12.70. Breaking past this level would signal a reversal and could lead to a more sustained uptrend, offering investors hope for further gains. However, if LINK fails to break through the 4H 200 MA, the altcoin will likely face a pullback, with support anticipated at lower demand levels around $9.30. A failure to hold this support could result in even lower prices, reinforcing the downside risk for traders. Related Reading: Avalanche (AVAX) Ready To Target $28: Investors Expect A Reversal The coming days will be crucial for LINKs price trajectory as the battle between bulls and bears intensifies. Featured image from Dall-E, chart from TradingView

Aug 01, 2024 12:05

XRP Bullish Signal: Shark & Whale Population Sharply Growing

On-chain data shows the total number of sharks and whales on the XRP network has seen a sharp increase recently, a sign that could be bullish for the asset’s price. XRP Sharks & Whales Have Witnessed Their Count Go Up Recently According to data from the on-chain analytics firm Santiment, the shark and whale wallets have registered a notable jump over the past five weeks. The indicator of relevance here is the “Supply Distribution,” which tells us about the number of addresses that currently belong to a given wallet group. Related Reading: Dogecoin & Other Memecoins Seeing Less Interest Than Bitcoin: Data The addresses are put into these cohorts based on the number of coins that they are carrying in their balance right now. Investors who own between 1 and 10 XRP, for example, fall inside the 1 to 10 coins group. In the context of the current discussion, the 10,000+ coins group is of interest. The cutoff for this cohort converts to around $6,500 at the current exchange rate. This amount in itself isn’t high, but the upper range of the group stretches to infinity, so it should also include heavyweight investors like sharks and whales. The sharks and whales are considered key investors in the market, so their behavior can be to keep an eye on, as it may end up affecting the cryptocurrency’s price. Naturally, the whales are the more influential of the two, due to their larger size. Now, here is a chart that shows the trend in the XRP Supply Distribution for the 10,000+ coins cohort over the past few months: As displayed in the above graph, the XRP Supply Distribution for this wallet group has observed a rapid increase recently. More specifically, around 2,390 addresses of this size have popped up on the network in just the past five weeks. This would suggest that entities like the sharks and whales have been busy accumulating the cryptocurrency. Following the latest increase, the indicator’s value has reached the 279,400 mark, which is the highest that it has been in about six months. From the chart, it’s visible that the indicator’s value had been observing a downtrend earlier in the year, alongside which, the asset’s price had also been riding bearish momentum. The indicator reached a bottom in April, which is around when the asset’s drawdown also slowed down. And since the recent uptrend in the Supply Distribution of the sharks and whales has appeared, the XRP price has also felt the return of bullish winds. “The correlation between these wallets and XRP’s market value has been undeniable throughout 2024,” notes Santiment. Related Reading: Minimal Bitcoin On-Chain Resistance Ahead: Price Set For New ATH? Given the pattern, this indicator should be monitored in the near future, as a continued rise in it could spell a bullish outcome for the cryptocurrency. XRP Price XRP has enjoyed a rally of around 5% during the past 24 hours, which has taken its price to the $0.65 level. Featured image from Dall-E, Santiment.net, chart from TradingView.com

Jun 25, 2024 05:50

Bitcoin Forms Bullish Signal That Led To At Least 60% Jump Last 3 Times

Keshav is currently a senior writer at NewsBTC and has been attached to the website since June 14, 2021. Keshav has been writing for many years, first as a hobbyist and later as a freelancer. He has experience working in a variety of niches, even fiction at one point, but the cryptocurrency industry has been [...]

The post Bitcoin Forms Bullish Signal That Led To At Least 60% Jump Last 3 Times appeared first on Crypto Breaking News.

Ethereum Consolidates As Accumulation Trend Develops  New Bullish Phase Ahead?

Author: Sebastian Villafuerte
United Kingdom
May 07, 2025 12:05

Ethereum Consolidates As Accumulation Trend Develops New Bullish Phase Ahead?

Ethereum is under pressure after failing to break above the $1,874 high set on May 1st, a level that now acts as stiff resistance. As the broader crypto market begins to heat up, Ethereum remains stuck in a tight range, lacking the momentum to confirm a breakout. Currently trading just above $1,800, ETH sits at a critical level where bulls must step in to defend the structure and push the price higher. Related Reading: Avalanche Bounces Off Key Price Level: Top Indicator Flashes A Buy Signal Despite several attempts, Ethereum has been unable to establish a clear direction, and market participants are growing cautious. The asset is still down over 55% from its December highs, reflecting a prolonged period of weakness relative to other major cryptocurrencies. Without a strong push through resistance, Ethereum risks falling further behind. Top crypto investor Michael Van de Poppe recently shared a technical analysis suggesting that Ethereum is still in an accumulation phase. According to Van de Poppe, ETH shows signs of strength and accumulation against BTC in the background, but needs confirmation through a decisive breakout above current levels. Until then, Ethereum remains range-bound and vulnerable to volatility. With market sentiment shifting and major moves looming, the coming days will be crucial for ETHs short-term outlook. Ethereum Accumulation: ETH/BTC Chart Hints At Imminent Move Ethereum continues to struggle below the $2,000 mark, failing to reclaim key resistance levels despite broader market activity heating up. While ETH/USD remains directionless and still trades over 55% below its December highs, a closer look at the ETH/BTC chart reveals something more constructive brewing beneath the surface. Van de Poppe recently shared an analysis highlighting a clear accumulation structure forming in the ETH/BTC pair. After months of consistent downside, the chart shows Ethereum breaking out of a falling wedge and consolidating in a tight range just below critical resistance at 0.0195 BTC. According to Van de Poppe, this is a classic accumulation pattern, signaling that Ethereum may be preparing for a significant breakout relative to Bitcoin. The chart also highlights a key demand zone around 0.0184 BTCan area ETH has repeatedly held. As long as this level holds, Van de Poppe believes Ethereum could continue to grind higher and eventually take out liquidity above resistance. A successful breakout could mark the start of Ethereum outperforming Bitcoin, a trend often seen during the altcoin expansion phase of a bull market. However, risks remain. The broader market is still heavily influenced by macroeconomic uncertainty, particularly surrounding U.S.-China tensions. For now, Ethereums upside case depends on holding current support and clearing the 0.0195 BTC resistance. If successful, this accumulation may become the base for a strong rally. Related Reading: Ethereum Breaks Massive Downtrend Price Structure Momentum Shift? ETH Price Consolidates In A Tight Range Ethereum is currently trading at $1,795.79 after a slight rejection from the $1,874 local high reached on May 1st. The daily chart shows ETH consolidating in a tight range following its rebound from Aprils lows near $1,500. However, despite this stabilization, ETH remains well below both the 200-day simple moving average (SMA) at $2,709.54 and the 200-day exponential moving average (EMA) at $2,437.55indicating that the broader trend is still bearish. While bulls have managed to prevent further downside, Ethereum has yet to break out of its long-term downtrend. The failure to reclaim $2,000 as support continues to cap bullish momentum, and volume has remained modest during recent price action, showing a lack of conviction from both buyers and sellers. The structure currently favors accumulation, but ETH must decisively clear the $1,875$2,000 resistance area to shift sentiment and validate a trend reversal. If it fails to do so, the risk of a renewed pullback toward the $1,650$1,700 support zone increases. Related Reading: Cardano Consolidates In Symmetrical Triangle Analyst Sets Bull/Bear Price Targets Overall, Ethereum is at a pivotal stage. The longer it consolidates below major moving averages, the more likely the market remains cautious. A breakout above $2,000 could trigger renewed upside and signal broader market strength. Featured image from Dall-E, chart from TradingView

Will Filecoin Bounce? Key Indicator Points to Yes

Author: Paul Adedoyin
Estonia
May 05, 2025 02:35

Will Filecoin Bounce? Key Indicator Points to Yes

Filecoin (FIL) hovers at key support with a TD Sequential buy signal suggesting a potential rebound. But traders watch for confirmation

SEI Expected to Rise after it Completes an Inverse Head & Shoulders Pattern

Author: Paul Adedoyin
Estonia
May 20, 2025 02:30

SEI Expected to Rise after it Completes an Inverse Head & Shoulders Pattern

SEI has seen a bullish breakout occur for the first time since October and it remains above important support.

$35B Money Flows into Crypto Market in 3 Weeks: Bullish Signs?

Author: Paul Adedoyin
Estonia
May 15, 2025 02:30

$35B Money Flows into Crypto Market in 3 Weeks: Bullish Signs?

Over $35 billion entered the crypto market in just three weeks. This shows signs of bullish momentum.

XRP Network Activity Hits All-Time High Despite Market Volatility  Bullish Signal?

Author: Sebastian Villafuerte
United Kingdom
Apr 10, 2025 12:05

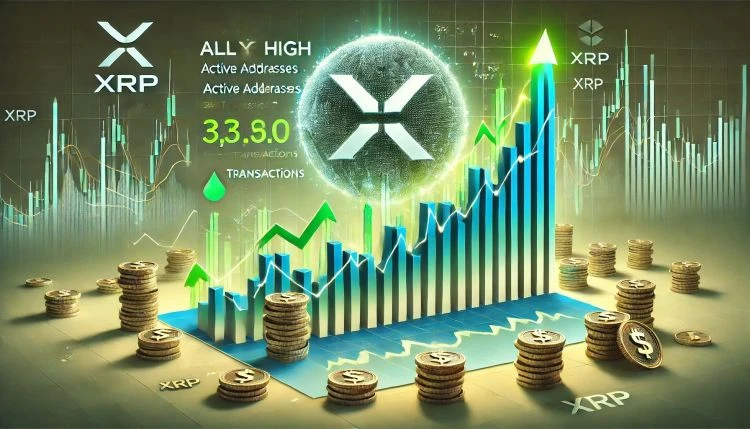
XRP Network Activity Hits All-Time High Despite Market Volatility Bullish Signal?

XRP has broken down from critical support levels, joining the broader crypto market in a wave of selling pressure driven by growing macroeconomic uncertainty. As risk sentiment weakens, bulls are struggling to defend key zones that previously held firm. Now, the focus shifts to reclaiming a pivotal level that could reverse the recent bearish trend and restore some confidence to investors. Related Reading: XRP Breaks Out Of Head-And-Shoulders Pattern Eyes Move Toward $1.30 Despite the harsh market conditions and price volatility, on-chain data reveals a promising development beneath the surface. According to Glassnode, the XRP network has reached a new all-time high of 6.26 million addresses holding 1 XRP or more. This metric signals growing adoption and distribution, even as prices slide a potential bullish divergence that often precedes long-term strength. The surge in small wallet growth suggests that retail investors are still entering the market, seeing value in XRP at current levels. While the short-term price action remains uncertain, the expanding network base may point to renewed demand once market conditions stabilize. Is this trend a sign of strength or simply a temporary reaction to lower prices? In a market full of fear, such network milestones could serve as a glimmer of optimism for XRPs long-term outlook. XRP Holds Below $2 As Analysts Split on What Comes Next XRP is now facing a critical test just below the $1.80 mark a level that many analysts view as the last key support before a potential steep decline. Market sentiment remains fragile, with bulls under immense pressure and bears steadily gaining ground. If XRP fails to hold this zone, some analysts warn that a sharp drop toward lower demand levels could follow, further weakening investor confidence. The atmosphere is tense and filled with uncertainty. Bulls argue that once broader market conditions begin to recover, XRP could be one of the first altcoins to rebound and reclaim its previous range highs. On the other hand, skeptics believe that XRPs trend has clearly broken down, and a return to bullish momentum could take longer than many anticipate if it happens at all. Despite the conflicting views on price action, on-chain data offers a glimmer of optimism. Top analyst Ali Martinez shared insights on X, revealing that the XRP network is quietly growing stronger. According to Glassnode, the number of wallets holding at least 1 XRP has reached an all-time high of 6.26 million. This surge in network participation could be a signal of long-term strength and resilience. If the broader market stabilizes, such steady growth in network fundamentals may give XRP the momentum it needs to mount a serious recovery. But for now, the $1.80 level remains the line in the sand and all eyes are on whether it holds or breaks. Related Reading: Oversold Altcoins Like Solana Flash Bullish Divergences Are Relief Bounces Coming? Price Struggles Below Key Averages as Selling Pressure Mounts XRP is currently trading at $1.82 after a sharp drop below the 200-day Exponential Moving Average (EMA) at $1.94 and the 200-day Simple Moving Average (MA) at $1.85. These technical levels were acting as key support during recent consolidation, but bulls failed to defend them, signaling growing weakness in the current trend. The breakdown began when XRP lost the $2 mark a psychological and technical level that had previously provided stability. Since then, bearish momentum has intensified, and buyers have struggled to regain control. With XRP now firmly below major moving averages, the risk of continued downside remains high. However, all is not lost. A decisive reclaim of the $1.95 level, ideally with strong volume and follow-through, could spark a recovery back above the $2 threshold. Such a move would likely restore short-term bullish sentiment and provide the foundation for a broader rebound. Related Reading: Ethereum Capitulation May Be Nearing End Will A Fed Pivot Spark A Recovery? On the flip side, losing the $1.80 support would be a major blow for bulls. If this level fails to hold, XRP could rapidly descend toward the $1.50 zone, where the next meaningful support lies. For now, traders are watching these levels closely as XRP battles to regain stability amid broader market turbulence. Featured image from Dall-E, chart from TradingView

Ethereum Analyst Sets $3,000 Target As Price Action Signals Momentum  Details

Author: Sebastian Villafuerte
United Kingdom
Apr 22, 2025 12:10

Ethereum Analyst Sets $3,000 Target As Price Action Signals Momentum Details

Ethereum and the broader crypto market experienced a small but notable pump yesterday, reigniting hopes of a potential trend reversal after weeks of sustained selling pressure. As market uncertainty intensifies, driven largely by global economic tensions and geopolitical strain between the US and China, investors are closely watching for signs of a breakout. Related Reading: Ethereum Enters Historic Buy Zone As Price Dips Below Key Level Insights Despite the headwinds, analysts are starting to shift their tone. Some believe that the worst may be behind for Ethereum and that a strong move to the upside could be brewing. One of the most vocal among them is top analyst Carl Runefelt, who shared a bold outlook, suggesting that Ethereum “might go absolutely parabolic starting from here. His analysis suggests that ETH is poised to break out from a daily descending trendline, which could serve as a key technical signal indicating va shift in momentum in favor of the bulls. As Ethereum holds above critical support levels and inches closer to a potential trend reversal, traders and investors are now watching closely for follow-through confirmation. If volume and sentiment continue to build, this could be the beginning of a significant rally one that may reset expectations for the rest of the cycle. Ethereum Eyes Recovery Amid Rising Global Tensions Global tensions and macroeconomic uncertainty continue to weigh heavily on investor sentiment, with the ongoing trade war between the US and China sending shockwaves through equities and high-risk assets. In the midst of this fragile backdrop, Ethereum has managed to find a solid support level around $1,500 and is now attempting to reclaim higher ground. After weeks of selling pressure that erased bullish expectations for the year, ETH is showing early signs of recovery. Ethereums current price structure has become a focal point for market participants. The recent bounce from $1,500 marks a potential higher low, a technical setup often associated with trend reversals. If ETH can successfully push above the $1,700 mark and break the descending trendline, it could spark renewed momentum for bulls. Runefelt shared an optimistic view, stating that Ethereum could go up really fast from here. According to his analysis, the next key price target sits at $3,000, assuming a confirmed breakout above short-term resistance levels. Despite continued global risks, the Ethereum network remains fundamentally strong, with growing adoption in DeFi and real-world assets. If the breakout materializes and broader market sentiment stabilizes, ETH could lead the next leg of the crypto recovery. Related Reading: Metrics Reveal Solana Sees Uptick In Whale Activity Accumulation Signal? Price Faces Key Resistance As Bulls Struggle for Momentum Ethereum is currently trading at $1,630 after another failed attempt to break above the $1,700$1,800 resistance zone. This price range has acted as a major barrier over the past several weeks, limiting bullish momentum and keeping ETH locked in a broader downtrend. Bulls must reclaim the local high at $1,691, set last week, to signal a potential shift in structure and confirm the start of a recovery rally. A decisive move above $1,700 could open the door to a test of the $2,000 level, which would mark a significant psychological and technical milestone. However, the lack of follow-through on recent upside attempts reflects ongoing uncertainty across crypto markets, largely driven by macroeconomic tensions and risk-off sentiment. Related Reading: Cardano Whales Offload 180 Million ADA In 5 Days Smart Profit-Taking? If Ethereum fails to gain strength above current levels, a retracement toward $1,500 is likely, with the possibility of further downside if selling pressure intensifies. This level has served as a critical support zone in recent weeks. Without a convincing breakout, ETH remains vulnerable to renewed weakness and deeper corrections. All eyes are now on whether bulls can build enough momentum to flip resistance into support and avoid another leg down. Featured image from Dall-E, chart from TradingView

Apr 18, 2025 02:30

Bitcoins TD Sequential Indicator Suggests a Strong Upward Move to $95K

Bitcoin (BTC) is showing bullish signs for an upward move and currently is in a positive price trajectory and holding strong above a crucial support level. BTC has faced extreme volatility recently, triggered by several macro factors, but it has regained its ground and is poised for the next leg up. Bitcoin has been trading […]

Ethereum Stays Below Realized Price: Once-In-A-Cycle Opportunity?

Author: Sebastian Villafuerte
United Kingdom
Apr 14, 2025 12:05

Ethereum Stays Below Realized Price: Once-In-A-Cycle Opportunity?

Ethereum surprised the market with a powerful bounce on Wednesday, surging more than 21% from its recent low of $1,380. The move came shortly after US President Donald Trump announced a 90-day pause on reciprocal tariffs for all countries except China, which now faces a 145% tariff. This development injected optimism into global markets, triggering a broad recovery across risk assets with ETH among the top beneficiaries. Related Reading: Dogecoin Whales Buy Over 80 Million DOGE In 24 Hours Sign Of Recovery? Despite the relief rally, Ethereum still trades below critical technical levels, and the broader price structure suggests ongoing consolidation rather than a confirmed reversal. Analysts remain cautious, as the assets inability to reclaim the $1,800$2,000 range keeps the long-term trend in question. However, on-chain data from CryptoQuant adds an intriguing layer to the current outlook. Ethereums price is still trading below its realized price the average price at which all ETH in circulation last moved. Historically, this scenario has represented a high-probability accumulation zone, often appearing once per cycle. According to some analysts, this could present a rare buying opportunity for contrarian investors willing to look beyond short-term volatility and macro uncertainty. As Ethereum continues to consolidate, all eyes are on whether bulls can build on this momentum. Ethereum Faces Critical Test Amid Volatility And Trade Tensions Ethereum is at a pivotal point after enduring weeks of relentless selling pressure and extreme volatility. The broader market has been shaken by macroeconomic uncertainty and escalating global trade tensions, with US tariffs under Trump’s administration continuing to rattle investor confidence. The crypto market, particularly altcoins like Ethereum, has taken the brunt of this instability. ETH has lost over 60% of its value since late December, raising fears of a prolonged bear market. However, a shift may be unfolding. Bulls are beginning to reappear, with Ethereum bouncing and setting a strong support above $1,400. This recovery follows aggressive price swings not only in crypto but also in global equities, which have seen significant rebounds following the announcement of a 90-day pause on reciprocal tariffs for all countries except China. Still, Ethereum remains below crucial resistance levels, especially the $2,000 mark a level that represents more than just a psychological barrier. According to top analyst Quinten Francois, ETH is currently trading under its realized price, which averages the cost basis of all coins in circulation. Historically, such conditions have presented rare buying opportunities. Francois suggests this might be a once-in-a-cycle or even once-in-a-lifetime chance for long-term investors to accumulate ETH at undervalued levels. The coming days will determine whether bulls can reclaim key resistance and shift sentiment toward a sustained recovery. Related Reading: Solana Approaches $125 Will 2-Level Filter Trigger A Long Signal? Price Action Details: Key Levels To Reclaim Ethereum is currently trading at $1,650 after failing to break above the $1,700 level, a psychological and technical barrier that continues to cap bullish momentum. Despite a sharp rebound earlier in the week, ETH remains stuck in a consolidation range and is struggling to find direction amid broader market uncertainty. For bulls to regain control and initiate a stronger recovery, Ethereum must push above the $1,850 mark a level aligned with the 4-hour 200-day moving average (MA) and exponential moving average (EMA). These indicators have acted as short-term resistance since ETH fell below the $2,000 mark in February and reclaiming them is critical for confirming a shift in trend. Related Reading: Bitcoin Long-Term Holders Show Conviction: 63% Of Supply Hasnt Moved In A Year However, if Ethereum fails to break above $1,750 in the coming days, downside risk increases significantly. A rejection at current levels could trigger another wave of selling, potentially sending the price below the $1,500 support zone. This would put further pressure on bulls and undermine recent gains. With market sentiment still fragile and macroeconomic uncertainty weighing on investor confidence, Ethereum remains at a crucial juncture where a decisive move above resistance is needed to shift the outlook from bearish to neutral. Featured image from Dall-E, chart from TradingView

IOTA Price Surge Imminent? Rare Bullish Signal Appears Before Rebase Launch

Author: Paul Adedoyin
Estonia
Apr 14, 2025 02:30

IOTA Price Surge Imminent? Rare Bullish Signal Appears Before Rebase Launch

IOTA forms a bullish wedge as Rebased upgrade nears, promising 15% staking yields, faster TPS, and strong price momentum.

Ethereum Breaks Out Of Descending Triangle Pattern  Fakeout Or Recovery Rally?

Author: Sebastian Villafuerte
United Kingdom
Mar 10, 2025 12:05

Ethereum Breaks Out Of Descending Triangle Pattern Fakeout Or Recovery Rally?

Ethereum (ETH) has been struggling around the $2,200 level, with bulls unable to reclaim higher prices despite multiple attempts. The market sentiment remains bearish, as ETH continues to face selling pressure even after Thursdays announcement of the US Strategic Bitcoin Reserve, which many had expected to boost overall confidence in the crypto sector. Related Reading: 330,000 Ethereum Withdrawn From Exchanges In 72 Hours Supply Squeeze Incoming? As ETH hovers near critical demand levels, analysts believe that the next week will be crucial in determining its short-term direction. If bulls can defend key support zones, Ethereum may have a chance to regain momentum. However, failure to hold these levels could lead to further downside pressure. Top analyst Carl Runefelt shared a technical analysis on X, highlighting that Ethereum is breaking out of a pattern that often signals a potential breakout. If ETH follows this setup, it could push into higher resistance zones and reclaim key price levels above $2,500. However, confirmation of this breakout is needed, as market volatility remains high. Ethereum Bulls Hope For A Recovery Ethereum has suffered a steep decline, losing over 50% of its value since late December, triggering fear and panic selling across the market. Once a leader in previous bull cycles, ETH is now struggling to regain momentum, leading many analysts to question whether the long-awaited altseason will happen this year. With Ethereum and most altcoins unable to reclaim bullish structures, the market remains under bearish control, keeping investors cautious. Despite the negative sentiment, there is still hope for a recovery as Ethereum approaches key technical levels that could determine its next move. Runefelt’s remarks reveal that ETH is breaking above a descending triangle pattern, a setup that often signals a trend reversal. However, confirmation is crucial, as many past breakouts have turned into fakeouts, trapping traders in further downside moves. For Ethereum to solidify a bullish breakout, it must push above and close above $2,300. This level is a key resistance zone, and flipping it into support would indicate renewed buying strength, potentially opening the door for a push toward $2,500 and higher price targets. Related Reading: Solana Consolidates In A Wide Range Big Move On The Horizon? Until this confirmation happens, Ethereum remains at risk of further declines if sellers regain control. Traders and investors are closely watching whether ETH can maintain its breakout attempt or if it will face another rejection, extending its bearish trend into the coming weeks. ETH Key Levels To Watch Ethereum is currently trading above the $2,000 support level, a crucial last line of defense for bulls hoping to see strong performance this year. Holding this level is essential, as a breakdown below $2,000 could trigger further downside, reinforcing bearish sentiment in the market. Despite this, bulls have struggled to reclaim higher prices, leaving investors frustrated with ETHs lack of momentum. Recent price action has been choppy and indecisive, with each attempt at a breakout quickly met with selling pressure. This has kept ETH stuck in a tight range, preventing a clear shift in market sentiment. Related Reading: Litecoin Holds Bullish Outlook As the MVRV Ratio Signals Strength Analyst However, a decisive reclaim of $2,300 could mark a turning point. If ETH pushes above and holds this level, it would likely open the door for a move toward $2,500, strengthening the case for a recovery rally. Until then, traders remain cautious, as Ethereums struggle to gain traction continues to weigh on the broader altcoin market. Featured image from Dall-E, chart from TradingView

Litecoin Holds Bullish Outlook As the MVRV Ratio Signals Strength  Analyst

Author: Sebastian Villafuerte
United Kingdom
Mar 08, 2025 12:05

Litecoin Holds Bullish Outlook As the MVRV Ratio Signals Strength Analyst

Litecoin (LTC) has shown resilience amid market uncertainty and selling pressure, holding its ground despite the broader downtrend in cryptocurrencies. After retracing from $130 to the $100 mark, LTC has successfully held this crucial support, signaling that bulls are still active in defending key levels. Related Reading: BTC Could Gain Momentum For A Move To $150,000 If Bulls Reclaim This Level Details While most altcoins have struggled, Litecoin appears to maintain a slight bullish edge. According to Santiment data, LTC continues to show strength in its on-chain metrics, with the Market Value to Realized Value (MVRV) Ratio signaling a bullish outlook. This suggests that investors are still holding onto their LTC, with less incentive to sell at current levels, potentially paving the way for a recovery in the near future. However, the coming days will be critical for Litecoin, as Bitcoin remains under pressure, struggling below key levels. Market uncertainty continues to drive volatility, and if BTC experiences further downside, LTC could face increased selling pressure. On the other hand, if Bitcoin stabilizes or pushes higher, Litecoin could quickly capitalize on its strong fundamentals and begin a renewed upward trend. Litecoin Bulls Defend Crucial Demand Litecoin is currently trading between key liquidity levels, navigating months of volatility and uncertainty in the broader market. Despite the recent market downturn, LTC has shown relative strength over the past few weeks, managing to hold crucial support levels while other altcoins continue to struggle. Related Reading: Dogecoin Indicator Flashes A Buy Signal On The 4-Day Chart Is DOGE Gearing Up For A Rebound? However, price action remains uncertain, as Litecoin has been unable to break above key supply zones. Bulls have attempted to push the price higher, but selling pressure at resistance levels has kept LTC within a tight trading range. Until a clear breakout occurs, traders remain cautious about the next major move. Top analyst Ali Martinez shared insights on X, highlighting that Litecoin maintains a bullish outlook based on on-chain data. According to Santiments MVRV Ratio, LTC is showing strength, suggesting that investors are holding onto their positions despite the markets recent volatility. This metric often indicates whether an asset is undervalued or overvalued, and in Litecoins case, it signals that the coin still has strong upside potential. If the broader crypto market starts to recover, Litecoin could emerge as one of the strongest assets, given its relative stability and bullish on-chain signals. For now, all eyes remain on LTCs ability to hold key support levels and whether bulls can break past resistance to confirm a new uptrend. LTC Price Action: Technical Levels To Watch Litecoin is currently trading at $104 after facing days of selling pressure. However, despite the bearish sentiment, sellers have struggled to push LTC below the crucial $100 demand zone. This level has acted as strong support, preventing further downside, and every day that LTC holds above this mark increases the probability of a recovery move. For bulls to regain control, Litecoin needs to reclaim the $115 level soon. A decisive break above this resistance could trigger renewed buying momentum, paving the way for a push into higher price levels around $130-$145. These areas represent the next major liquidity zones, where LTC could face strong resistance but also attract significant bullish interest. Related Reading: 2.23 Million Chainlink Moved To Exchanges In Two Weeks Selling Pressure Incoming? If Litecoin continues to hold above $100, it would indicate buying confidence at lower levels, setting the stage for a potential breakout. However, failure to reclaim $115 in the short term could keep LTC in a prolonged consolidation phase, leaving its next major move uncertain. Featured image from Dall-E, chart from TradingView

Dogecoin Indicator Flashes A Buy Signal On The 4-Day Chart  Is DOGE Gearing Up For A Rebound?

Author: Sebastian Villafuerte
United Kingdom
Mar 07, 2025 12:05

Dogecoin Indicator Flashes A Buy Signal On The 4-Day Chart Is DOGE Gearing Up For A Rebound?

Dogecoin (DOGE) is currently trading below the $0.25 level after experiencing massive volatility and price swings in recent days. As the crypto market faces a broad correction, meme coins, including DOGE, have been some of the most affected assets, with bulls struggling to regain momentum. Related Reading: Whales Bought 420 Million Cardano After Trumps U.S. Strategic Crypto Reserve Announcement Insights Despite multiple attempts to push higher, DOGE has remained under pressure, failing to reclaim key resistance levels. Investors are closely watching whether bulls can regain control or if further downside is ahead. The uncertainty has left traders cautious, with many waiting for a strong signal of recovery before re-entering the market. Crypto analyst, Ali Martinez, shared insights on X, revealing that Dogecoin may be gearing up for a rebound. According to his analysis, the TD Sequential indicator has flashed a buy signal on a high time frame, suggesting that DOGE could be nearing a potential reversal. If bulls step in at current levels and capitalize on this setup, DOGE could see a strong recovery in the coming days. Is Dogecoin Preparing For A Recovery Rally? Dogecoin has been at its lowest since late 2024 as bullish sentiment fades, following a 60% decline from its multi-year high of $0.48. The correction has been brutal, with meme coins bleeding the most amid broader market weakness. DOGE now struggles to reclaim crucial liquidity levels, making it difficult to start a recovery rally. Market participants are closely watching for a decisive move, as analysts and investors remain on the sidelines, waiting for confirmation of either a break above crucial supply or a breakdown below current demand levels. Until a clear trend is established, uncertainty dominates DOGEs price action. Despite the bearish outlook, Martinez’s insights suggest Dogecoin may be gearing up for a rebound. According to his analysis, the TD Sequential indicator has flashed a buy signal on the 4-day chart, which could indicate that selling exhaustion is near. The TD Sequential is a well-regarded technical analysis tool that helps traders identify trend exhaustion and potential price reversals. On higher time frames, this indicator has historically been very effective, meaning this could present a major buying opportunity if DOGE follows its typical pattern. Related Reading: 2.23 Million Chainlink Moved To Exchanges In Two Weeks Selling Pressure Incoming? As market sentiment remains mixed, traders are keeping a close eye on DOGEs next major move. If buyers step in and confirm the TD Sequentials buy signal, Dogecoin could see a strong recovery in the coming days. However, failure to reclaim key levels may lead to further downside pressure, delaying any meaningful rebound. DOGE Holding Crucial Demand Dogecoin is currently trading at $0.209 after a period of volatile price swings, briefly dipping below $0.20 before recovering above $0.22. The market remains uncertain, with bulls attempting to regain control after weeks of selling pressure. For DOGE to confirm a strong recovery, bulls must reclaim the $0.25 level and establish it as a solid support zone. This would open the door for a push above the 200-day Moving Average (MA) and Exponential Moving Average (EMA), key resistance levels that could trigger a breakout to higher price targets. If DOGE successfully clears these technical barriers, momentum could shift in favor of buyers, leading to a more sustained uptrend. Related Reading: Ethereum Breaks Below Parallel Channel Is ETH Collapsing To $1,250? However, losing the $0.20 level again would be a bearish signal as it would indicate a lack of strong demand at current prices. If this scenario plays out, DOGE could drop further into lower demand levels around $0.14, a price zone that previously acted as a major accumulation area. Featured image from Dall-E, chart from TradingView

Dogecoin Will Start A Move To $4 If Current Demand Holds  Can Bulls Step In?

Author: Sebastian Villafuerte
United Kingdom
Mar 03, 2025 12:05

Dogecoin Will Start A Move To $4 If Current Demand Holds Can Bulls Step In?

Dogecoin is trading below key liquidity levels as the price struggles with intense selling pressure. The entire meme coin market has seen massive liquidity outflows, with fear and uncertainty dominating investor sentiment. Speculative assets like DOGE have been hit the hardest, leading to a sharp price decline of over 35% since mid-February. With negative momentum still driving the market, some analysts speculate that this trend could continue, possibly pushing DOGE to even lower levels. Related Reading: Whales Add 190,000 Ethereum In The Last 24 Hours The Accumulation Continues However, not all analysts are bearish on Dogecoins future. Analyst Ali Martinez shared a long-term technical analysis suggesting that despite recent struggles, DOGE is still positioned for a potential rally. According to Martinez, if Dogecoin holds above the $0.16 to $0.19 support, the path remains open for a potential move to $4 in the coming months. This support zone has historically been a critical accumulation area, and if buyers step in, Dogecoin could be set for an aggressive rebound. With the meme coin market at a crossroads, Dogecoin remains a key asset to watch. Whether it continues to drop or reclaims strength will depend on how this crucial support level holds in the coming weeks. Dogecoin Prepares For A Macro Move Dogecoin is trading below the $0.25 mark, a key price level that will determine short-term direction. The meme coin market continues to bleed, with speculative assets facing the worst selling pressure. Dogecoin, the leader of this sector, has dropped 46% since late January, struggling to regain momentum as the market remains fearful. Analysts warn that a further downside is possible unless buyers step in to defend key support. Martinezs analysis highlights a crucial long-term perspective for Dogecoin. He notes that if DOGE holds above the $0.16 to $0.19 support, the path remains open for a potential move to $4. This would represent a 1,700% price increase, making DOGE one of the most explosive assets in the market. However, Martinez emphasizes that this move will take time, and even if DOGE holds these levels, it doesn’t guarantee an immediate rally. Related Reading: Ethereum Retraces To Critical Monthly Demand Level Can ETH Hold Selling Pressure? In the short term, DOGE must reclaim the $0.25 level to break the bearish trend and confirm a potential reversal. If selling pressure continues, a drop below $0.16 could lead to further declines and invalidate the bullish outlook. For now, all eyes are on whether this crucial support level holds, as it could set the foundation for Dogecoins next major move. DOGE Price Action Details: Key Levels To Watch Dogecoin (DOGE) is trading at $0.20 after days of struggling to reclaim the $0.21$0.22 resistance zone. Bulls have failed multiple attempts to push the price higher, and now bears remain in control as selling pressure continues to weigh on the price. With weak momentum in the broader crypto market and meme coins facing heavy liquidity outflows, DOGE is at risk of further downside. If DOGE fails to hold above current levels, the next major support sits at $0.17, a level where buyers could attempt to defend the price. Losing this mark could lead to another leg down, confirming a prolonged correction. On the other hand, a strong bounce and reclaim of the $0.25 level would indicate that bulls have regained control and could trigger a massive recovery. Related Reading: Is Solana In A Macro Trend Move? Charts Show Potential Shift For now, DOGE must break above the $0.22 level and flip it into support to build momentum for a potential rally. If buyers step in and push the price above $0.25, it would confirm a trend reversal and open the path for higher targets. However, with bears still leading the market, the risk of a deeper drop remains high, making the coming days crucial for DOGEs price action. Featured image from Dall-E, chart from TradingView
130,000 Ethereum Moved Off Exchanges  Bullish Signal?

Author: Sebastian Villafuerte
United Kingdom
Mar 18, 2025 12:10

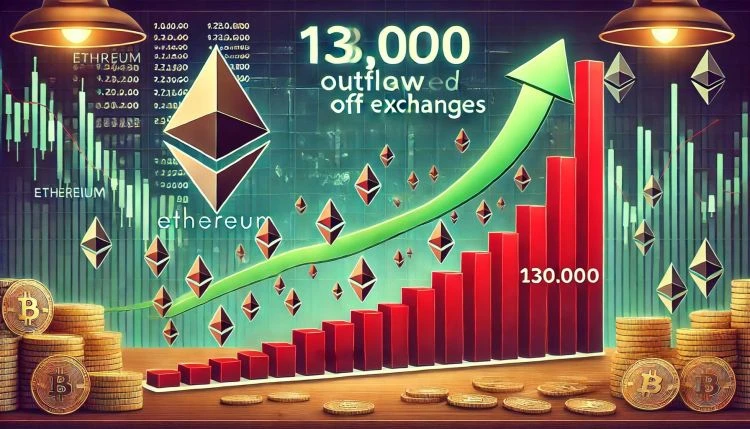
130,000 Ethereum Moved Off Exchanges Bullish Signal?

Ethereum (ETH) is trading at its lowest levels since late 2023, struggling to regain momentum after an extended period of selling pressure. Since December 2024, ETH has lost over 57% of its value, failing to reclaim key resistance levels. With the broader crypto market facing macroeconomic uncertainty and persistent volatility, Ethereum’s downtrend appears far from over. Related Reading: 640,000 Chainlink (LINK) Withdrawn From Exchanges In 24 Hours Bullish Accumulation? Despite the ongoing decline, on-chain data suggests that large investors may be positioning for a recovery. According to CryptoQuant, whales have moved over 130,000 ETH off exchanges in the past week, signaling a growing accumulation trend. This pattern has been developing since Ethereum started trending downward, suggesting that institutional players and long-term holders are buying the dip in anticipation of future price appreciation. While short-term sentiment remains bearish, historical data shows that large whale accumulations often precede strong rebounds once selling pressure fades. However, ETH still faces significant resistance, and bulls must reclaim key levels to confirm a potential trend reversal. With market uncertainty still looming, the next few weeks will be critical in determining Ethereums next major move. Ethereum Whale Activity Hints At Optimism Ethereum has been under massive selling pressure, struggling amid macroeconomic uncertainty and trade war fears that have shaken both the crypto market and the U.S. stock market. ETH is now trading below a multi-year support level, which could act as a strong resistance in the coming weeks. If bulls fail to reclaim key price levels, the stage could be set for a deeper correction. However, not all indicators are bearish. Despite the ongoing downtrend, some analysts remain optimistic about Ethereums long-term prospects. Top analyst Ali Martinez shared insights on X, revealing that whales have moved over 130,000 ETH off exchanges in the past week. This is significant because large investors typically move their holdings off exchanges when they plan to hold for the long term rather than selling. When whales transfer ETH into private wallets, it often signals accumulation rather than immediate selling pressure. Historically, such trends have preceded market rebounds, as reduced exchange supply can contribute to price stability and future upside potential. Related Reading: Whales Accumulate Over 150 Million XRP In Just 48 Hours Is A Rally Incoming? While Ethereum still faces major hurdles, whale activity suggests that smart money is positioning itself for the next move. The next few weeks will be crucial in determining whether ETH can reverse its downward trend or if further declines are ahead. Bulls Fight to Hold Key Levels Ethereum is currently trading at $1,904, struggling to regain momentum after days of consolidation below the $2,000 mark. The ongoing selling pressure has kept ETH under key resistance, making it difficult for bulls to reverse the trend and start a recovery. For Ethereum to regain a bullish outlook, bulls must reclaim the $2,000 level as soon as possible. A sustained push above this resistance would signal strength and could set the stage for a rally toward higher levels, potentially testing $2,250$2,400 in the coming weeks. However, if ETH loses current levels of demand, the next major liquidity zone sits around $1,600. A breakdown below $1,750 could trigger further sell-offs, leading to an extended bearish phase that could delay any potential recovery. Related Reading: Cardano Is About To Break Free Breakout Above Crucial Supply To Trigger A Big MoveAnalyst With whale accumulation increasing and on-chain data suggesting reduced exchange supply, some analysts believe Ethereum could soon attempt a breakout. However, macroeconomic conditions and overall market sentiment remain critical factors in determining ETHs short-term trajectory. Bulls will need strong buying pressure to reclaim lost ground and avoid a deeper decline. Featured image from Dall-E, chart from TradingView

640,000 Chainlink (LINK) Withdrawn From Exchanges In 24 Hours  Bullish Accumulation?

Author: Sebastian Villafuerte
United Kingdom
Mar 17, 2025 12:10

640,000 Chainlink (LINK) Withdrawn From Exchanges In 24 Hours Bullish Accumulation?

Chainlink (LINK) is currently trading below crucial resistance levels, which could trigger a strong rally if bulls manage to reclaim them. However, volatility and uncertainty have dominated the market since the start of the month, keeping LINKs price action unstable. Related Reading: Cardano Is About To Break Free Breakout Above Crucial Supply To Trigger A Big MoveAnalyst The token has seen wild price swings, moving from $17 down to $13, briefly rebounding to $16, and then collapsing to a low of $11.8. Bulls are now fighting to push LINK back above the $15 mark, but momentum remains weak, and the market appears to be consolidating around current levels. Despite this uncertainty, on-chain data is showing promising signs. Metrics from Santiment reveal that 640,000 LINK were pulled off exchanges in the last 24 hours, which is typically a bullish signal. Large withdrawals from exchanges often indicate long-term accumulation, as investors move their holdings into private wallets instead of keeping them available for immediate selling. With exchange outflows rising, traders are watching closely to see if LINK can break through resistance levels and confirm a shift toward bullish momentum. The next few trading sessions will be key in determining whether LINK can recover or if further consolidation is ahead. Uncertainty Looms As Investors Watch For A Breakout Chainlink is currently holding above the $13.5 mark, struggling to reclaim higher levels as selling pressure and market uncertainty persist. Despite its recent recovery attempts, LINK remains stuck below key resistance, making investors cautious about its short-term direction. Analysts and traders are concerned about a potential drop below the current range, as on-chain metrics suggest a distribution phase may be unfolding. If LINK fails to hold its support zone, it could see renewed selling pressure, sending the price toward lower demand levels. However, not all signals are bearish. Crypto expert Ali Martinez shared Santiment data on X, revealing that 640,000 LINK were pulled off exchanges in the last 24 hours. This is often seen as a bullish indicator, as large investors typically withdraw their holdings from exchanges when they anticipate higher prices in the future. When whales and long-term holders accumulate, it reduces selling pressure on the market and strengthens price stability. If LINK manages to break key resistance levels, this accumulation trend could set the stage for a strong recovery rally. Related Reading: Ethereum Must Reclaim $2,050 To Start A Recovery Rally Insights For now, bulls must defend the $13.5 support and push LINK above the $15 mark to confirm a bullish trend reversal. The next few days will be critical as investors watch for a breakout or further downside movement. Chainlink Bulls Defend Key Support Levels Chainlink (LINK) is currently trading at $14, facing resistance at the $15 level as bulls struggle to reclaim higher ground. The market remains under pressure, and LINK must hold current levels to avoid a deeper correction. For a recovery rally to take shape, bulls need to defend the $13 support zone and build momentum toward a breakout above $15. If LINK successfully pushes past this resistance, the next major target is the $17 level, where it must reclaim the 200-day moving average (MA) and the exponential moving average (EMA) to confirm a bullish trend reversal. However, if LINK fails to hold its current support levels, selling pressure could intensify, driving the price toward the $10 range or even lower levels. This would put LINK in a deeper downtrend, making a short-term recovery more difficult. Related Reading: Solana Forms Classic Cup-And-Handle Pattern Analyst Predicts A Breakout To $3,800 With market conditions still uncertain, the next few trading sessions will be crucial in determining whether LINK can stabilize and recover or face further downside risks. Bulls must step in soon to regain control and push prices back into an uptrend. Featured image from Dall-E, chart from TradingView
Jun 26, 2023 02:10

Bitcoin Bullish Signal: Exchange Whale Ratio Plunges

On-chain data shows that the Bitcoin exchange whale ratio has taken a plunge recently. Here’s why this may be bullish for the asset’s price. Bitcoin Exchange Whale Ratio Has Registered A Sharp Decline Recently As pointed out by an analyst in a CryptoQuant post, the selling pressure in the market may be diminishing right now. [...]

The post Bitcoin Bullish Signal: Exchange Whale Ratio Plunges appeared first on Crypto Breaking News.

Mar 23, 2023 10:30

Ethereum Bullish Signal: $560M In ETH Exits Exchanges

On-chain data shows a large amount of Ethereum has left exchange wallets within the past two days, a sign that could be bullish for the price. Ethereum Supply On Exchanges Has Plunged In The Last 48 Hours As an analyst on Twitter pointed out, about 310,000 ETH has exited exchanges in the past 48 hours. [...]

The post Ethereum Bullish Signal: $560M In ETH Exits Exchanges appeared first on Crypto Breaking News.

Your Crypto Gateway

Claim 1,000
Free WCG Coins

World Crypto Global opens the door to digital freedom for everyone.
Manage your free WCG Coins securely—where simplicity meets global accessibility.

11 bn

FREE CRYPTO COINS

8.9 bn

AVAILABLE FOR RESERVATION

2.1 bn+

ALREADY ALLOCATED

× WCG Coin

🎉 Get 1,000 WCG Coins

No fees. No catch. Your crypto journey starts here.