W o r l d . C r y p t o . G l o b a l

Loading

Welcome at World Crypto Global. This portal is packed with useful content and resources to built out your own crypto skills. WorldCrypto is a site member of Gabriel Vega Network.

Contact Info

CATEGORY: burak kesmeci


Apr 14, 2025 12:05

Bitcoin Price Climbs Above $85,000 As Open Interest Surges 16% In Past Day

The Bitcoin price action this weekend has been quite bubbly and impressive, with the premier cryptocurrency reclaiming the $85,000 level on Saturday, April 12. This burst of bullish momentum came after United States President Donald Trumps exemption of smartphones, computers, and chips from the new trade tariffs. According to the latest on-chain data, the Bitcoin open interest (OI) has also enjoyed a similar level of resurgence in the past day. The Bitcoin price could be gearing up for an extended upward run, especially with the open interest metric on the rise. How The Latest Spike In Open Interest Could Affect The Market In a Quicktake post on the CryptoQuant platform, analyst Burak Kesmeci revealed that the Bitcoin open interest has seen a notable upswing in the past 24 hours on the worlds largest exchange by trading volume, Binance. The open interest metric measures the total amount of capital flowing into BTC derivatives at a given time. Related Reading: Fartcoin Dominates Crypto Recovery With 230% Surge, Is This A Good Time To Buy? An increase in the open interest usually indicates that Bitcoin traders are taking up new positions in the futures and options market. On the other hand, when the OI metric is declining, it means that BTC investors are exiting the derivatives market or their positions are getting liquidated. Data from CryptoQuant shows that Bitcoins open interest on Binance has increased by a strong 15.8% in the past 24 hours. This surge saw about $1.2 billion flow into derivatives in a single day, growing the OI on the worlds largest exchange from $7.6 billion to $8.8 billion.   Kesmeci highlighted that this rapid rise in Bitcoins open interest suggests a substantial build-up of leverage positions within a short period. The Quicktake analyst noted that Binance now accounts for 31.4% of the market, with a total futures OI of around $28 billion. Kesmeci added: Binance isnt just reflecting the market trend its actively leading it.  The analyst also revealed that such a significant spike in open interest signals heightened activity and increased market volatility, which could lead to sharp liquidations of both long and short positions. Hence, investors might want to exercise caution when opening short-term positions. Bitcoin Price At A Glance As of this writing, the price of BTC stands at around $85,240, reflecting a 2.5% increase in the past 24 hours. According to data from CoinGecko, the flagship cryptocurrency is up by over 2% on the weekly timeframe. Related Reading: Ethereum Price Suffers 77% Crash Against Bitcoin, On-Chain Deep Dive Reveals Reasons Why Featured image from iStock, chart from TradingView

Apr 13, 2025 12:05

Bitcoin Long-Term Holders Are Buying Again Can They Push BTC Price Higher?

After a dreadful start to the week, the price of Bitcoin appears to be recovering nicely with a strong rally to begin the weekend. The latest on-chain data shows that a specific class of investors might be behind the relative stability experienced by the premier cryptocurrency amidst the recent macroeconomic chaos. Seasoned Investors Are Loading Their Bags Again  In an April 11 post on X, crypto analyst Burak Kesmeci revealed that the Bitcoin long-term holders (LTHs) might be getting more active in the market over the past few weeks. This on-chain observation is based on changes in the Long-Term Holder Net Position Change (30-day sum), a metric that tracks the net change in the BTC supply held by LTHs over a 30-day period. Related Reading: Ethereum Nears Critical Zone Historically Linked To Market Bottoms Is A Rebound Incoming? This metric basically tracks the aggregated behavior of an important investor cohort, providing an insight into the overall sentiment in the market. When this metric is positive, it implies that the long-term holders are in the accumulation phase. On the flip side, when the net position change is negative, it means that Bitcoin LTHs are trimming their holdings and selling their BTC. According to Kesmeci, the long-term investors have been offloading their Bitcoin in the past six months, as the LTH Net Position Change has remained in the negative zone since the last week of October 2024. The metric reached a negative peak level of 827,750 BTC on December 5, 2025, accompanied by a 32% decline in the Bitcoin price. The chart above shows that the Long-Term Holder Net Position Change shifted to the positive territory on April 6, 2024, and appears to be on the rise at the moment. This positive change signals fresh buying amongst the seasoned investors over the past few weeks. Kesmeci noted that the positive shift of the Long-Term Holder Net Position Change has coincided with a recent 12% jump in the Bitcoin price. The Bitcoin price returned above $81,000 after United States President Donald Trump paused trade tariffs on imports from all countries except China. Kesmeci added in the post: Time will tell whether this is just a reactionary bounce or the early stages of a longer bullish phase. However, the metric continuing to remain in the positive region with acceleration could be an important “trend change signal” for us. Nevertheless, the on-chain analyst urged investors to approach the market with caution, as the current momentum is not sufficient. Hence, further conviction is needed from the long-term investors to sustain a major rally in the current market state. Bitcoin Price Overview As of this writing, the premier cryptocurrency is valued at around $83,400, reflecting an almost 5% increase in the past 24 hours. According to data from CoinGecko, BTC has barely changed in the past seven days. However, this record doesnt quite tell the full story, as the Bitcoin price had fallen to around $74,000 at the beginning of the week.  Related Reading: Kaiko Report Highlights Key Drivers of Q1 Crypto Market Decline and Outlook for Q2 Featured image from iStock, chart from TradingView

Dec 22, 2024 12:05

Toncoin Price Heat Map Reveals $20 Target Analyst

Prominent altcoin Toncoin (TON) was not left out of the widespread crypto decline in the last week. According to data from CoinMarketCap, the price of Toncoin dipped by 14.71% over the past seven days falling from a consolidation range between $6.2-$6.5. However, this market downturn does not deter market experts bullishness on TON especially with the altseason yet to go into full effect. Related Reading: Toncoins 90-Day Returns Turn Positive: Is A Massive Rally On The Horizon? Toncoin To Gain At Least 280% In Altseason, Analyst Says In a recent X post, popular crypto analyst Burak Kesmeci revealed multiple price targets for Toncoin in the current altcoin bull run/altseason, a period where altcoins generally outperform Bitcoin in price appreciation indicated by a decline in Bitcoins market dominance.  Firstly, the analyst notes that Toncoins 365-day moving average currently at $5.14 has historically represented a region where price activity significantly slows down. Notably, Toncoin has only experienced a prolonged price dip below this level in a bear market. However, with the crypto market in a bull cycle, Kesmeci postulates that a one-year SMA could represent the potential local bottom for TON.  Therefore, using this price point with multiple levels of standard deviation (), the analyst predicts possible price targets of Toncoin that are statistically compared to historical data.  From the chart below, Toncoin is expected to hit an initial price of $8.74 as the altseason takes off based on the price level revealed by the one-year SMA + 2. This indicates a potential 60.6% gain on the altcoins current market price. Thereafter, a higher price band of one-year SMA + 6 indicates a price target of $15.93. The final price goal for Toncoin by Burak Kesmeci is based on the one-year SMA + 8 and set at $19.53. Going by this prediction, the crypto analyst states that Toncoin could have gained by 280% in the first phase of the altseason. However, investors should note that price targets are likely to change with moving prices as the projection is based on the simple moving average. Related Reading: Altcoins Set For $627 Billion Inflow As Altseason Prepares For Takeoff What Now For Toncoin? Following the crypto market decline this week, Toncoin found a local price bottom at $4.71 and is currently undergoing a modest price recovery as it hovers around the $5.40 price zone. In attaining any of Kesmeci’s price predictions, the altcoin will need to break past a minor resistance at the $6.5 price region and also overcome a major price opposition at $7.0. In other developments, Toncoins daily trading volume has grown by 3.61% attaining a value of $619.19 million. With a market cap of $13.91 billion, the digital asset remains the ninth-largest cryptocurrency in the market. Featured image from Yellow Card Academy, chart from Tradingvew

Nov 10, 2024 12:05

Ethereum Funding Rates Hit Key Bullish Level Price Surge Ahead?

Following Donald Trumps victory in the US presidential election on November 5, Ethereum (ETH), alongside the general cryptocurrency market, has experienced notable price gains. In particular, the second-largest cryptocurrency has witnessed its value increase by 24.31% in the past four days as it approaches a crucial $3,000 resistance zone. Related Reading: Ethereum Analyst Sees Altseason Potential As BTS Is Still Outpacing ETH Time To Buy Altcoins? Ethereum Prepares For Potential Surge As Funding Rates Hit 0.02 Amidst the recent price rally in the last week, crypto analyst Burak Kesmeci notes that Ethereum funding rates have now climbed above 0.02, which can be described as a strong bullish signal.  Generally, funding rates are periodic payments made between traders in the perpetual future contracts during funding intervals. A funding rate of 0.02 indicates long position domination and demands that long traders pay 2% of the notional value of their position to short traders in order to maintain the price of perpetual contracts close to the spot market price of an asset.  According to Kesmeci, long positions in futures markets are crucial to initiating strong bull rallies in the same vein as spot market acquisitions. Interestingly, historical data as shared by the analyst shows that Ethereum has consistently experienced a major price uptrend whenever funding rates have risen and stayed above 0.02. For context, when funding rates hit 0.02 on July 1, 2020, the ETH market recorded a price gain of over 100% in 50 days. Likewise, on November 2, 2020, Ethereum also embarked on a bullish course surging by over 1000% in 350 days. Most recently, Kesmeci notes that the altcoins price grew by 150% in 150 days as the funding rates crossed 0.02 on October 4, 2023. Therefore, the analyst postulates ETH may be primed for a robust bullish run in the coming days. In addition, this potential uptrend is expected to influence other altcoin markets due to Ethereums position as the largest altcoin by market cap. Related Reading: Ethereum L2 Project Spark Launches On-Chain Order Book On Fuel Network To Enhance Trading ETH Meets Crucial $3,000 Resistance Level With Ethereums price hovering above $2,900, the token is set to soon encounter a major resistance at the $3,000 price mark.  According to a report by blockchain analytics company IntoTheBlock, this particular resistance level which can be described as a historically significant demand zone is normally expected to provide much opposition to Ethereums ascent.  However, the current bullish momentum in the ETH market is likely to subdue this resistance, allowing the asset to maintain its current rally. If Ethereum breaks beyond $3,000, the altcoin could attain a $4,000 price target. Albeit a rejection would result in ETH trading as low as $2,400. At the time of writing, Ethereum continues to trade at $2,970 following a 0.98% gain in the last day. Featured image from Mandrex, chart from Tradingview

Oct 13, 2024 12:05

Ethereum MVRV Score Signals Cooling Market Momentum Time To Buy?

In line with the general crypto market, Ethereum (ETH) produced a positive price performance in the past day with a significant 4.50% gain, according to data from CoinMarketCap. Following this price rise, the altcoin moved its weekly profits to around 1.35% after what has been a turbulent trading week. However, certain market indicators signal the ETH market remains far from a bullish breakout. Related Reading: Ethereum TD Setup: Why The ETH Price Must Hold $2,250 Ethereum MVRV Far From Critical Bullish Level, Analyst Says  In an X post on Friday, crypto analyst Burak Kesmeci shared an insight on the cyclical relationship between Ethereums price and its Market Value to Realized Value (MVRV) ratio, which he states can be used to identify buy and sell signals.  According to Kesmeci, the last two bull and bear periods in the ETH market have revealed certain MVRV points i.e. 3.00 and 0.80 as vital to understanding price movement.  The analyst explains that an MVRV value above 3.00 usually results in Ethereum entering an overbought zone, presenting investors with an opportunity to sell in fear of a potential price fall.  Alternatively, historical data have shown ETH to be relatively cheap and undervalued when the MVRV value falls below 0.80, representing an opportunity for aggressive purchases by long-term investors.  However, In a more detailed analysis, Kesmeci highlights 2.25 to be a critical MVRV level in a bullish Ethereum market. The analyst states that significant price gains have been recorded whenever ETH moved past this MVRV value in the last two bull cycles. According to Kesmeci, Ethereums current MVRV stands at 1.22 following a decrease from 1.95 over the last 120 days. A continuous decline to below 0.80 would present a buy signal as earlier stated. However, investors should only anticipate a serious rally if the MVRV value moves upward and past 2.25.   Related Reading: Ethereum Could See a 53% Price Correction If This HappensAnalyst Key Ethereum Support Zone Revealed In other news, market analyst Ali Martinez has identified a key support level for Ethereum. According to data from IntoTheBlock, 2.4 million wallet addresses acquired $52.6 million worth of ETH at the $2,300 price mark.  Therefore a price fall below this region could trigger a panic market sale, resulting in a further price loss. At the time of writing, ETH trades at $2,458 with a 4.51% gain in the past 24 hours. However, the general market sentiment towards the altcoin remains largely bearish. This is reflected in the 13.21% decline in its daily trading volume currently valued at $13.45 billion. With a market cap of $293.36 billion, Ethereum remains the second-largest cryptocurrency after Bitcoin. Featured image from The Guardian Nigeria, chart from Tradingview

Jan 26, 2025 12:05

Stablecoins Market Cap Up By 65% Driving The Bull Rally Forward?

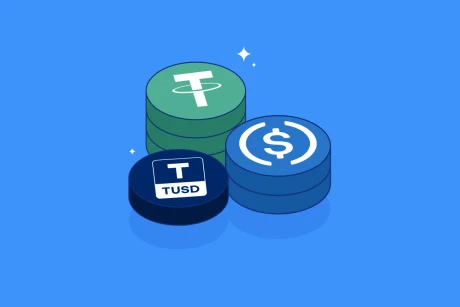
Amidst a momentary pause in the current crypto bull run, stablecoins have emerged as a potential factor capable of driving the market forward. Market analyst Burak Kesmeci has provided much insight on this possibility while highlighting the impressive market gains of these stable digital assets in recent times. Related Reading: Bitcoin Faces Short-Term Uncertainty as Exchange Inflows Surge and Tether Liquidity Drops Stablecoins Surpass All-Time High Market Cap Value Of $202 Billion In a new post on X, Kesmeci discusses the potential of stablecoins providing a much-needed boost to the crypto market amidst much uncertainty as evidenced by consistent range-bound movement by major assets. First, the crypto analyst notes that the stablecoin market cap has recorded a 65% gain from a local bottom of $123 billion in October 2023. At press time, these assets have seen their market shares exceed their previous all-time high of $202 billion recorded in August 2022. However, despite this gain,  more data from IntoTheBlock shows that the stablecoins crypto market dominance has declined by 7.91% in comparison to Bitcoin and Ethereum, indicating investors’ preference for these riskier, volatile assets. Generally, a rise in stablecoin supply still remains a bullish sign as these assets represent an important source of liquidity for market traders.  Due to their fixed price nature,  traders often move their funds to stablecoins during periods of uncertainty which can easily be deployed into other cryptocurrencies later resulting in market rallies. However,  Kesmsci notes that this current stablecoin liquidity surge alone would be insufficient to re-ignite the crypto bull run.  This notion is because compared to the previous 2020-2021 bull cycle, stablecoins exchange inflows are still considerably weak, indicating investors’ hesitation to engage the crypto market. Kesmeci explains that this low investor risk appetite can be ameliorated by a fall in interest rates and an increase in quantitative easing which will allow excess capital to flow into cryptocurrencies via the stablecoins. Related Reading: Whales Snap Up 30 Million XRP As Ripple Launches Its RLUSD Stablecoin Stablecoin Market Overview  In other news, Kesmeci further states Tethers USDT remains the unchallenged leader of the stablecoin market with a market of $139 billion. This report proves impressive considering the recent FUD on USDT over reports of potential delisting due to MiCA regulations in Europe. The Circle USDC ranks second with $59 billion in market cap after an impressive 10% gain in the last month. Meanwhile, Ethana’s USDE has climbed to third place with market shares valued at $5.7 billion ahead of the premier decentralized stablecoin DAI. According to data from CoinMarketCap, the total stablecoin market is valued at $221.86 billion following a 0.28% gain in the past day. Meanwhile, daily trading volume is down by 29.93% and valued at $129.23 billion. At the time of writing, stablecoins represent 6.13% of the total crypto market.     Featured image from Swyftx Learn, chart from Tradingview

Your Crypto Gateway

Claim 1,000
Free WCG Coins

World Crypto Global opens the door to digital freedom for everyone.
Manage your free WCG Coins securely—where simplicity meets global accessibility.

11 bn

FREE CRYPTO COINS

8.9 bn

AVAILABLE FOR RESERVATION

2.1 bn+

ALREADY ALLOCATED

× WCG Coin

🎉 Get 1,000 WCG Coins

No fees. No catch. Your crypto journey starts here.