Twitter User Claims TradingView Has Ignored a Fibonacci Retracement Bug for 5 Years
Popular chart analysis service TradingView contains a bug in the Fibonacci retracement technical analysis tool.
Loading
Welcome at World Crypto Global. This portal is packed with useful content and resources to built out your own crypto skills. WorldCrypto is a site member of Gabriel Vega Network.

Popular chart analysis service TradingView contains a bug in the Fibonacci retracement technical analysis tool.
Ethereum has finally broken above the long-watched $2,000 resistance leveland it didnt just edge past it, it blasted through with force. In under 48 hours, ETH surged more than 35%, reaching as high as $2,490 and sending a strong signal that a new phase may have just begun. The breakout, which comes after months of sluggish price action and uncertainty, has reignited bullish sentiment across the market. Related Reading: Cardano Approaches Critical Resistance Break Above Could Trigger Move To $0.80 Top analyst Jelle described the move in dramatic terms, noting that Ethereum aggressively broke straight through a massive resistance level, “like it wasnt even there. More importantly, ETH has now made a higher high, flipping the market structure and confirming the strength of this rally. This is the kind of breakout that often marks a shift in trend, not just a temporary spike. With Bitcoin flirting with $100K and altcoins waking up across the board, Ethereums explosive move may be the start of something much bigger. The $2,000 level had been a significant psychological and technical barrier for months, and now that its gone, bulls are in control. All eyes are on whether ETH can hold these gains and continue leading the charge in the next leg of the crypto bull cycle. Ethereum Forms Bullish Structure As Momentum Shifts After months of relentless selling pressure and persistent bearish sentiment, Ethereum is finally showing signs of structural recovery. The market environment, long dominated by doubt and underperformance, is now shifting as ETH begins to establish a new, more bullish formation. This shift isnt just about priceits being reinforced by meaningful developments on the fundamental side. One of the most important catalysts is the upcoming Pectra update, a major improvement designed to make Ethereum more efficient, scalable, and cost-effective. The update focuses on enhancing the Ethereum Virtual Machine (EVM) and optimizing smart contract performance, key changes that could significantly improve network usability and reduce transaction costs. This technical progress renews investor interest and builds a fresh narrative around Ethereum’s long-term potential. The price action confirms the change in sentiment. Jelle highlights that Ethereum easily broke past the $2,000 resistance, as ETH surged more than 21% only yesterday, blasting through $2,200 and hitting a high near $2,490. More importantly, ETH has made a higher high, signaling a trend reversal. According to Jelle, holding the $2,200 level is now keyif this support holds, ETH could actually be back. Analysts are beginning to call for continued upside, pointing to the combination of washed-out bearish sentiment, fresh technical structure, and growing network optimism driven by the Pectra upgrade. With ETH now breaking out and flipping resistance into support, the conditions are aligning for a potentially massive recovery phase. If momentum holds and the $2,200 level is respected, Ethereum could be entering the early stages of a powerful and sustained rally. Related Reading: Ethereum Extremely Undervalued Against BTC Supply Pressure May Delay Recovery ETH Price Analysis: Bulls Take Over Ethereum (ETH) is trading at $2,334 after a stunning rally that saw it surge more than 35% in less than 48 hours. The daily chart shows a massive breakout above the long-standing $2,000 resistance level, with price reaching as high as $2,490 before pulling back slightly. This breakout decisively ends months of downtrend structure and signals the formation of a new bullish leg. This move came with substantial volume, validating the breakout and showing clear market conviction. ETH also printed a higher high for the first time in months, confirming a shift in trend. However, the price is now approaching the 200-day EMA at $2,428 and remains below the 200-day SMA at $2,701two levels that could serve as medium-term resistance. If ETH can hold the $2,200$2,250 zone as support, this breakout could turn into a full trend reversal. The recent volume spike suggests that both retail and institutional players are stepping back in, possibly driven by growing optimism around Ethereums upcoming Pectra upgrade and improving macro sentiment. Related Reading: Bitcoin Shows Impressive 4H Strength A Shift Toward Upside Break Overall, the chart shows strength and momentum. If bulls maintain control and reclaim the 200-day SMA in the coming sessions, ETH could be set for a sustained run toward higher levels. Featured image from Dall-E, chart from TradingView
Ripple, the blockchain technology company, has announced a significant commitment of $25 million aimed at supporting US classrooms and teachers. This initiative is designed to equip both students and educators with essential resources to improve academic outcomes, foster economic resilience, and prepare for a rapidly changing job market. Ripple’s $25 Million Initiative Despite the known correlation between educational success and long-term economic opportunity, the blockchain payment company stated on Monday that many classrooms across the country continue to struggle with inadequate resources. Ripple highlighted a recent Gallup survey that revealed that 55% of US parents and adults expressed dissatisfaction with K-12 education quality, alleging widespread concerns about funding constraints in the education sector. Related Reading: Dogecoin Bounce Expected By Analyst Who Called Bitcoin Bottom Ripples pledge seeks to address these challenges by providing critical support to students, teachers, and school staff, ultimately helping to rebuild confidence and drive positive results in the classroom. “Ripple has always championed financial and educational access for all, and were partnering with some of the most impactful organizationsDonorsChoose and Teach For Americato benefit thousands of classrooms across the US,” said Brad Garlinghouse, CEO of Ripple. He emphasized the hope that this initiative will inspire others to contribute, starting with Teacher Appreciation Week and continuing throughout the year to ensure that educators and students have the necessary resources to create a brighter future. In a unique approach, the majority of the $25 million grant will be disbursed in Ripple USD (RLUSD), the companys US dollar-backed stablecoin. Educational Opportunities For Students Ripples partnerships with these organizations will focus on a range of innovative initiatives throughout the year. This includes funding for thousands of classroom projects and teacher requests during Teacher Appreciation Week, supporting Teach For Americas Ignite tutoring program nationwide, and launching a national STEM Innovation Challenge. Additionally, Ripple unveiled that the collaboration aims to enhance financial literacy among students and educators, equipping them with the skills necessary for success in a dynamic job market. “Teachers are going the extra mile for their students’ education, even spending hundredssometimes thousandsof dollars out-of-pocket for their classrooms,” said Alix Guerrier, CEO of DonorsChoose. He praised Ripples initiative for providing direct support to teachers, enabling them to access materials that enhance learning experiences and set students on a path to a successful future. Related Reading: Analyst Says $2 XRP Price Is Low As It Still Isnt Activated Aneesh Sohoni, CEO of Teach For America, expressed gratitude for Ripples transformative support. “This funding will expand our Ignite Tutoring Fellows program, drive innovation in our Reinvention Lab, and provide crucial financial assistance to thousands of new corps members during their teacher preparation. With Ripples partnership, were advancing our mission to ensure every child has access to an excellent education and the opportunity to thrive.” At the time of writing, XRP, Ripple’s related token, is trading at $2.13, down 8% for the week. Featured image from DALL-E, chart from TradingView.com
The latest analysis of Bitcoin data shows promising signs for the cryptocurrency’s future performance. Macroeconomic charts indicate a potential new all-time high for Bitcoin in the next 100 days, according to analysts. Bitcoin has been on a rollercoaster ride in recent months, experiencing significant price fluctuations. However, experts are optimistic about the digital currency’s outlook [...]
Ethereum is now trading at a pivotal juncture after days of consistent selling pressure that have pushed the price down by more than 12% since last Tuesday. Currently hovering around the $2,400 mark, ETH is struggling to maintain bullish momentum, and many analysts warn that a deeper correction could follow if bulls fail to defend this crucial support zone. The recent drop reflects broader market uncertainty, with rising volatility shaking investor confidence just as ETH appeared ready to join a wider altcoin breakout. Related Reading: Cardano Whale Activity Spikes 80 Million ADA Added In 48 Hours Despite this weakness, theres growing optimism in some corners of the market. Top analyst Ted Pillows shared a technical analysis showing that a Golden Cross has been confirmed on Ethereums 12-hour chart a signal traditionally viewed as a precursor to major bullish moves. This crossover, which occurs when the 50-period moving average crosses above the 200-period moving average, often marks the beginning of an extended uptrend. If bulls manage to hold current levels and reclaim higher resistance near $2,600, the Golden Cross could become a turning point. Until then, the coming days will be critical in determining whether Ethereum can bounce or sink into a longer consolidation phase. Volatility Hits Ethereum Amid Golden Cross Signal Ethereum saw sharp volatility over the weekend, surging past $2,550 before rapidly reversing and falling back into the $2,400 zone within hours. This sudden move has sparked renewed uncertainty, as analysts grow cautious about the fading bullish momentum and rising selling pressure. While ETH remains one of the stronger performers in the broader altcoin market, it is still down 36% from its December high of around $4,100. This leaves bulls with a clear challenge: hold current levels and regain control by pushing prices above $2,800 to ignite a sustained rally. The $2,400 level is now acting as a critical support zone. A break below it could trigger a deeper retracement, likely dragging Ethereum into a consolidation range or even toward lower support levels. Still, technical signals offer a glimmer of hope. According to Pillows, Ethereum recently confirmed a Golden Cross on the 12-hour chart a bullish pattern that occurs when the 50-period moving average crosses above the 200-period moving average. Historically, such signals have preceded strong upside moves, and Pillow believes this one could pave the way for Ethereum to reach $3,000 in the near term. However, for that to happen, buyers must step in decisively. Volume has tapered off, and sentiment appears fragile after last week’s breakdown. If bulls can defend the $2,400 region and reclaim higher resistance quickly, the Golden Cross might mark the beginning of Ethereums next leg up. Until then, the market remains in a wait-and-see mode, watching whether the bullish signal can outweigh the growing pressure from sellers. Related Reading: XRP Flashes Bullish Signal Technical Indicator Hints At Imminent Rebound ETH Tests Key Support After Drop From Local Highs Ethereum is trading at $2,402 after a sharp Sunday sell-off, where the price spiked to $2,670 before retracing more than 10% in less than 24 hours. As seen in the 4-hour chart, ETH is now consolidating right above the $2,390$2,400 zone, a level that is proving critical for bulls to hold. This area coincides with a prior consolidation zone and could act as a short-term support base. The 200-period EMA on the 4H chart is currently at $2,130, and the 200 SMA is near $1,991 both are significantly below the current price and offer long-term trend support. However, the volume profile shows a spike in sell-side activity during the pullback, suggesting that short-term traders are locking in profits. If price breaks below $2,390, a deeper retrace toward the $2,200$2,300 range becomes likely. Related Reading: Bitcoin Consolidates Below ATH Buying Pressure Weakens As Equities Outperform On the upside, ETH must reclaim $2,550 to reestablish momentum. Failure to do so could confirm a local top. The price action is clearly indecisive, and this range-bound structure could persist unless bulls reassert strength with a decisive move above $2,600. Until then, the $2,400 level remains a battleground between buyers and sellers amid elevated volatility. Featured image from Dall-E, chart from TradingView
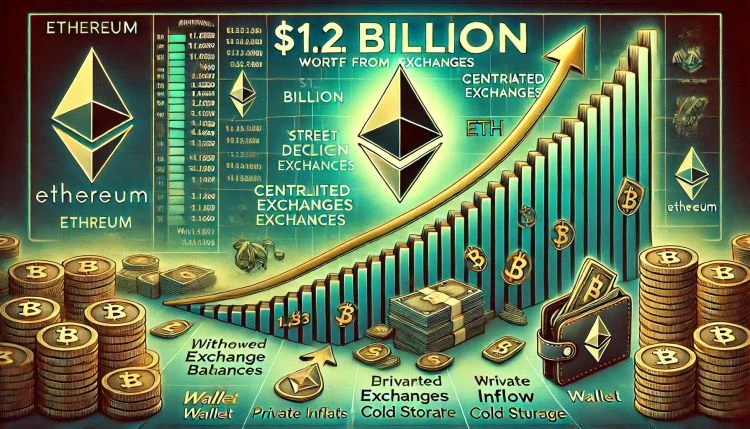
Ethereum is gaining momentum again after tagging the $2,739 level and setting a new local high, reaching prices not seen since late February. The rally marks a strong comeback for ETH, which has been under significant pressure earlier this year. Now, bulls appear firmly in control as the broader crypto market wakes up and capital flows return to altcoins. Related Reading: Solana Network Activity Grows As 11M Wallets Now Hold 0.1 SOL Or More Analyst Analysts are calling for a potential altseason, fueled by Ethereum’s relative strength against Bitcoin and growing investor confidence. As Bitcoin consolidates near all-time highs, Ethereum has taken the opportunity to outperform, pushing up through key resistance levels with conviction. Supporting this narrative, data from Sentora (formerly IntoTheBlock) reveals that $1.2 billion worth of ETH has been withdrawn from centralized exchanges over the past seven days. This sustained trend of net outflows suggests continued accumulation and reduced sell-side pressure, both strong signals for long-term bullish momentum. With price action heating up and investor sentiment shifting, Ethereum could be preparing for a major breakout. If bulls maintain control, the $3,000$3,100 region may be tested in the coming days as the next major resistance zone. All eyes are now on ETH as the altcoin market shows signs of life. Ethereum Builds Momentum As Exchange Outflows Signal Accumulation Ethereum is trading above critical levels as speculation of a sustained rally continues to grow. After weeks of sluggish movement, ETH has roared back to life, gaining over 50% in value since last week. This sharp move to the upside has reignited hopes for an altseason, with many analysts viewing Ethereums breakout as the potential trigger for broader altcoin market strength. Ethereum is now holding firmly above the $2,600 mark, a level that had acted as strong resistance for months. This breakout, coupled with increasing momentum against Bitcoin, suggests bulls are regaining control. Traders are closely watching the next major resistance zone between $2,900 and $3,100, which could serve as a key test for Ethereums uptrend. Adding to the bullish case, data from Sentora reveals that $1.2 billion worth of ETH has been withdrawn from centralized exchanges over the past 7 days. This trend has intensified since early May, pointing to increased investor accumulation and reduced sell-side pressure. Large exchange outflows are often seen as a sign that holders intend to store ETH off-exchange, decreasing immediate supply and supporting upward price movement. With market sentiment turning bullish and Ethereum leading the charge, all eyes are now on whether ETH can maintain its momentum and drive the altcoin market into a new growth phase. If accumulation trends persist and bulls hold key levels, Ethereums path toward $3,100 could open the door to a broader market rally. Related Reading: XRP Open Interest Surges 41% As Speculation Grows Over $1B Added In Just One Week Price Action Details: ETH Testing Key Levels Ethereums weekly chart shows a powerful breakout after weeks of bearish pressure, with ETH now trading around $2,599.14. The recent surge pushed the price above both the 200-week EMA ($2,259.65) and the 200-week SMA ($2,451.55), two critical long-term trend indicators. Reclaiming these levels signals renewed bullish momentum and a strong shift in sentiment. The breakout candle itself is one of the largest weekly green candles in over a year, reflecting a sharp influx of buyer interest and potentially marking a key reversal point after months of downside. Notably, this move brings ETH to levels not seen since February, with the local high for the week reaching $2,739.05. Volume has increased significantly during this move, confirming the strength behind the rally. However, Ethereum now faces overhead resistance near $2,800$2,900, a zone that previously acted as support during early 2024 before the breakdown. If bulls maintain momentum and close this week above $2,600, it could open the door for a test of the $3,100 resistance zone. Related Reading: Ethereum Hits Major Level After Biggest Weekly Candle In Years What Comes Next? On the downside, the key support to watch is around $2,450, aligned with the 200-week SMA. A failure to hold that level could invite a retest of $2,250. For now, the trend is bullish, but follow-through next week will be crucial. Featured image from Dall-E, chart from TradingView
Ethereum is gaining serious momentum after a powerful 45% surge last week, reclaiming key price levels and fueling speculation about the start of a broader altseason. The second-largest cryptocurrency by market cap is now pushing into critical resistance zones that could define the next leg of this rally. After months of underperformance and bearish sentiment, ETHs sudden strength is shifting investor focus back toward the altcoin market, with analysts pointing to Ethereums breakout as a potential spark for widespread recovery across the sector. Related Reading: HYPE Bulls Regain Control After Sharp Recovery Approaching Yearly Highs? Top analyst Daan shared a technical analysis highlighting the significance of Ethereums recent move. According to Daan, the massive weekly candleone of the largest in yearswas driven by a combination of technical breakout and short squeezes, as a large number of bearish positions were caught off guard. This surge not only invalidated recent bearish structures but also marked a structural shift in momentum. With Ethereum now pressing into new territory and investor confidence rising, the market appears poised for renewed strength. If ETH continues to hold above current levels, it could pave the way for altcoins to follow in what may become the strongest altseason since 2021. Ethereum Reclaims Strength As It Tests Key Resistance Ethereum is finally showing signs of strength after months of sustained bearish pressure. Since late December 2024, ETH had been in a steady downtrend, losing more than 66% of its value as investors rotated into other assets amid macroeconomic uncertainty and dwindling altcoin demand. However, a major shift in sentiment emerged in early April, as Ethereum began climbing rapidly, gaining over 85% in just a few weeks. This rally has brought ETH back into critical resistance levels that could determine whether a sustained uptrend is now underway. Daan highlighted the significance of this move, stating that Ethereum is now at a big level. He noted that last weeks price action produced the largest weekly candle in yearsan explosive move fueled by a massive short squeeze. Months of built-up bearish positions were flushed out as the rally caught many by surprise, sending prices sharply higher. Daan cautions that while the move is impressive, the next phase is about managing volatility: Play this level by level, he advises, and watch for next week to develop to see where these alts are going to get picked up after the squeezes are done. This moment is crucial not only for Ethereum but also for the broader altcoin market. ETHs recovery is often a leading indicator of renewed risk appetite and capital rotation into smaller assets. With bulls now in control and price pressing into a key supply zone, how Ethereum behaves over the coming days could determine whether altseason truly beginsor whether this rally was just a reaction to overly bearish positioning. Either way, ETHs strength has put the market back on alert. Related Reading: Solana Rallies Into Pivotal Zone $180 Level Could Define Next Move Technical View: Price Surges Above Weekly Moving Averages Ethereum is showing clear signs of recovery on the weekly timeframe, breaking decisively above the 200-week exponential moving average (EMA) and simple moving average (SMA) for the first time since its downtrend began earlier this year. After reaching a weekly low below $1,400 just a few weeks ago, ETH has rallied aggressively, closing this week near $2,555a 45% surge that marks its most explosive candle in over a year. The chart shows ETH pushing past the 200-week EMA at ~$2,259 and reclaiming the 200-week SMA at ~$2,451. Analysts often use these two long-term trend indicators to distinguish between bear and bull market phases. Ethereums ability to close above both signals a potential shift in sentiment and structure, especially after months of lower highs and declining volume. Volume on this breakout is also notable. The past two weeks have seen a significant uptick in participation, suggesting this move isnt just a short squeeze, but potentially the start of a broader recovery trend. ETH still faces resistance in the $2,700$2,800 zone, but reclaiming this range could open the door for a sustained rally into Q3. The next few candles will be key in confirming this bullish reversal. Featured image from Dall-E, chart from TradingView
Ethereum is holding firm above critical support levels as bulls attempt to reclaim the $1,850 zone. Price action remains cautious, as global trade conflicts and deteriorating macroeconomic conditions continue to weigh on investor sentiment across all markets. The ongoing trade tensions between the US and China, combined with weak economic indicators, have created a challenging environment for risk assets like crypto. Related Reading: Ethereum Flips Key Resistance Into Support Can Bulls Reclaim $2,000 Level? However, despite these headwinds, Ethereum has shown signs of resilience. Some analysts interpret the recent surge in ETH price as a positive shift that could lead to sustained upward momentum if key resistance levels are breached. Top analyst Daan recently shared insights on the ETH/BTC chart, highlighting that Ethereum had a good start last week, showing notable strength relative to Bitcoin. This move immediately pulled a broad range of altcoins higher, signaling growing risk appetite among investors. Daan emphasizes that Ethereums ability to retake its local range is an encouraging development, and a continued push could set the stage for a broader recovery across the altcoin sector. Ethereum Builds Momentum Ethereum is beginning to show early signs of a bullish structure forming on the lower time frames, giving hope to investors after weeks of uncertainty. Bulls are steadily working to reclaim higher resistance levels, although selling pressure remains a real threat. The battle for control is intensifying, with analysts split between two scenarios: a massive breakout toward much higher targets or a failed breakout that could send ETH below the critical $1,300 support zone. Daan shared a technical view suggesting that Ethereum had a strong start last week, regaining strength relative to Bitcoin. This move was significant because it immediately triggered strength across many altcoins, a classic signal that sentiment could be shifting across the broader crypto market. Daan explains that Ethereum has retaken its local range, a critical development. The next objective for bulls is to push ETH toward the range high and reclaim the 4-hour 200 MA and EMA. Accomplishing this would mark the beginning of a potential higher timeframe reversal, turning the tide back in favor of buyers. Daan also highlights that if ETH can continue to build momentum from here, it could ignite another strong altcoin rally, amplifying the impact across the entire market. Related Reading: SUI Shows Relative Strength Against Bitcoin New Uptrend In Play? Price Levels To Watch Ethereum is currently trading at $1,800 after spending several hours ranging tightly between $1,850 and $1,725. Despite the uncertain macroeconomic backdrop, ETH has managed to maintain short-term strength by holding above the 4-hour 200 MA and EMA, two critical technical indicators that have acted as dynamic support throughout the recent price action. The consolidation within this range signals that bulls are defending key levels effectively, but they still need a catalyst to trigger the next significant move. Holding above the 4-hour 200 MA and EMA suggests that momentum remains in favor of buyers for now, and any push above $1,850 could open the door for a larger rally. Related Reading: Bitcoin Rally Lacks On-Chain Support Analyst Warns Of Vanishing Network Activity However, global tensions and weakening economic indicators continue to weigh on sentiment, making next week crucial for clarity. If broader markets stabilize or Bitcoin continues its push toward new highs, Ethereum could benefit and extend its recovery. On the other hand, a failure to hold above $1,725 would expose ETH to renewed selling pressure and a potential retest of lower demand zones. For now, bulls remain in control, but vigilance is key as Ethereum approaches a pivotal moment. Featured image from Dall-E, chart from TradingView
Ethereum is now holding above critical support levels after a volatile few weeks, but it continues to struggle with reclaiming key resistance zones. Bulls have managed to regain some momentum, helping ETH stabilize above the $1,700 level. However, to confirm a true bullish structure and shift sentiment decisively, Ethereum must reclaim and hold higher ground in the coming days. Related Reading: Ethereum Attempts First Major Horizontal Reclaim In Months Can Bulls Hold the Line? Top analyst Daan shared a technical setup highlighting a promising development: Ethereum is flipping a previous horizontal level back into support. According to Daan, this marks a meaningful change in ETHs market dynamics, as its something the asset has failed to do for months. Instead of consistently rejecting resistance and making lower lows, ETH is now showing early signs of strength by defending critical zones. Still, the battle isn’t over. Global macro uncertainty and tensions between the US and China continue to pressure all risk assets, including crypto. For Ethereum, a daily close above key resistance could open the door to a more decisive move higher, while failure to do so could leave it vulnerable to another round of consolidation or downside. Ethereum Faces A Critical Test After Strong Recovery Ethereum has staged an impressive recovery, gaining over 32% from its local low of $1,383. Now trading firmly above $1,700, ETH faces a crucial test: holding current levels to shift its longer-term bearish price structure into a more bullish trend. After months of relentless selling pressure, this stabilization could mark the start of a larger reversal if momentum is sustained. However, broader macroeconomic risks still loom. The ongoing conflict between the US and China continues to pressure financial markets, with growing concerns that a prolonged negotiation process could disrupt global supply chains. If no resolution is reached in the coming weeks, risk assets like Ethereum could struggle to maintain their recent gains. A breakthrough deal, however, could quickly shift investor appetite back toward risk-on assets, fueling a stronger rally. Daans technical analysis highlights a major shift in ETHs behavior. For the first time in months, Ethereum is flipping a previous horizontal resistance zone back into supporta sign of strengthening market dynamics. Daan suggests closely monitoring the $1,750$2,100 range, as a firm hold above this area would signal a significant improvement in ETHs structure. A daily close above $1,750 and gradual consolidation within this key range would position Ethereum for a potential breakout toward higher levels in the coming months. Related Reading: Bitcoin Rally Lacks On-Chain Support Analyst Warns Of Vanishing Network Activity ETH Price Holds Above Key Support, But Challenges Remain Ethereum is currently trading at $1,790, maintaining its position above the critical 4-hour 200 EMA. This technical level has acted as strong support in recent days, providing bulls with a foundation to build momentum. Holding above $1,700 is crucial to maintain the bullish structure that has started to form after weeks of volatility and selling pressure. To confirm a strong recovery and shift into a sustained uptrend, ETH must reclaim the $2,000 psychological level. A decisive break and hold above $2,000 would likely attract renewed buying interest and could open the door for a move toward higher resistance zones. However, without a strong catalyst, bulls could struggle to maintain upward pressure in the short term. Related Reading: Bitcoin Reclaims Key Levels New ATHs May Be Closer Than Expected On the downside, losing the $1,700 support would signal growing weakness and likely invite further selling. A break below this zone could send Ethereum back into the $1,500 region, reigniting concerns of a prolonged consolidation or deeper correction. For now, the market remains cautiously optimistic, but all eyes are on whether bulls can build enough momentum to reclaim higher ground soon. Featured image from Dall-E, chart from TradingView
BlackRock’s iShares Bitcoin ETF was awarded as the Best ETF on a day when it saw a massive inflow of funds. The ETF, designed to track the performance of Bitcoin, has gained significant attention from investors seeking exposure to the digital asset market. The iShares Bitcoin ETF has proven to be a popular choice among [...]
The post BlackRock Bitcoin Fund Tops Charts with $643M Inflow Day appeared first on Crypto Breaking News.
XRP has shown notable signs of renewed bullish momentum in the market. It bounced back from a significant 11% price drop on April 12th, which took the token to its lowest level of the year at $0.4230. However, last week saw a solid 12% price recovery, with XRP outperforming the other top 10 altcoins in the market, behind only Solana (SOL) and Binance Coin (BNB). Signs Of A Strong Bullish Trend Ahead For XRP? On Tuesday, XRP hit a high of $0.5571, demonstrating its bullishness and outperforming its peers. This resurgence was paired with a spike in wallet activity, a positive sign for the token’s overall market sentiment. According to the network intelligence platform Santiment, the number of wallets holding at least 1 million XRP has steadily increased over the past six weeks, rising by 3.1%. It is now just one wallet away from reaching an all-time high (ATH). Related Reading: Standard Chartered Reaffirms $150,000 Bitcoin Price Target By Year-End In addition, crypto analyst Ali Martinez reported a notable buying spree among XRP whales, who purchased over 31 million tokens in the past week alone. This has contributed to the cryptocurrency’s price recovery, emphasizing renewed confidence in its uptrend prospects. Regarding price action, market analyst Egrag Crypto points out that XRP has formed a double bottom pattern, considered a strong bullish signal. This pattern, combined with the transition of the consolidation zone into a supply zone and the wicking area into a demand and accumulation zone, indicates a promising outlook for the token, according to the analyst. Egrag Crypto is confident that a significant price spike or “thrust” is imminent, and the analyst has updated his target to $1.4 for XRP. Critical Resistance Levels To Watch Despite initial bullish outlooks for XRP, the token has retraced to the $0.5474 price level as of the time of writing, accompanied by a 14% decrease in market capitalization over the past 30 days. Moreover, as XRP aims to reach higher levels, potential resistance barriers may impede the token’s recovery and the bullish trend. Analyzing the XRP/USD chart below reveals the immediate resistance at $0.5644, which has prevented consolidation above current levels for the past week. Related Reading: The Cardano $1 Dream: Is A Price Explosion Coming Or Just Deja Vu? After that, the final obstacle before a retest of the $0.600 zone lies at the $0.5884 level. This level previously served as a support floor for the token, leading to a rebound during the uptrend seen in March, which took XRP to its yearly high of $0.745. Conversely, monitoring the support levels at $0.52910, $0.5184, and $0.5044 is crucial. If a bearish scenario develops in the coming days, these levels may prevent XRP from falling below $0.500. Featured image from Shutterstock, chart from TradingView.com
Ethereum (ETH) is once again trading above the $2,000 mark after several days of struggle, offering a glimmer of hope for investors looking for a recovery. The second-largest cryptocurrency has faced intense selling pressure in recent weeks, losing over 38% of its value since late February. Panic spread through the market when ETH broke below the key $2,000 level and later plunged under $1,800 a move that signaled weakness and raised fears of a deeper correction. Related Reading: Dogecoin Breaks Above Bullish Daily Pattern Analyst Sees A Surge To $0.43 Despite the volatility, market sentiment is beginning to shift. Some investors now believe that the worst may be behind Ethereum, and a slow but steady recovery could be on the horizon. Supporting this narrative, on-chain data from Glassnode reveals that Ethereum has reclaimed its realized price at $2,040 a level that reflects the average price at which all ETH in circulation last moved. This recovery of the realized price is often seen as a subtle but important bullish signal. It suggests that, on average, holders are back in profit, which may help reduce selling pressure and rebuild confidence in the market. For now, Ethereums ability to stay above $2,000 will be key to confirming a broader trend reversal. Ethereum Faces Pivotal Moment As Bulls Aim To Confirm Recovery Ethereum is beginning to show signs of life after weeks of uncertainty, but a decisive move is still needed to shift market sentiment. The $2,000 level, recently reclaimed, now acts as the key battleground for bulls attempting to ignite a meaningful recovery. As speculation builds around whether Ethereum will continue to trend higher or fall back into a broader correction, price action remains indecisive. Without strong conviction from buyers, the current bounce may fade quickly. To sustain any upward momentum, bulls must defend the $2,000 level with strength and consistency. A failure to hold this support could invite renewed selling pressure and invalidate early signs of recovery. For now, the price hovers in a critical range with no confirmed trend in either direction. Top analyst Ali Martinez shared an important on-chain signal on X, noting that Ethereum has successfully reclaimed its realized price at $2,040. This level reflects the average price at which ETH last moved on-chain and often serves as a pivot point for market sentiment. Martinez also pointed to $2,300 as the next significant resistance, with pricing bands suggesting heavy selling pressure at that level. Reclaiming $2,300 would mark a major technical breakthrough and potentially confirm a shift in trend. Until then, Ethereum remains in a fragile position, caught between renewed optimism and lingering caution. Bulls must step in with volume and follow-through to turn this early bounce into a full-fledged recovery rally. Related Reading: Ethereum Accumulation Is Almost Over Breakout Above $2,200 Could Trigger Expansion Phase Technical Details: Price Struggles Below Key Averages Ethereum (ETH) is currently trading at $2,070, hovering just above the crucial $2,000 support level. Despite recent attempts to regain strength, ETH remains 5% below the 4-hour 200 moving average (MA) and 200 exponential moving average (EMA) a sign that momentum is still tilted in favor of the bears. These technical indicators often act as dynamic resistance, and until bulls reclaim them, the path to recovery remains uncertain. For Ethereum to initiate a meaningful uptrend, reclaiming the $2,200 level is essential. A breakout above this zone would not only restore short-term bullish sentiment but also confirm a potential reversal from the recent downtrend. However, if ETH continues to struggle below the moving averages and fails to gain traction above $2,000, the risk of further downside increases significantly. Related Reading: Dogecoin Bollinger Bands Tighten On 12H Chart Hinting At Imminent Price Move Insights A breakdown below $2,000 could trigger a sharper correction, with the next major support sitting around the $1,800 level a zone that previously acted as a pivot during the February selloff. As market sentiment hangs in the balance, bulls must act quickly to defend key support and regain control of price action. Otherwise, Ethereum could face another leg down in the coming sessions. Featured image from Dall-E, chart from TradingView
Bitcoin (BTC) continues to face massive selling pressure, with prices dropping below the $85,000 mark, marking a 12% decline since last Friday. The recent downturn has fueled panic selling and heightened fear, leading many investors to speculate about the potential start of a bear market. As uncertainty grips the market, traders remain cautious about Bitcoins next major move. Related Reading: Cardano Bulls Eye $10 Target Analyst Reveals Key Levels To Break However, despite the ongoing sell-off, key on-chain data from CryptoQuant suggests that Bitcoin could be setting up for a recovery rally. The Cumulative Value Days Destroyed (CVDD) indicator, a metric that tracks long-term holder behavior and capital inflows, suggests that BTC could soon enter a new uptrend. If Bitcoin stabilizes and reclaims key support levels, it could pave the way for a rally toward a new all-time high of $128,000. With Bitcoin at a critical inflection point, the next few trading sessions will be crucial in determining whether BTC can regain momentum or if further downside is ahead. Investors are now closely watching whether selling pressure continues or if long-term holders step in to accumulate, signaling a potential market rebound. Bitcoin Insights Give Hope To Bulls Bitcoin is at a critical juncture, facing a serious risk of continued correction as bearish sentiment grips the market. Many analysts now believe that the Bitcoin bull cycle may be over, as BTC struggles below $85,000 while barely holding above $80,000. With selling pressure intensifying, investors are expecting another leg down, potentially pushing BTC into lower demand zones. Despite the negative outlook, some analysts argue that a recovery is still possible if Bitcoin can reclaim key levels. Top analyst Ali Martinez shared insights on X, stating that if BTC reclaims $84,000 as support, it could open the path toward a rally to a new all-time high of $128,000. This suggests that while the market remains fragile, there is still potential for Bitcoin to regain strength if bulls step in at critical price points. The coming weeks will be crucial in determining the strength or weakness of this cycle. If BTC continues to struggle below key resistance levels, a deeper correction could follow, reinforcing bearish sentiment. However, if bulls manage to push BTC back above $84K, it would indicate a shift in momentum, potentially reigniting the uptrend. Related Reading: Ethereum Breaks Out Of Descending Triangle Pattern Fakeout Or Recovery Rally? With uncertainty dominating the market, traders are closely watching BTCs next move, as its ability to hold or reclaim support levels will determine whether this cycle is truly over or if another rally is still on the horizon. BTC Struggling Below $85K Bitcoin has faced massive selling pressure, with the most significant drop occurring on Sunday, when the price plunged from $86,000 to $80,000, marking a 7% decline in just hours. This sharp downturn has fueled panic selling as investors remain uncertain about Bitcoins short-term direction. For bulls to regain control, BTC must reclaim the $86,000 level and push above $90,000 to confirm a potential recovery rally. A strong move past these key resistance levels could restore confidence in the market, signaling that Bitcoins correction phase might be nearing its end. However, failure to break above $86K could keep Bitcoin under bearish control, increasing the risk of another leg down. If BTC drops below $80,000, it could test the $78,000 low, a level that, if breached, may lead to further downside pressure. Related Reading: 330,000 Ethereum Withdrawn From Exchanges In 72 Hours Supply Squeeze Incoming? With Bitcoin at a critical turning point, the next few trading sessions will determine whether bulls can reclaim key levels or if bears will continue to dominate the market, pushing BTC into deeper correction territory. Featured image from Dall-E, chart from TradingView
A dormant Bitcoin (BTC) wallet holding over 1,037 Bitcoin — worth $31 million at current prices — has suddenly awoken after an 11-year slumber, transferring out its entire stash. The 1037 BTC was transferred amid a Bitcoin price of $29,956 and took effect at block height 799701 — approximately 10:51 am UTC on July 22, according to [...]
The post Sleeping Bitcoin wallet stirs after 11 years, moving over $30M appeared first on Crypto Breaking News.
In this article, we will explore the best cryptocurrency trading and charting software in 2023, their pros and cons, and their price tiers.
Though Cardano (ADA) has been gaining traction for a while, the recent accumulated momentum has garnered active buys as data shows the rising accumulation of ADA. ADA’s movement to the upside since last December totaled 30%, as new whales have been reported to be holding at least 1 million ADA tokens in these past few weeks amid the mini bull run. Regardless of the bear market, Cardano has proved to be a token worth holding both with its utilities and the recent positive news that includes the rapidly growing DeFi and NFT ecosystem of the Cardano Blockchain. Cardano Rally Since December Late last year, ADA gained traction and purchases from whales. According to crypto analytics platform Santiment, ADA has jumped an impressive 30% in its value since December 30th. Twenty-eight new whale addresses holding at least 1 million ADA have appeared on the Cardano blockchain since the price surge began, indicating an aggressive asset accumulation from large investors. In addition, Santiment mentioned that alongside the token’s upward rally, ADA trading volume and amount of large whale transactions hit 2-month high crushing levels last seen in November. Notably, ADA has been down by nearly 90% from its all-time high of $3.09. This recent accumulation resulting in a rally in its price could be what the token needs to recover. In the last 7 days alone, ADA has been up by 25%. Related Reading: Cardano (ADA) Up Nearly 20%, Aiming For A Higher High? Alongside the whole crypto market, ADA has taken advantage of the mini bull run and followed suit in the right direction. Among the largest crypto by market cap, ADA is still the only one making significantly higher highs, following Solana (SOL), which had already gained 43% in the past 7 days. Cardano’s Anticipated Catalyst While there is still no apparent reason behind the recent active accumulation of ADA, it’s worth noting that the blockchain itself has got big announcements it’s working on, which could be an enticing catalyst enough to attract large investors to buy up the digital asset. On the main stage at the CardanoSummit2022, the CEO of COTI, Shahaf Bar-Geffen, announced that Cardano is set to Launch an over-collateralized stablecoin which will go live on Mainnet later this month. Historically, the launch of stablecoins always ends up being a good enough catalyst or an appealing use case that often results in a significant surge in inflows as it causes on-ramps and off-ramps of funds that keep users within the ecosystem. Related Reading: Cardano Follows Bullish Sentiment, Why ADA Could Become Top 3 Coin Following its spike in accumulation, Cardano decentralized applications have also been seeing a spike in the number of unique accounts. DApps like Genius Yield have so far gained 2,810% growth in unique accounts in the last 5 days. All of these indicate a steady increase in Cardano adoption and decentralized finance activity. Meanwhile, at the time of writing, ADA is continuing in an uptrend, up by almost 1% in the past 24 hours with a trading price of 0.3180 and a 24-hour trading volume exceeding $500 million. Featured image from Bitcoinist, chart from TradingView.com
Cryptocurrencies have become part of many portfolios in the last few years. Moreover, institutional adoption has led to big players’ implication in the industry.
This was one of the great wishes of early cryptocurrency investors. If the price rose so much, as it did in the case of Bitcoin, before institutional adoption, imagine the move once Bitcoin becomes part of big portfolios.
But the opposite happened.
Being part of the institutional world comes with an increased correlation with many other assets. Suddenly, Bitcoin and other cryptocurrencies have become directly correlated with what is happening in financial markets with the US dollar, the global interest rates, and the US stock market, to name a few.
Moreover, because of higher volatility levels, typical for the cryptocurrency market, Bitcoin and other cryptocurrencies declined more this year.
Here is a comparison. Now that the summer trading is behind us, the main themes in financial markets during the first eight months of the year were a strong US dollar and the weak equity market.
Bitcoin remains the most vulnerableOne may look at Bitcoin through the eyes of leverage. Leverage allows traders to participate in the market with more funds than the trading account has.
Gains may be amplified by two or three times or even more.
But so are losses.
A quick look at the chart above shows Bitcoin acting like a leveraged position compared to a classic one.
Over the year, EUR/USD had one of the steepest declines in the FX market. Yet, it is down only about 12% since the start of 2022.
Furthermore, the US stock market, as represented by the S&P 500 index, dropped by about 16%. But Bitcoin lost more than half of its value over the same period. More precisely, it lost 56.08%.
It is not to say that Bitcoin’s bearish trend will continue. Or that Bitcoin is poised to bounce from the current levels.
What is clear is that buyers stepped in at $20,000. However, up until now, the charts show only a consolidation around the level and nothing more.
In fact, a similar pattern formed twice this year alone. Each time after the market broke below dynamic support, another lower low followed.
Hence, despite dropping much more than the EUR/USD and the S&P 500 index in 2022, Bitcoin remains vulnerable. Further US dollar strength may lead to further declines in the US stock market, and so another leg lower in Bitcoin’s price should follow.
The post Bitcoin fails to bounce from support; here’s what the charts are signaling appeared first on Invezz.
The 2022 bear market has been brutal as more than $2 trillion in value has been wiped away from the crypto economy. In addition to record values lost, the crypto winter has managed to break a number of popular bitcoin price models like the rainbow price chart and Plan B’s infamous stock-to-flow model. Moreover, since More
The post Rainbows, Log Charts, and S2F: Bitcoin’s 2022 Bear Market Has Broken the Community’s Most Popular Price Models appeared first on BTC Ethereum Crypto Currency Blog.
Global crypto markets were trading nearly 6% lower as of writing this, with SOL one of the biggest crypto’s to fall during the session. While falling by over 12% on the day, RUNE and WAVES fell by as much as 20% on Thursday. WAVES WAVES was easily one of the biggest gainers in March, as… More
The post Biggest Movers: SOL Slips Over 10%, as RUNE, WAVES Down Nearly 20% appeared first on BTC Ethereum Crypto Currency Blog.
Ethereum addresses have been on a strong, steady increase since last year, but daily transaction volumes and the number of whales on-chain are decreasing.
World Crypto Global opens the door to digital freedom for everyone.
Manage your free WCG Coins securely—where simplicity meets global accessibility.
FREE CRYPTO COINS
AVAILABLE FOR RESERVATION
ALREADY ALLOCATED

No fees. No catch. Your crypto journey starts here.