Spot Bitcoin ETFs see record inflows after July 4 dip
The Bitcoin price correction provided a strong opportunity for ETF investors to buy the dip.
Loading
Welcome at World Crypto Global. This portal is packed with useful content and resources to built out your own crypto skills. WorldCrypto is a site member of Gabriel Vega Network.

The Bitcoin price correction provided a strong opportunity for ETF investors to buy the dip.
Data shows users on social media platforms have been calling to sell Bitcoin after its latest crash, a signal that contrarian traders may be waiting for. Bitcoin Sentiment On Social Media Has Turned Quite Bearish According to data from the analytics firm Santiment, social media is showing historic levels of FUD amid the market drawdown. The indicator of interest here is the “Social Volume,” which basically tells us about the degree of discussion around a given topic or term that users on the major social media platforms are currently participating in. This metric works by going through posts/threads/messages on these platforms to look for mentions of the keyword. The indicator then counts up the number of posts that contain at least one such mention. Related Reading: Bitcoin Traders Sink Into Fear As Price Crashes Below $58,000 The reason the Social Volume doesn’t simply count up the mentions themselves is that mentions alone don’t contain any information about if the trend is being followed across social media as a whole. Sometimes, for example, mentions can be high for a topic, but most of them could be limited to niche circles (that is, inside a few posts). The Social Volume naturally wouldn’t spike in this case, but it would when users across the platforms are making posts about the term. Now, what the analytics firm has done here is that it has applied terms related to sentiment to Social Volume, to differentiate between discussions related to positive and negative sentiments. Here is the chart shared by Santiment that shows how the Social Volume for negative and positive sentiments has changed alongside the recent Bitcoin volatility: To discern the sentiment, the analytics firm has chosen terms such as buy, bottom, and bullish in the case of positive sentiment, and sell, top, and bearish for negative sentiment. From the graph, it’s visible that the Social Volume for the latter type of keywords has observed a huge spike alongside the plunge in the Bitcoin price. This would imply that a large amount of bearish posts have popped up on social media. The indicator has also spiked for terms pertaining to positive sentiment, but clearly, the scale has been lesser than the one for bearish terms. In fact, the latest ratio between sell and buy calls has actually been the largest observed in the year so far. Thus, it would appear that social media users as a whole are feeling FUD towards Bitcoin. This may actually be a positive development for the cryptocurrency, however, as its price has historically been more likely to move in the opposite direction to what the crowd expects. Related Reading: Why Did Bitcoin Plunge Under $58,000? On-Chain Data Says This As is apparent in the chart, buying calls had spiked on a few occasions following price plunges in the past month, but this optimism had only led to a continued decline for the asset. With the latest crash, sentiment appears to have finally flipped, with Bitcoin traders starting to give up. “For bold traders, this is a window that some may wish to be a true contrarian and buy into the crowd’s anger and frustration,” notes Santiment. BTC Price Bitcoin had briefly slipped under the $54,000 level during the plunge, but the asset appears to have bounced back to $55,400 since then. Featured image from Dall-E, Santiment.net, chart from TradingView.com
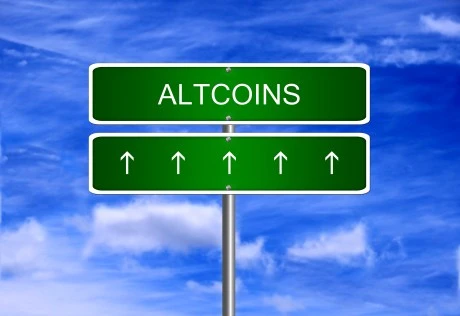
The on-chain analytics firm Santiment has revealed the altcoins that are currently in the historical buy zone according to a fair value model. A Large Amount Of Altcoins Are Currently Near The Opportunity Zone In a new post on X, Santiment talked about what the various assets in the cryptocurrency sector are looking like right now based on their Market Value to Realized Value (MVRV) ratios. The MVRV ratio is an indicator that keeps track of the profit/loss status of the addresses on any given network. When the value of this indicator is greater than 1, it means the investors are carrying a net amount of profits right now. On the other hand, the metric under this threshold implies the dominance of losses in the market. Related Reading: Crypto Analyst Says Next Bitcoin Target Is $78,700 If BTC Breaks This Resistance Naturally, the MVRV ratio being exactly equal to 1 suggests the unrealized loss on the network is exactly equal to the unrealized profit, so the average holder could be considered just breaking even. Historically, corrections have become more probable when investor profits have ballooned up. Holders become more tempted to sell the larger their gains grow. Similarly, holders getting underwater has facilitated bottom formations, as sellers become exhausted during such conditions. Based on these facts, Santiment has developed an Opportunity and Danger Zone Model that uses the MVRV ratio’s divergence on different timeframes to estimate better whether an asset is currently providing a buying or selling window. Now, here is the chart shared by the analytics firm that shows where the different altcoins stand according to this model: Note that in this model, the zero mark takes the role of the neutral 1 level from the MVRV ratio. Also, the polarity is flipped here, with values under zero implying profit dominance and those above signifying loss. The graph shows that most of the altcoins are in the positive region right now, suggesting that their investors are underwater. Among these, Basic Attention Token (BAT), Chromia (CHR), and Highstreet (HIGH) particularly stand out as their MVRV divergence exceeds the 1 mark. Related Reading: PEPE Bullish Signal: Whale Withdraws $14.7 Million Stack From Binance Under this model, the region above 1 is called the “Opportunity Zone,” as assets have historically offered the most profitable opportunities while inside it. While most altcoins are at least slightly undervalued currently, a few, like Ethereum Name Service (ENS), MANTRA (OM), and Reserve Rights (RSR), are in or near the Danger Zone instead. The Danger Zone, which occurs under -1, is the counterpart to the Opportunity Zone, where coins become overvalued. Ethereum Price Ethereum, the largest among the altcoins, has faced a plunge of more than 4% in the last 24 hours, which has taken its price under the $3,300 level. Featured image from Shutterstock.com, Santiment.net, chart from TradingView.com
On-chain data shows the Litecoin whales have gone on a $230 million buying spree recently, which could bring bullish winds for the coin. Litecoin Whales Have Been Making Net Inflows To Their Wallets Recently According to data from the market intelligence platform IntoTheBlock, the Litecoin whales have received large net inflows in their addresses over [...]
The post Litecoin Whales Go On $230 Million Buying Spree: Will This Change LTCs Stars? appeared first on Crypto Breaking News.
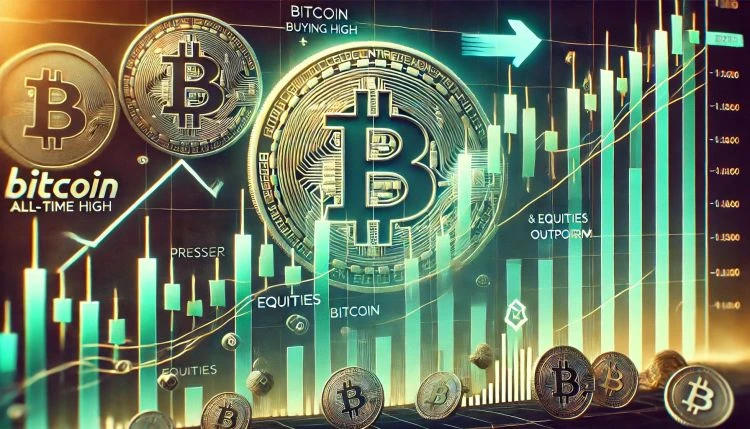
Bitcoin is facing growing risks of a pullback as bullish momentum begins to fade near key resistance. After weeks of impressive gains, BTC is now consolidating in a tight range just below its all-time high, with buyers struggling to push the price into price discovery. This ongoing indecision has raised concerns among traders and analysts, who are closely watching for signs of either a breakout or a deeper retracement. Related Reading: Ethereum Multi-Year Consolidation Could Spark A Parabolic Move Details Crypto analyst Daan offered a broader perspective on the situation, noting that Bitcoin initially surged in response to the recent tariff-related tensions, significantly outperforming equities in the process. However, as trade uncertainty began to ease and traditional markets regained momentum, Bitcoin lost steam and failed to follow through. While stocks continued their uptrend, BTC stalledan unusual divergence that suggests caution may be creeping back into the crypto space. With the price now hovering around the $103K mark and key resistance near $105K remaining untouched, bulls must act decisively to reclaim control. A failure to do so could trigger a larger correction, especially if macro conditions shift or equity markets show renewed weakness. For now, all eyes are on the range and which side breaks first. Bitcoin Bulls Eye Breakout But Caution Grows Near Resistance Bitcoin is just 5% away from its all-time high of around $109,000, trading near $103K as bulls attempt to reclaim momentum. After weeks of strong upward movement and consolidation above key levels, many analysts believe BTC is preparing for a decisive breakout. If price can clear the $105K resistance, it could trigger a new leg into price discovery and signal the start of a powerful bull phase. However, selling pressure at current levels remains strong. Bitcoin has struggled to break higher, and some traders see this consolidation as a sign of potential exhaustion. Daan offered insights on the recent behavior, noting that BTC surged sharply following the tariff-related macro drama, outperforming equities in the process. Yet, as some trade uncertainty faded, stocks kept climbing while BTC stalled near resistance. Daan considers $90K his line in the sand for long-term spot exposure. If Bitcoin were to drop below that mark, it would suggest a structural breakdown that hasnt occurred during this cycle. For now, he remains cautiously bullish while BTC stays above that level, but admits the risk-reward was more attractive when BTC was 2030% cheaper. He also warns that if equities correct after their aggressive ralliesmany stocks have surged 3050% in a single monthit could drag Bitcoin lower in a short-term flush. With BTC showing relative weakness near resistance, the next move will be critical for confirming either continued upside or the start of a broader pullback. Related Reading: Dogecoin Whales Accumulate 1 Billion DOGE In A Month: Fueling Price Surge Speculation Tight 4H Range Signals Imminent Price Breakout The 4-hour chart shows Bitcoin consolidating tightly between $105,700 resistance and $100,700 support, creating a narrow range that suggests a strong move is imminent. Price has been ranging sideways for several days, with multiple failed breakout attempts above $103,600. This level continues to act as a key barrier for bulls. Notably, Bitcoin remains above both the 200 EMA ($96,121) and the 200 SMA ($94,622), reinforcing the medium-term bullish structure. Momentum is neutral in the short term, as shown by the indecisive price action and declining volume. However, the trend remains intact as long as BTC holds above $100,000 the psychological and technical line in the sand. If price breaks above $103,600 with volume, it could trigger a move toward the $105,000$109,000 range and initiate a push into price discovery. On the other hand, failure to hold this support zone could open the door for a quick flush to retest the $98,000$96,000 area, where the moving averages align. Related Reading: Solana Sees Renewed Demand As Capital Flows Turn Positive Details Traders should watch for a clear breakout or breakdown, especially as moving averages and prior highs converge. This tight setup rarely lasts long, and a decisive move could define Bitcoins trend for the rest of the month. Featured image from Dall-E, chart from TradingView
On-chain data suggests demand for Bitcoin remains significant as newcomer whales in the sector have been scooping up 200,000 BTC every week. Short-Term Holder Bitcoin Whales Have Continued To Accumulate Recently As explained by CryptoQuant author Axel Adler Jr in a post on X, the demand among the short-term holder whales has decreased since the all-time high, although it still continues to remain strong. Related Reading: Buy Or Sell Bitcoin? Quant Reveals What Leading Metric Says The “short-term holders” (STHs) refer to the Bitcoin investors who have been holding onto their coins since less than 155 days ago. This cohort includes the new investors in the market, as well as the fickle-minded traders who make moves often and don’t tend to HODL. The investors who make it past the 155-day threshold are put inside the “long-term holders” (LTHs), which is a group that’s generally considered to reflect the resolute side of the sector. In the context of the current discussion, the investors of interest aren’t the ordinary STHs, but rather the humongous entities called whales. Formally, these investors are defined as those holding more than 1,000 BTC in their wallets. At the current exchange rate, this lower limit is worth $61.5 million, which is massive indeed. Whales can be influential beings on the network because of these large holdings, so their behavior can be something worth keeping an eye on. The STH whales would naturally correspond to the large holders who only bought within the past five months. Here is a chart that shows the trend in the exchange outflows being made by these new whales in the Bitcoin market over the last few years: As displayed in the above graph, the 7-day simple moving average (SMA) of the Bitcoin STH whale exchange outflows had spiked to pretty high levels earlier in the year, when the rally towards the new all-time high (ATH) price had taken place. Naturally, this spike would suggest demand for buying the cryptocurrency was high from new whale investors entering the space. At the peak, the indicator implied accumulation was occurring at the rate of a whopping 452,000 BTC per week. Related Reading: Bitcoin Will Be Set For New ATHs If It Breaks This Resistance: Analyst A part of this buying would correspond to the demand coming in from the spot exchange-traded funds (ETFs) – new investment vehicles for Bitcoin only approved at the start of this year that provide for an indirect way to invest into the asset in a format that may be preferrable for the more traditional investors. From the chart, it’s visible that the demand from the new whales has seen a clear decline in the period since the ATH, but accumulation nonetheless remains substantial as the STH whales are still potentially buying at a rate of around 200,000 BTC per week. BTC Price Bitcoin has continued to be stagnant recently as its price is trading around $61,600 right now, still very much inside the range. Featured image from Andrew Bain on Unsplash.com, CryptoQuant.com, chart from TradingView.com
A quant has explained what a potential leading Bitcoin indicator could say about whats next for the cryptocurrencys price. Bitcoin Coinbase Premium May Hold The Answer To Where BTC Goes Next In a CryptoQuant Quicktake post, an analyst has talked about the trend currently taking place in the Bitcoin Coinbase Premium. We can use the [...]
The post Buy Or Sell Bitcoin? Quant Reveals What Leading Metric Says appeared first on Crypto Breaking News.
On-chain data shows a Dogecoin whale made a large withdrawal from Binance today, which may be bullish for the memecoins price. A Large Amount Of Dogecoin Has Left The Binance Platform In The Past Day According to data from the cryptocurrency transaction tracker service Whale Alert, a large transfer has been spotted on the Dogecoin [...]
The post Dogecoin Whale Takes $52.3 Million In DOGE Off Binance, Sign Of Buying? appeared first on Crypto Breaking News.
The on-chain analytics firm Santiment has revealed that over 85% of all altcoins in the sector are currently in the historical opportunity zone. MVRV Would Suggest Most Altcoins Are Ready For A Bounce In a new post on X, Santiment discussed how the altcoin market looks based on their MVRV ratio model. The Market Value [...]
The post 85% Of Altcoins In Opportunity Zone, Santiment Reveals appeared first on Crypto Breaking News.
On-chain data shows that the Bitcoin whales holdings have grown to 25.16% of the entire supply, and their net accumulation has continued recently. Bitcoin Investors With 1,000 To 10,000 BTC Have Continued To Buy Recently According to data from the on-chain analytics firm Santiment, the BTC whales have accumulated more than 266,000 BTC since the [...]
The post Bitcoin Whales Continue Buying, Now Hold 25.16% Of All Supply appeared first on Crypto Breaking News.
On-chain data shows the new whale entrants in the Bitcoin market now hold almost twice as much as the veterans. Here’s what could be behind this shift. Bitcoin Newbie Whale Holdings Have Been Rapidly Growing Recently In a new post on X, CryptoQuant founder and CEO Ki Young Ju has discussed about how the holdings of the new whales compares against the old ones in the market right now. Related Reading: Is The Bitcoin Top Already Here? This Historical Pattern Says So The on-chain indicator of interest here is the “Realized Cap,” which, in short, keeps track of the total amount of capital that the investors have used to purchase their Bitcoin. This capitalization model is in contrast to the usual market cap, which simply measures the total value that the holders as a whole are carrying based on the current spot price. In the context of the current topic, the Realized Cap of the entire market isn’t of interest, but rather specifically that of two segments: the short-term holder whales and long-term holder whales. Whales are defined as entities on the network who are holding at least 1,000 BTC in their balance. At the current exchange rate, this amount is worth $66.6 million, so the whales are clearly quite massive holders. Because of these large holdings, these investors can hold some influence in the market. Based on holding time, the whales can be subdivided into two categories. The short-term holder (STH) whales are those who acquired their coins within the past 155 days, while the long-term holder (LTH) whales have been holding since longer than this timespan. Now, here is the chart shared by Ju that reveals the Realized Cap breakdown between these two Bitcoin whale cohorts: Looks like the metric has shot up for the STH whales recently | Source: @ki_young_ju on X As is visible in the above graph, the Realized Cap of the STH whales has historically not been too different from that of the LTH whales, but that appears to have changed recently. The metric has pulled away for these new whales this year with some very sharp growth, as its value has now reached the $110.6 billion mark. This means that the STH whales have collectively bought their coins at an initial investment of a whopping $110.6 billion. The Realized Cap of the LTH whales, on the other hand, has continued its usual trajectory, floating around $66.9 billion currently. This means that there is now a massive gap between the indicator for these two cohorts. But what’s the reason behind the sudden emergence of this brand-new trend? As mentioned before, the STH cutoff stands at 155 days, which means that the Realized Cap of the STH whales would signify the total value of the purchases made by the whales over the last five months. In the past five months, there has been one event in particular that has stood out, which has also never been present in any of the prior cycles: the approval of the spot exchange-traded funds (ETFs). The spot ETFs provide an alternative mode of investment into the asset through a means that’s familiar to traditional investors. These funds have been bringing in some unprecedented demand into BTC and as their holdings also fall under the 155 days mark, they would count as STH whales. Related Reading: Ethereum To See Fresh Move Soon? What Futures Data Says Bitcoin has also been rallying this year, so all this new investment would have had to purchase at relatively high prices, thus causing the Realized Cap, which correlates to direct capital flows, to inflate even further. BTC Price Bitcoin is now trading at $66,400 after witnessing a surge of more than 6% over the past week. The price of the asset seems to have been overall consolidating sideways recently | Source: BTCUSD on TradingView Featured image from Todd Cravens on Unsplash.com, CryptoQuant.com, chart from TradingView.com
On-chain data shows that the largest number of investors in the Bitcoin market are finally buying, which could be bullish for the assets value. Bitcoin Mega Whales Have Shown Net Inflows In The Past Day In the past few weeks, the Bitcoin price has struggled to mount any significant bullish momentum as it has been [...]
The post Bitcoin Mega Whales Are Buying, Time For Rally To Return? appeared first on Crypto Breaking News.
In June, the surge in stablecoin volume flowing into exchanges has been a clear indicator of the market’s changing dynamics. This is particularly evident when analyzing exchange buying power, a metric that measures the 30-day change in stablecoin buying power on exchanges. The exchange buying power metric is calculated by tracking the 30-day change in […]
The post Stablecoin buying power on exchanges increases as BTC and ETH see outflows appeared first on CryptoSlate.
On-chain data shows the total number of Dogecoin millionaires has observed a steep increase over the past month, a sign of strong accumulation. Dogecoin Millionaires Have Jumped 76% In Past Month According to data from the market intelligence platform IntoTheBlock, the number of Dogecoin millionaires has been skyrocketing recently. “DOGE millionaires” here refer to the addresses that are carrying at least $1 million in their balance. Related Reading: Bitcoin Short-Term Holders Panic Capitulate $2.6 Billion In BTC Crash The below chart shows how the total number of such addresses has changed over the past month. The data for the two millionaire groups of the memecoin | Source: IntoTheBlock on X From the graph, it’s visible that the Dogecoin investors carrying between $1 million to $10 million worth of coins have seen their total count rapidly go up since the end of February. This range would include the sharks as well as the smaller of the whales, so this trend would imply interest in the cryptocurrency has sharply risen among these large entities. Following the latest increase, the total count of addresses holding a balance in this range has crossed the 800 mark. The largest of the investors in the market, those with more than $10 million in DOGE, have also seen their number grow in the same period, as the chart displays. The population of these humongous whales has now crossed the 200 mark. This means that in all, there are now more than 1,000 millionaires on the Dogecoin network. This corresponds to a growth of around 76% in the past 30 days, which is a pretty rapid increase. Since the indicator has caught pace, DOGE has also witnessed an impressive rally, which may not be a coincidence. Naturally, if the number of these millionaires continues to rise into the near future, it would be a sign that big money interest in the memecoin is still furthering, which would be a positive sign for the rally. DOGE Price Has Enjoyed A Sharp Rally Recently Towards the end of last month, Dogecoin finally managed to break free of its long spell of consolidation and did so in quite the spectacular fashion as well. As the chart below shows, DOGE has observed a rapid rise in the past couple of weeks. Looks like the price of the memecoin has witnessed some sharp bullish momentum recently | Source: BTCUSD on TradingView During this rally so far, Dogecoin has managed to reach a high beyond the $0.20 level. Since this peak, however, the coin has seen some notable drawdown, as it’s now trading around $0.15. From the chart, it’s visible that the initial sharp crash in the memecoin had occurred at the same time as Bitcoin had plummeted following a breach of its previous all-time high price. Related Reading: Solana Open Interest Plunges 20%: What It Means For Price Unlike BTC, though, which has made some significant recovery already, DOGE is yet to close back in on its recent highs. Despite this significant pullback, though, the coin’s investors would still be carrying profits of more than 95% over the past month, showcasing just how strong its recent bullish momentum has been. In terms of the market cap, Dogecoin is currently the nineth-largest asset in the sector, some distance behind eighth-placed Cardano (ADA). DOGE's market cap appears to be almost $22 billion at the moment | Source: CoinMarketCap While Dogecoin still has a comfortable gap to Shiba Inu (SHIB) in tenth, its rival is fast approaching it with a run of a whopping 131% in the past week. Featured image from Kanchanara on Unsplash.com, CoinMarketCap.com, IntoTheBlock.com, chart from TradingView.com
Bitcoin has set a new all-time high (ATH) above the $69,000 level as institutional investors have aggressively bought on Coinbase. Bitcoin Has Set A New ATH Above $69,000 The moment that every Bitcoin investor had been looking forward to has finally arrived today. The cryptocurrency just smashed past the record set in November 2021 to [...]
The post Bitcoin Sets New All-Time High Above $69,000 As Institutionals Show FOMO appeared first on Crypto Breaking News.
An analyst has revealed a simple strategy for buying and selling Bitcoin using the historical pattern followed by two BTC on-chain indicators. These Bitcoin On-Chain Indicators Have Followed A Specific Pattern Historically In a post on X, CryptoQuant author Axel Adler Jr. discussed a simple strategy for timing buying and selling moves for Bitcoin. The [...]
The post Whats A Simple Strategy For Buying & Selling Bitcoin? This Analyst Answers appeared first on Crypto Breaking News.
Dogecoin is trading below key levels after dropping over 10% following last nights bullish price action. The meme coin market continues to struggle, and Dogecoin is no exception. Since late January, DOGE has failed to reclaim previous highs and consistently set lower prices each week. Investors are growing cautious as selling pressure remains strong, preventing any meaningful recovery. Related Reading: If Ethereum Holds $2,200 Price Could Recover Fast Analyst Sets Price Target Despite the recent downturn, some analysts remain optimistic about DOGEs long-term prospects. Top analyst Carl Runefelt shared a technical analysis on X, showing that DOGE recently broke out of a long-term falling wedge pattern and is now retesting it. Historically, falling wedge breakouts have led to significant upward movements, provided that the breakout is confirmed. If Dogecoin holds firm above this key level and successfully confirms the breakout, a massive price move could follow, potentially reversing the bearish trend. However, failure to hold this level could lead to further declines, pushing DOGE into lower demand zones. The next few days will be crucial in determining Dogecoins short-term price direction as traders watch for confirmation of the breakout or signs of another downturn. Investors Keep Selling Dogecoin: Can This Change? Dogecoin is facing a crucial test as it attempts to break above key resistance without falling below critical demand levels. Bulls are now working to reclaim lost territory that could ignite a significant rally, but price action remains uncertain in the short term. Related Reading: Bitcoin Reclaims Key Levels And Faces Resistance At $97K Can It Break $100K This Week? The meme coin market has been under intense selling pressure, and Dogecoin has struggled to establish strong demand despite multiple breakout attempts. Investors are closely watching for signs of strength, but so far, bulls have failed to generate the momentum needed for a sustained recovery. Runefelt’s technical analysis reveals that DOGE recently broke out of a long-term falling wedge pattern and is now in the process of retesting it. Historically, falling wedge breakouts have led to explosive price movements, provided the breakout holds. Runefelt has set a price target of $0.434 in the coming weeks if the breakout remains intact. However, despite this bullish setup, there is no clear direction for the broader crypto market as long as Bitcoin remains below the $100K level. With BTC leading the way for the entire industry, meme coins like Dogecoin are likely to follow Bitcoins moves. If BTC reclaims key levels, DOGE could experience a rapid price surge, but continued uncertainty in the market could limit its upside potential. DOGE Testing Short-Term Liquidity Dogecoin is trading at $0.21 after a strong 33% rally over the past few days. Bulls have gained a slight advantage, pushing the price above key resistance levels. However, for DOGE to maintain momentum, it must hold above the critical $0.20 mark, which now serves as short-term support. If bulls successfully reclaim $0.255 in the coming days, Dogecoin could see a significant breakout, leading to a massive recovery phase. A move above this level would confirm a bullish reversal and potentially trigger further buying pressure, sending DOGE toward higher resistance zones. However, the market remains volatile, and losing the $0.20 level could quickly reverse recent gains. If DOGE fails to hold this support, a 15% drop could follow, bringing the price back into lower demand zones. Traders are closely watching Bitcoins movement as any major BTC sell-off could impact meme coins, including Dogecoin. Related Reading: Whales Add 190,000 Ethereum In The Last 24 Hours The Accumulation Continues For now, DOGE bulls are in control, but they must continue defending key levels to sustain the current uptrend. A decisive move in either direction will set the stage for Dogecoins next big move. Featured image from Dall-E, chart from TradingView
On-chain data shows Coinbase has just witnessed its largest USD Coin (USDC) inflow. Here’s why this may be relevant for Bitcoin. Coinbase Has Just Seen A $1.4 Billion USDC Inflow As pointed out by analyst Maartunn in a post on X, a large amount of USDC has flowed into Coinbase during the past day. The on-chain indicator of interest here is the “exchange inflow,” which keeps track of the total amount of a given asset entering into the wallets associated with a centralized exchange or group of platforms. Related Reading: Bitcoin Bull Flag Could Predict 10% Surge To $77,000, Analyst Explains A spike in the exchange inflow can indicate that investors are interested in trading away the cryptocurrency. In the case of an asset like Bitcoin, such a trend can naturally be a bearish signal for the price. In the context of the current discussion, though, a stablecoin is of focus. While USDC exchange inflows would also imply that the holder wants to sell the asset, the transaction wouldn’t affect the price since, by nature, the coin always remains stable at around $1. This doesn’t mean that the sale of USD Coin isn’t of interest to the cryptocurrency sector as a whole, however. If investors are swapping stable coins in favor of volatile coins like BTC, then the prices of these latter assets would observe a buying effect. Now, here is a chart that shows the trend in the USDC exchange inflow over the past month: The value of the metric seems to have been quite high in recent days | Source: @JA_Maartun on X The above graph shows that the USDC exchange inflow has just registered a huge spike. According to Maartunn, this inflow was headed towards the cryptocurrency exchange Coinbase. In total, $1.4 billion worth of the stablecoin has entered the platform’s wallets with this inflow, the largest the exchange has ever observed. Given the extraordinary scale, this could prove to be quite bullish for Bitcoin and others if the entity behind the inflow is planning to go on a buying run with this dry powder. There also exists the scenario, however, where the whale actually intends to trade away the USD Coin stack in favor of fiat rather than using it to buy other cryptocurrencies. In such a case, a net amount of capital would be exiting the sector, which would be a bearish sign. Related Reading: Dogecoin Soars 17% To Break $0.21 As Volume Explodes It now remains to be seen whether the massive USDC deposit indeed ends up causing any noticeable fluctuations in the volatile side of the market, particularly in the price of Bitcoin. Bitcoin Price Bitcoin had observed sharp bullish momentum earlier to cross above the $70,000 level, but since then, the asset has fallen back to sideways movement, with its price remaining unchanged. The price of the coin appears to have been consolidating in the last few days | Source: BTCUSD on TradingView Featured image from iStock.com, CryptoQuant.com, chart from TradingView.com
The positive Bitcoin Coinbase Premium that drove the latest rally above $70,000 has dissipated, suggesting buying has already slowed down. Bitcoin Coinbase Premium Gap Has Returned To Neutral Levels CryptoQuant Netherlands community manager Maartunn explained in a post on X that the Bitcoin Coinbase Premium Gap has declined back toward the neutral line. The Coinbase [...]
The post Bitcoin Coinbase Premium Returns To Neutral: Buying Push Already Over? appeared first on Crypto Breaking News.
The on-chain analytics firm Santiment has revealed the altcoins that have recently surged into the mid-term “opportunity zone.” These Altcoins May Be More Likely To See Rebounds In a new post on X, Santiment has discussed what the various altcoins in the market are looking like from the perspective of the MVRV. The “Market Value To Realized Value” (MVRV) refers to an indicator that keeps track of the ratio between the Bitcoin market cap and the realized cap. The realized cap here is a capitalization model for BTC that measures the total sum of capital that the investors have used to purchase their coins. As such, the MVRV tells us about how the value that the investors are holding right now (the market cap) compares against this initial investment. Related Reading: Bitcoin Plunges Under $63,000, Heres Where Next On-Chain Support Is Historically, the more profits the investors have held (that is, the higher the market cap has been compared to the realized cap), the more likely tops have been to occur. This is naturally because investors become more likely to give in to the allure of profit-taking the higher their gains get. On the other hand, cryptocurrencies have been probable to see rebounds when holders’ returns have dropped into the negative territory. In these conditions, there aren’t many profit-takers left, so selling pressure begins to run out. Based on these facts, Santiment has come up with an “Opportunity & Danger Zone Model” that uses the MVRV’s divergence from the norm on various timeframes to determine if an asset is providing a potential window for selling or buying right now. Below is the chart shared by the on-chain analytics firm that reveals what this model is saying for altcoins around the sector: Looks like some of the coins are approaching the opportunity zone | Source: Santiment on X From the graph, it’s visible that a lot of coins are still inside the overbought territory, but several altcoins have managed to sneak into the mid-term opportunity zone following the recent market downturn led by Bitcoin’s plunge. “This zone gets breached when an asset’s 30-day, 90-day, and 365-day average wallet returns are combining to be in negative territory,” explains Santiment. It should be noted, though, that while mid-term returns are red for these coins, they are still not yet inside the buy zone proper. “In a zero sum game like crypto, projects with minimal returns compared to the rest of the sector have a higher probability of a more efficient rebound for those who are willing to #buythedip on projects traders are in the most pain on,” notes the analytics firm. Related Reading: Bitcoin Has Undergone This Bearish Structure Change, Analyst Explains According to Santiment, some of the best altcoin candidates who are inside the mid-term opportunity zone include Lido DAO (LDO), Synthetix (SNX), Storj (STORJ), and OMG Network (OMG). LDO Price Lido DAO has had a bad time recently as its price has gone down more than 31% over the past week. With these red returns, it’s no wonder that the coin is becoming underbought on the MVRV. The price of the altcoin appears to have plunged down in the last few days | Source: LDOUSD on TradingView Featured image from Shutterstock.com, Santiment.net, chart from TradingView.com
World Crypto Global opens the door to digital freedom for everyone.
Manage your free WCG Coins securely—where simplicity meets global accessibility.
FREE CRYPTO COINS
AVAILABLE FOR RESERVATION
ALREADY ALLOCATED

No fees. No catch. Your crypto journey starts here.