W o r l d . C r y p t o . G l o b a l

Loading

Welcome at World Crypto Global. This portal is packed with useful content and resources to built out your own crypto skills. WorldCrypto is a site member of Gabriel Vega Network.

Contact Info

CATEGORY: mvrv


Sep 25, 2024 05:50

Bitcoin MVRV Ratio Is At A Critical Retest: Can Bulls Triumph?

On-chain data shows the Bitcoin Market Value to Realized Value (MVRV) Ratio of the short-term holders is currently making a retest that could prove significant for BTC’s price. Bitcoin STH MVRV Ratio Is Retesting Its 155-Day MA Right Now As explained by on-chain analyst Checkmate in a new post on X, the short-term holder MVRV [...]

The post Bitcoin MVRV Ratio Is At A Critical Retest: Can Bulls Triumph? appeared first on Crypto Breaking News.

Jul 04, 2024 12:05

These Are The Altcoins In Buy Zone, Analytics Firm Reveals

The on-chain analytics firm Santiment has revealed the altcoins that are currently in the historical buy zone according to a fair value model. A Large Amount Of Altcoins Are Currently Near The Opportunity Zone In a new post on X, Santiment talked about what the various assets in the cryptocurrency sector are looking like right now based on their Market Value to Realized Value (MVRV) ratios. The MVRV ratio is an indicator that keeps track of the profit/loss status of the addresses on any given network. When the value of this indicator is greater than 1, it means the investors are carrying a net amount of profits right now. On the other hand, the metric under this threshold implies the dominance of losses in the market. Related Reading: Crypto Analyst Says Next Bitcoin Target Is $78,700 If BTC Breaks This Resistance Naturally, the MVRV ratio being exactly equal to 1 suggests the unrealized loss on the network is exactly equal to the unrealized profit, so the average holder could be considered just breaking even. Historically, corrections have become more probable when investor profits have ballooned up. Holders become more tempted to sell the larger their gains grow. Similarly, holders getting underwater has facilitated bottom formations, as sellers become exhausted during such conditions. Based on these facts, Santiment has developed an Opportunity and Danger Zone Model that uses the MVRV ratio’s divergence on different timeframes to estimate better whether an asset is currently providing a buying or selling window. Now, here is the chart shared by the analytics firm that shows where the different altcoins stand according to this model: Note that in this model, the zero mark takes the role of the neutral 1 level from the MVRV ratio. Also, the polarity is flipped here, with values under zero implying profit dominance and those above signifying loss. The graph shows that most of the altcoins are in the positive region right now, suggesting that their investors are underwater. Among these, Basic Attention Token (BAT), Chromia (CHR), and Highstreet (HIGH) particularly stand out as their MVRV divergence exceeds the 1 mark. Related Reading: PEPE Bullish Signal: Whale Withdraws $14.7 Million Stack From Binance Under this model, the region above 1 is called the “Opportunity Zone,” as assets have historically offered the most profitable opportunities while inside it. While most altcoins are at least slightly undervalued currently, a few, like Ethereum Name Service (ENS), MANTRA (OM), and Reserve Rights (RSR), are in or near the Danger Zone instead. The Danger Zone, which occurs under -1, is the counterpart to the Opportunity Zone, where coins become overvalued. Ethereum Price Ethereum, the largest among the altcoins, has faced a plunge of more than 4% in the last 24 hours, which has taken its price under the $3,300 level. Featured image from Shutterstock.com, Santiment.net, chart from TradingView.com

Jul 28, 2024 12:05

Shiba Inu, XRP Forming Bullish Divergence, Analytics Firm Reveals

The on-chain analytics firm Santiment has revealed how Shiba Inu and XRP are among altcoins that are seeing a bullish divergence on the MVRV Z-Score. MVRV Z-Score Says XRP And Shiba Inu Traders Are Seeing Losses Currently In a new post on X, Santiment has discussed how the various top coins in the cryptocurrency sector look on the MVRV Z-Score. The “Market Value to Realized Value (MVRV) ratio” is a popular indicator that, in short, measures the deviation between the total value held by the investors of an asset (that is, the market cap) and what they used to purchase it (the realized cap). When the value of this indicator is positive, it means the holders of the given coin as a whole are currently holding net unrealized profits. On the other hand, the metric being below zero suggests the dominance of losses in the market. Related Reading: Bitcoin Crashes To $64,000: Will This Historical Support Hold? Now, here is the chart shared by the analytics firm that shows the trend in the MVRV Z-Score for different top assets by market cap over the past few months: As displayed in the above graph, Bitcoin (BTC), Ethereum (ETH), Dogecoin (DOGE), and Toncoin (TON) are all currently in the positive territory of the MVRV Z-Score, suggesting that their average traders are currently enjoying profits. At the same time, XRP (XRP), Cardano (ADA), Shiba Inu (SHIB), Chainlink (LINK), Polygon (MATIC), and Uniswap (UNI) are witnessing their investors carrying a higher unrealized loss than profit. Generally, the investors in profits are more likely to sell their coins, and the likelihood of this profit-taking only increases with more gains they hold. As such, a high MVRV Z-Score has historically led to tops for any cryptocurrency’s price. Related Reading: Cardano Among Alts Likely To See Price Boosts, Santiment Says Of the four assets in positive territory of the indicator right now, Toncoin has the indicator at the highest level, suggesting that a selloff due to profit-taking could be probable for it. In the case of the coins inside the negative region, their prices could see a bullish outlook instead, as there may not be many sellers left for them now. Shiba Inu and Uniswap are particularly seeing the most deviation between the market and realized cap. “If you believe markets are about to surge, history says that buying into assets that traders have experienced the most pain in have a greater probability of netting high returns for you,” notes Santiment. As such, coins like SHIB may be offering the best buying window right now, according to the MVRV Z-Score. SHIB’s Price Analysis Shiba Inu has consolidated sideways over the past month as its price still trades around the $0.0000168 mark. Featured image from Shutterstock.com, Santiment.net, chart from TradingView.com

Jul 02, 2024 12:05

Shiba Inu Underbought, While Bitcoin Overbought Recently: Santiment

According to this metric, the on-chain analytics firm Santiment has revealed Shiba Inu has been underbought recently, while Bitcoin is overbought. MVRV Z-Score Suggests Shiba Inu Has Been Undervalued Recently In a new post on X, Santiment has discussed how some of the top cryptocurrencies are looking like right now on their MVRV Z-Score. The “Market Value to Realized Value” (MVRV) refers to a popular on-chain indicator that keeps track of the ratio between the market cap and realized cap for any given asset. The realized cap here is a capitalization model that calculates the total valuation of the cryptocurrency by assuming that the ‘real’ value of any token in circulation is equal to the price at which said coin was last transacted on the blockchain. Related Reading: Solana (SOL) Surges 18%, But Watch Out For Crowd FOMO As the previous transaction of any coin was the last time it changed hands, the price at its time would denote its cost basis. Thus, the realized cap is a sum of the cost basis of all tokens in the circulating supply. Put another way, this model measures the total capital the investors used to purchase the asset’s supply. The market cap, in contrast, keeps track of the value these investors hold. As such, the MVRV, which compares these two metrics, tells us about the profit/loss situation of the investors as a whole. In the context of the current topic, the actual metric of interest is the “MVRV Z-score.” This indicator takes the difference between the market cap and the realized cap and divides it by the standard deviation of the market cap over the asset’s entire history. Now, here is the chart shared by Santiment that shows the trend in this indicator for various coins in the sector: Based on the MVRV Z-Score, Santiment has defined three zones that relate to how far from its fair value the asset is. The chart shows that Shiba Inu (SHIB) and Uniswap (UNI) have had the indicator at -1.55 and -1.96 recently, putting these assets inside the ‘underbought’ territory. At these MVRV Z-Score values, the market cap is significantly lesser than the realized cap, meaning investors are widely lost. Generally, profit holders are a more likely source of selling pressure in the market, so when there are few of them left, price corrections can become less probable. Related Reading: Retail Losing Interest In Bitcoin? Volume Plunges 30% This is why assets are considered undervalued when the indicator drops below the -1 level for them. Due to a similar reasoning, values above 1 correlate to the coin being overvalued. Bitcoin (BTC), Ethereum (ETH), and Toncoin (TON) have recently been inside this latter territory, suggesting that their prices could be in danger of seeing bearish action. Shiba Inu and Uniswap, on the other hand, could be better set up for a price surge. SHIB Price At the time of writing, Shiba Inu is trading around $0.0000171, up 2% over the past week. Featured image from Shutterstock.com, Santiment.net, chart from TradingView.com

Jun 04, 2024 12:05

Crypto Analyst Says Bitcoin Will Rise To $79,600 If This Holds

An analyst has explained how Bitcoin will “likely rise to test” the $79,600 level if BTC can hold above this important level of a pricing model. Next Bitcoin MVRV Pricing Band Is Currently Valued At $79,600 In a new post on X, analyst Ali Martinez has talked about where BTC’s next destination could be based on an on-chain pricing model. The model uses the popular “Market Value to Realized Value” (MVRV) indicator. This metric tells us how the value that the Bitcoin investors hold right now (that is, the market cap) compares against what they put in (the realized cap). Related Reading: Ethereum Investors Take On Sky-High Leverage: Brace For Volatile Storm? When the value of this indicator is greater than 1, it means that the holders as a whole are carrying a value higher than their initial investment; that is, they are in net profits. On the other hand, the MVRV being less than this threshold implies that the overall market is underwater at the moment. There are a couple of pricing models based on this metric, but in the context of the current discussion, the “MVRV extreme deviation pricing bands” are of interest. This model’s standard deviations around the MVRV mean signify the relevant price levels. Below is a chart that shows how these levels currently look for Bitcoin. As the graph shows, Bitcoin is currently trading above the +0.5 pricing band. At the price level corresponding to this 0.5 level ($66,800 right now), BTC’s MVRV value becomes 0.5 standard deviations above its mean value. According to this model, the next level of interest is the +1, where the MVRV is 1 standard deviation over its mean. The price level at which the MVRV ratio would satisfy this condition is $79,600. Historically, tops in the cryptocurrency have tended to form when the price breaches past this MVRV pricing band level. From the chart, it’s visible that BTC surpassed this level earlier in the year when it set its new all-time high, which continues to be the peak of the rally so far. Related Reading: Bitcoin Realized Volatility Showing Very Rare Trend: What Could Be Next Ali suggests that if Bitcoin can continue to hold above $66,800 (the +0.5 pricing band level), the asset will “likely rise to test the 1.0 pricing band at $79,600.” A potential rally to this level would imply an increase of more than 14% for BTC from its current price. Why do tops tend to be more probable to happen above the +1 MVRV pricing band? The reason could lie in the fact that when the MVRV attains values this high, the investors are holding considerable profits, so they are more likely to participate in a mass selloff. BTC Price Bitcoin witnessed a retest of the +0.5 pricing band earlier, but the level has continued to hold so far, as the coin has rebounded to $69,500 since then. Featured image from Dall-E, Glassnode.com, chart from TradingView.com

Jun 20, 2024 12:05

Dogecoin, Cardano Very Bullish Based On MVRV: Santiment

The on-chain analytics firm Santiment has revealed that Dogecoin and Cardano are two assets that look “very bullish” according to this metric. Dogecoin & Cardano Currently Have Low 30-Day MVRV Ratios In a new post on X, Santiment has discussed about how some of the top assets in the cryptocurrency sector are looking like right now in terms of the Market Value to Realized Value (MVRV) Ratio. The MVRV Ratio is a popular on-chain indicator that keeps track of the ratio between the market cap and realized cap for any given coin. The market cap here naturally refers to the simple total valuation of the asset’s supply at the current price. The realized cap is also a method of calculating the valuation of the cryptocurrency, but the twist here is that this model doesn’t take the value of all tokens in circulation the same as the spot price. Rather, this model assumes that the “real” value of any coin is the same as the price at which it was last transferred on the blockchain. Related Reading: Hard To Be Too Scared Of Bitcoin Price Action, Says Analyst. Heres Why Generally, the last transaction can be assumed to be the last point at which the coin changed hands, so the price at its time could be considered to be its current cost basis. As such, the realized cap basically calculates the sum of the cost basis of every coin in circulation. One way to view the model, therefore, is as a measure of the total amount of capital that the investors have used to purchase the total Bitcoin supply in circulation. Since the MVRV ratio compares the market cap, which represents the value that the investors are holding right now, against this initial investment, its value can tell us about the profit-loss status of the market as a whole. Now, here is the chart shared by the analytics firm that reveals the recent trend in the 30-day MVRV ratio of six top coins: Bitcoin (BTC), Ethereum (ETH), XRP (XRP), Dogecoin (DOGE), Toncoin (TON), and Cardano (ADA). The 30-day MVRV Ratio only includes the data for the investors who bought their coins within the past month. Thus, its value reflects the profit-loss balance of these new buyers. From the graph, it’s visible that the indicator is at negative levels for all of these assets right now, implying that the 30-day investors would be at a loss. This may not actually be bad, though, as Santiment notes, “the lower a cryptocurrency’s 30-day MVRV is, the higher the likelihood we see a short-term bounce.” At present, Bitcoin, Ethereum, and XRP are seeing small negative values, suggesting that these assets may be slightly undervalued. The metric stands at just -0.6% for Toncoin, though, implying that TON is more or less neutral currently. Related Reading: XRP, Dogecoin, & Shiba Inu All See Negative Sentiment: Signal To Buy? Dogecoin and Cardano, on the other hand, stand out with their 30-day MVRV Ratios of -16.7% and -12.6%, respectively. These values are deep enough that Santiment has labelled these coins as “very bullish.” It now remains to be seen how DOGE and ADA develop in the coming days, given this potential positive signal in the MVRV Ratio. DOGE Price Dogecoin has been riding on bearish momentum over the last couple of weeks as its price has now dropped to $0.125. Featured image from Dall-E, Santiment.net, chart from TradingView.com

Jun 20, 2024 02:30

Cardano, Dogecoin, XRP Set for Explosive Gains

Attention crypto investors! Large-cap coins like Cardano, Dogecoin, and XRP are on the verge of explosive gains. Based on 30-day Market Value to Realized Value [MVRV], Santiment has compiled a list of leading crypto assets flashing strong signals of a short-term bounce. The first on the list is Cardano’s ADA whose price surge on the […]

May 24, 2024 12:05

Is $77,600 The Next Step For Bitcoin? On-Chain Pricing Model Hints So

Data from a Bitcoin pricing model based on an on-chain indicator suggests that $77,600 may be the level where the asset will see its next peak. Bitcoin MVRV Pricing Bands Could Provide Hints About What’s Next In a new post on X, analyst Ali discussed what the Market Value to Realized Value (MVRV) Pricing Bands model could suggest about the cryptocurrency’s future. The MVRV ratio is a popular on-chain indicator that compares the Bitcoin market cap and realized cap. The former is just the total valuation of the asset at the current spot price, while the latter is a model that calculates the asset’s cap by assuming the “true” value of any coin in circulation is the price at which it was last transferred on the blockchain. Related Reading: Ethereum Whales Come Alive: Are They Buying Or Selling? The previous transfer of any coin on the network was likely the last time it changed hands, and thus, the price at that time would be its current cost basis. As such, the realized cap keeps track of the sum of the cost basis of every investor in the market. Therefore, the MVRV ratio tells us how the value the investors hold (the market cap) compares against the value they put in (the realized cap). Based on this indicator, the on-chain analytics firm Glassnode has developed a pricing bands model. Below is a chart showing what these pricing bands look like. The pricing bands in this model represent levels corresponding to a specific deviation from the mean for the MVRV ratio. From the chart, it’s visible that the cryptocurrency is currently above the price level, corresponding to a +0.5 standard deviation (SD) from the mean for the indicator. More specifically, the price level around $65,100 would be where the MVRV ratio would be +0.5 SD above its mean. The next major pricing band in this model is +1 SD, which currently corresponds to around $77,600. In the past, this level has been where at least local tops have been probable to form for BTC. As is visible in the graph, the rally top back in March also occurred when BTC broke this level. “Based on the MVRV Pricing Bands, if Bitcoin continues to trade above $65,125, the next local BTC top before a brief correction could be around $77,593!” notes the analyst. Related Reading: Crypto Analyst Reveals Trigger For 17% Polygon (MATIC) Rally From the current spot price of the cryptocurrency, a potential rally to a new all-time high of $77,593 would mean an increase of more than 11% for the asset. It now remains to be seen how the asset’s price will develop from here and whether it will be able to maintain above the +0.5 SD MVRV level. BTC Price Since its sharp surge earlier, Bitcoin’s bullish momentum appears to have cooled off as the asset has fallen to sideways movement around the $69,700 mark. Featured image from Kanchanara on Unsplash.com, Glassnode.com, chart from TradingView.com

May 18, 2024 12:05

Analyst Utilizes Supply And Demand Principles To Determine Bitcoin Price

For analysts and investors alike, comprehending the variables that influence price action in the complex world of cryptocurrency markets is essential. Ali Martinez, a well-known cryptocurrency expert, has recently provided insights into the fluctuations in the price of Bitcoin by applying the basic economic theory of supply and demand.  Understanding Bitcoin Prices Through Supply And Demand It is worth noting that any asset’s price movement, including cryptocurrencies, is determined by the fundamental rules of supply and demand. An asset’s price tends to decrease when supply outpaces demand, while prices typically increase when supply cannot keep up with demand.  Related Reading: The Hidden Forces Behind Bitcoin Price: Latest Insights From On-Chain Data Thus, Ali Martinez has deduced the crypto asset’s price and holders’ behaviour by applying the method and other on-chain metrics. Martinez’s analysis demonstrates how fluctuations in the market’s buying interest and the availability of Bitcoin are key factors influencing its price trajectory. According to Martinez, Bitcoin’s Realized Cap witnessed a significant increase mid-way through March when BTC hit a new all-time high of $73,000. This indicated that the majority of BTC’s long-term holders were likely yielding gains at the time. As a result, several investors sold their holdings, which led to a sharp rise in realized profits. Following realized profits in March, long-term holders felt safe adding over 70,000 BTC to their investments at these prices. Meanwhile, when the market’s growing supply of Bitcoin exceeded demand, the coin saw a substantial correction from the $73,000 level to the $57,000 level.  Given that short-term holders are more likely to sell their holdings due to price volatility, this decline took Bitcoin below its realized price for short-term holders, inciting fear in the market. However, despite investors’ concerns, the short-term holder’s Realized Price at the $65,500 level acted as an accumulation point. On the basis of this principle, Martinez believes the likelihood of Bitcoin continuing its upward trajectory will only increase when demand for the cryptocurrency starts to exceed the supply of BTC accessible in the market. Using BTC On Exchanges To Support The Principles Martinez has underscored that the available BTC on crypto exchanges can be used to confirm these supply and demand laws. He further noted that over 30,000 BTC have been moved to private wallets for long-term storage in May, indicating confidence among holders in the potential worth of Bitcoin. Related Reading: Bitcoin Long-Term Holders Accumulating Like In 2021: Is BTC Ready For A 15X? Observing Bitcoin’s price using the MVRV Extreme Deviation Pricing Bands, Martinez cited a retracement above the +0.5 pricing band at $64,600. Such an upswing has historically caused BTC to test the pricing range of 1.0, which is backed by increasing demand. Meanwhile, this price range at the moment is roughly lingering at $77,000. Presently, the price of Bitcoin is trading at $66,275, indicating an over 5% increase in the past week. Although prices are up, its trading volume has declined by 24%, while its market cap is up by 0.23%. Featured image from iStock, chart from Tradingview.com

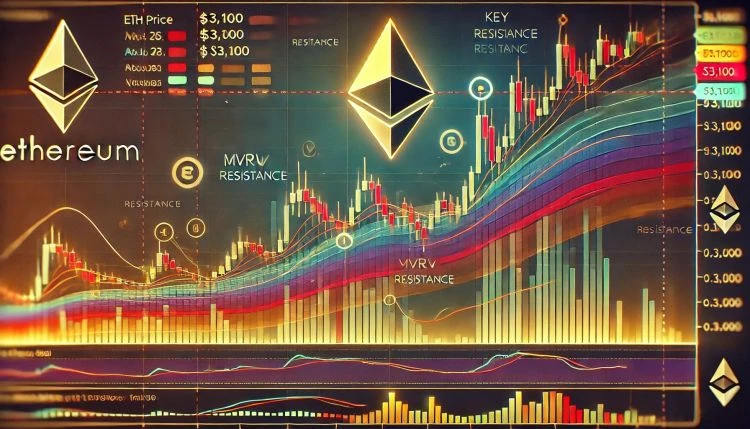
Ethereum MVRV Pricing Bands Show Key Resistance Around $3,100 Level  Details

Author: Sebastian Villafuerte
United Kingdom
May 15, 2025 12:05

Ethereum MVRV Pricing Bands Show Key Resistance Around $3,100 Level Details

Ethereum is trading firmly above the $2,600 mark after a surge in buying pressure over the past several days, marking a strong shift in momentum across the broader market. After months of choppy action and bearish sentiment, bulls are clearly back in control. ETH has reclaimed several key levels with conviction, signaling a potential continuation toward higher targets. Related Reading: XRP Open Interest Surges 41% As Speculation Grows Over $1B Added In Just One Week Price action now looks structurally bullish, with Ethereum pushing through resistance zones that previously capped upside for weeks. This rally has reignited investor confidence and brought renewed attention to Ethereums medium-term outlook, especially as altcoins start to show strength alongside Bitcoins recent consolidation. According to fresh data from Glassnode, the next major resistance area to watch is at $3,100, where Ethereum is likely to encounter heavier sell pressure. This level, derived from pricing bands, now defines Ethereums current trading range and will likely dictate price direction in the coming sessions. With volatility returning and sentiment improving, Ethereum appears poised for a critical breakout or a decisive retest of support, depending on how bulls handle the next leg. Ethereum Nears Key Resistance As Altseason Expectations Grow Ethereum has rallied over 98% since its April 9th low, marking one of its most powerful recoveries in recent years. This explosive move has not only flipped sentiment from bearish to bullish, but also reignited speculation around a broader altseason a period in which altcoins significantly outperform Bitcoin. After months of heavy selling pressure that began in late December, Ethereum is now showing sustained strength for the first time. The price has reclaimed critical levels, and momentum continues to build as traders and investors rotate capital back into ETH and other large-cap altcoins. Market participants are watching closely to see if Ethereum can maintain this pace and confirm a longer-term trend reversal. Top analyst Ali Martinez shared Ethereums MVRV Extreme Deviation Pricing Bands, offering a clear technical framework for whats next. According to the data, the next key resistance level is at $3,100 a region that could act as a short-term ceiling if buying pressure fades. On the downside, the major support zone sits at $2,233, a critical level to hold in the event of a pullback. As Ethereum continues to climb, these levels will become increasingly important. A clean breakout above $3,100 could open the door to a broader rally across altcoins, while a rejection or correction would likely test the markets true conviction. For now, ETH remains in a bullish structure, supported by growing volume, on-chain signals, and renewed investor enthusiasm. The coming days will be crucial in determining whether Ethereum leads the charge into a full-fledged altseason. Related Reading: Solana Network Activity Grows As 11M Wallets Now Hold 0.1 SOL Or More Analyst ETH Price Action: Testing Resistance After Massive Rally Ethereum (ETH) is currently trading around $2,604, consolidating after a sharp surge that lifted it from under $1,400 to a high of $2,725 in just two weeks. The daily chart shows that ETH is now approaching the 200-day simple moving average (SMA) at $2,702.60, which is acting as a key resistance level. This zone also coincides with recent local highs from early February, making it a critical area to break for further upside continuation. The recent rally brought strong volume and bullish momentum, with ETH closing multiple daily candles above the 200-day exponential moving average (EMA) at $2,435.66. This is a positive sign for trend reversal after months of sustained bearish pressure. However, todays pullback signals that bulls are losing some steam as the price tests this crucial resistance. Related Reading: Ethereum Recovery Gains Strength: Massive Comeback Above Key Support If ETH can consolidate above the $2,500$2,600 range and break through the 200-day SMA with convincing volume, the next upside target lies near the $3,100 level, as noted in recent technical studies. On the downside, maintaining support above $2,435$2,450 is essential to avoid a deeper correction. The coming days will reveal whether Ethereum can turn this consolidation into a true breakout or if further cooling is needed before the next leg up. Featured image from Dall-E, chart from TradingView

Apr 10, 2025 12:05

Ethereum May Be Headed To $1,200 Can ETH Make A Comeback? Analysts Explain

Ethereum (ETH) has plunged 30% over the past two weeks, reflecting broader weakness across the crypto market as the global economy reels from escalating tariff wars. Crypto analyst Ali Martinez warns that ETH could fall even further in the near term, potentially testing the $1,200 level. More Pain For Ethereum, But A Recovery Is Possible Ethereum continues to struggle amid global economic pressures. The worlds second-largest cryptocurrency by market cap has dropped another 8.3% in the past 24 hours and is currently trading in the mid-$1,000 range. Related Reading: Is Ethereum Breaking Free from the Bear Trap? Analysts Weigh In Commenting on the recent price action, seasoned analyst Martinez highlighted that ETH could find key support at the $1,200 mark. He shared the following daily chart of ETH, showing how the digital asset has broken through multiple support levels since December 2024, when it was trading near $4,000. Meanwhile, renowned analyst Carl Moon noted that ETH is currently trading below its realized price of $2,000. He pointed out that the last time this occurred – back in March 2020 at the height of the COVID-19 pandemic – ETH had dropped from $289 to $109. On a more optimistic note, Moon added that ETH recovered swiftly after that steep decline. Based on historical trends, the current price level could present a potential buying opportunity for long-term investors. For those unfamiliar, the realized price for accumulation addresses – as shown in the above CryptoRank chart – represents the average price at which long-term holders acquired ETH. This metric has historically acted as a strong support zone. Is ETH About To Surprise The Market? With market sentiment approaching historical lows, confidence in ETH appears to be dwindling. The Ethereum Fear & Greed Index currently sits at 20, indicating “extreme fear” among investors. Related Reading: Is Ethereum Repeating Its 2020 Trend Reversal? Analyst Predicts ETH To Explode In Q2 2025 Despite the bearish mood, some on-chain metrics and historical patterns suggest ETH could be on the verge of a strong bullish reversal – potentially catching investors off guard. For example, crypto analyst Mister Crypto recently drew a comparison between ETHs current price action and that from 2020, suggesting that Ethereum could embark on a price rally by Q2 2025. Similarly, Ethereums Market Value to Realized Value (MVRV) Z-score hints that ETH may be undervalued at current price. The last time it was this undervalued – in October 2023 – it witnessed a sharp rally of 160%. That said, not all indicators are bullish. Rising ETH exchange reserves continue to raise concerns about potential sell pressure from holders. At press time, ETH is trading at $1,457, down 8.3% over the past 24 hours. Featured image from Unsplash, charts from X and Tradingview.com

Apr 10, 2024 01:10

Bitcoins MVRV ratio shows LTHs move the market while STHs react

The market value to realized value (MVRV) ratio is one of the most important indicators for analyzing the Bitcoin market. It measures the ratio between the market cap (the current price of Bitcoin multiplied by the total number of coins in circulation) and the realized cap (the sum of the value of all coins in […]

The post Bitcoins MVRV ratio shows LTHs move the market while STHs react appeared first on CryptoSlate.

Apr 09, 2024 12:05

Polygon (MATIC) In Buy Zone That Earlier Led To 112% & 87% Surges

On-chain data shows Polygon (MATIC) is currently inside the same buy zone that earlier led to rallies of around 112% and 87% for the asset. Polygon 30-Day MVRV Ratio Is Significantly Negative Currently As pointed out by analyst Ali in a post on X, MATIC is showing a historically bullish pattern in its 30-day MVRV ratio. The “Market Value to Realized Value (MVRV) ratio” here refers to an on-chain indicator that keeps track of the ratio between the Polygon market cap and realized cap. The realized cap is a capitalization model that calculates the total valuation of the cryptocurrency by assuming that the “real” value of any coin in circulation isn’t the current MATIC spot price, but rather the price at which it was last transferred on the blockchain. Related Reading: Dogecoin Whale Takes $52.3 Million In DOGE Off Binance, Sign Of Buying? Considering that the last movement of any coin was the last time it changed hands, the price at its time would serve as its current cost basis. As such, the realized cap essentially sums up the cost basis of every coin in circulation. Put another way, the realized cap is a measure of the total amount of capital the investors have put into the asset. Since the MVRV ratio compares the value the holders are carrying right now (that is, the market cap) against this initial investment, its value can tell us about the profit-loss status of the market as a whole. Now, here is a chart that shows the trend in the 30-day version of the Polygon MVRV ratio, which tells us about the profit-loss balance specifically for the investors who bought within the past month: The value of the metric seems to have been quite low in recent days | Source: @ali_charts on X In the graph, the 30-day MVRV ratio has been displayed in terms of a percentage, with the 0% mark aligning with the scenario where the market cap and realized cap are equal. It’s visible that the indicator has registered some steep drawdown for Polygon recently and has dipped deep inside the negative territory. This would imply that the investors who bought within the last 30 days have entered into notable losses. The latest levels of the metric have been low enough to qualify for a zone that has provided profitable buying opportunities in the past. “Historically, the last two entries into this zone saw MATIC surge by 112% and 87%,” notes the analyst. Related Reading: Polygon Observes Buy Signal: Analyst Suggests MATIC Rebound To This Level A possible explanation behind this pattern could be the fact that as these 30-day investors enter into losses, the selling pressure in the market goes down as there aren’t many profit-takers left. This naturally facilitates for bottoms to take place. It now remains to be seen whether this past pattern would repeat for Polygon this time as well, and if it does, whether any resulting surge would be of a similar scale or not. MATIC Price Polygon has registered a 3% surge in the past day, with its price now floating above $0.93. Given the timing, it’s possible the MVRV ratio buy signal may already be in effect. Looks like the price of the coin has shot up over the past day | Source: MATICUSD on TradingView Featured image from GuerrillaBuzz on Unsplash.com, Santiment.net, chart from TradingView.com

Apr 28, 2025 12:10

Dogecoin MVRV Returns To This Crucial Level DOGE Price Up 400% The Last Time

The altcoin market has been one of the most-affected segments of the crypto industry by the uncertainty that has clouded the global financial markets in the past few months. For instance, Dogecoin the largest meme coin by market capitalization  lost over 55% of its value in the first quarter of 2025. However, things seem to be looking up for the DOGE token, as its price jumped by nearly 15% in the past week. According to the latest on-chain observation, this recent rally might just be the beginning of another leg up for the meme coin over the coming weeks. Is A Sustained Bull Run On The Cards For DOGE? In an April 26 post on the X platform, pseudonymous crypto analyst Cryptollica posited that the price of Dogecoin could be gearing up for an extended bullish period over the next few weeks. This projection is based on the changes in the MVRV metric, which tracks the ratio of a coins market cap to its realized cap. Related Reading: Ethereum Price Reaches Last H1 Support, Next Major Resistance Comes Into View The MVRV ratio basically tells how much value the investors hold (the market cap) against the value they put in (the realized cap). Hence, when the value of this metric is greater than 1, it means that more investors are in profit at the moment. Meanwhile, a less-than-one value implies that most of the market is in the red. As such, a high MVRV ratio is generally viewed as a price top signal because investors show more propensity to offload their assets when they are in profit. On the flip side, when the metric is below the 1 threshold, it suggests that the market might be bottoming out. As observed in the chart above, the Dogecoin MVRV ratio seems to be thickening in and around the 1 threshold level. Besides its on-chain significance, this level has proven pivotal in certain trend reversals seen in the past, with the DOGE price bouncing back to a new local high each time the MVRV ratio persists around this mark.  The price of Dogecoin surged by 1,900% and 2,200% in August 2017 and August 2020, respectively, when the MVRV ratio was at its current level. The last time it was around this level in August 2024, the DOGE price rallied by more than 400% to surpass $0.5. Going by the historical precedent, there is a likelihood that the DOGE price could be preparing for a significant upward movement. Considering the improving market climate, a sustained bullish run might not seem completely out of the question anymore at this point. Dogecoin Price At A Glance After briefly touching the $0.19 mark in the early hours of Saturday, April 19, the DOGE price appears to have cooled off. As of this writing, the price of DOGE is hovering around $0.18, reflecting a 0.3% decline in the past 24 hours. Related Reading: Ethereum Flips Key Resistance Into Support Can Bulls Reclaim $2,000 Level? Featured image from iStock, chart from TradingView

Apr 28, 2025 12:10

Bitcoin MVRV At Critical Breakout Point Is A Price Rally Imminent?

The last trading week saw Bitcoin produce another price rebound as the premier cryptocurrency moved to reclaim the $95,000 price region. However, bullish momentum seems to have stalled in the past day amidst a minor retracement and an ongoing price consolidation.  Notably, speculations over Bitcoin’s ability to sustain the current uptrend also persist. Interestingly, popular crypto analyst Burak Kesmeci has shed some light on possible developments that could decide BTCs price movement in the immediate future. Related Reading: Bitcoin Coinbase Premium Gap Remains In Positive Zone What This Means For Price Bitcoin MVRV Faces Resistance At 365 SMA In an X post on Saturday, Kesmeci reports that the Bitcoin MVRV is now facing an important resistance at its 365-day simple moving average (365SMA). The analyst explains that potential developments from this situation are influential to Bitcoins mid-term future. The Bitcoin MVRV ratio (Market Value to Realized Value) is an important on-chain metric that measures whether Bitcoin trading price is relatively overvalued or undervalued compared to its realized price. Technically, the MVRV is used to indicate profitability, but this metric can also signal market stages, such as a price top/bottom, or identify the current price trend. Meanwhile, the MVRV 365SMA, which produces an average of all MVRV ratios over the past 365 days, represents a critical threshold for medium-term reversal. Typically, when the MVRV remains below the 365SMA, it signals a bearish market, while a crossover above the 365SMA is interpreted as a bullish confirmation. Following recent market developments, Bitcoins MVRV currently stands at 2.13, just slightly below its 365SMA at 2.14. To confirm a long-term bullish market despite recent gains, an upward crossover between the MVRV and its 365SMA must occur, signaling a potential medium-term trend reversal following the prolonged correction phase in early 2025. Related Reading: Ethereum Flips Key Resistance Into Support Can Bulls Reclaim $2,000 Level? Bitcoin Network Fees Climb By 42%  In other developments, on-chain analytics firm IntoTheBlock reports that Bitcoin network fees surged by 42% in the past week. During this time, traders spent $4.03 million on transaction fees, suggesting a high level of network engagement.  Meanwhile, crypto exchanges also recorded net withdrawals valued at $356 million. While this figure falls far lower from the $1.3 billion reported in the previous week, it indicates that many investors are still opting to keep their assets. Both the increase in network activity and sustained exchange outflows point to strong underlying demand and positive sentiment in the Bitcoin market. At the time of writing, Bitcoin continues to trade at $94,233 after a 0.78% decline in the past day. On larger timeframes, the premier cryptocurrency remains in profit with gains of 11.27% and 8.59% in the last seven and 30 days, respectively. Featured image from Pexels, chart from Tradingview

Apr 26, 2024 05:55

85% Of Altcoins In Opportunity Zone, Santiment Reveals

The on-chain analytics firm Santiment has revealed that over 85% of all altcoins in the sector are currently in the historical opportunity zone. MVRV Would Suggest Most Altcoins Are Ready For A Bounce In a new post on X, Santiment discussed how the altcoin market looks based on their MVRV ratio model. The Market Value [...]

The post 85% Of Altcoins In Opportunity Zone, Santiment Reveals appeared first on Crypto Breaking News.

Apr 26, 2025 12:05

Bitcoin Price Prediction: The Last Leg-Up That Confirms A Resounding Rally To $150,000

A new Bitcoin price prediction suggests that the flagship cryptocurrency needs just one more leg up to kickstart a powerful bullish move toward $150,000 and beyond. With Bitcoin getting ready to once again hit new all-time highs, technical formations suggest that this projected rally could be the final confirmation of a long-term breakout.   Bitcoin Price Roadmap To $150,000 ATH A new Bitcoin price analysis released by market expert CrediBull Crypto on X (formerly Twitter) predicts that BTC is gearing up for a massive surge to $150,000. The analyst shared a Bitcoin price chart, using Elliott Wave theory on the lower time frames to break down the roadmap to this new all-time high target.  Related Reading: Bitcoin Price Bullish Confirmation: What Needs To Happen For Next Leg Up To $130,000 Bitcoin is currently forming a 5-wave impulse move on the lower timeframe. The recent price action suggests that it has completed sub-waves i, ii, iii, iv, and v, collectively forming what appears to be Wave 1. Following this, the cryptocurrency experienced a collective pullback in Wave 2, which acted as support and now serves as a launchpad for the next major leg in Wave 3the longest and most explosive wave in an impulse sequence.   If the next wave completes to the upside, it would strongly suggest that Bitcoin is not in a corrective pattern but rather an impulsive trend that could take it to a six-figure valuation once again.  CrediBull Crypto has highlighted $89,000 as a critical level for Bitcoin. He suggested that if the cryptocurrency drops below this price zone before pushing higher, the Elliott Wave structure would likely morph into a 3-legged corrective pattern rather than a 5-wave impulse. This move would imply that the projected rally is not the start of a macro breakout, and the market may have to wait longer for a confirmation.  On the other hand, holding above $89,000 and printing a higher high would complete the anticipated final leg up, validating the start of the large Wave 3 on higher time frames. This bullish scenario would support a strong accumulation strategy, where price declines could become opportunities to buy as Bitcoin targets $150,000 or more.  MVRV Golden Cross Signals BTC Bull Rally Bitcoins Market Value to Realized Value (MVRV) ratio has formed a Golden Cross with its 365-day Simple Moving Average (SMA), according to fresh data shared by crypto analyst Ali Martínez. The analyst has shared an optimistic outlook for Bitcoin, highlighting that this technical event could spark the next BTC bull rally.  Related Reading: Bitcoin Price Following Analysts Prediction For Bullish Breakout, Heres The Target The Bitcoin chart, published via CryptoQuant, highlights the MVRV ratio surging above the long-term Moving Average. A rising MVRV ratio typically suggests that BTC holders are once again in profit, and sentiment is shifting from bearish to bullish. The last time this crossover occurred, Bitcoin saw a multi-month rally that pushed its price to new all-time highs. Featured image from Pixabay, chart from Tradingview.com

Ethereum Enters Historic Buy Zone As Price Dips Below Key Level  Insights

Author: Sebastian Villafuerte
United Kingdom
Apr 21, 2025 12:10

Ethereum Enters Historic Buy Zone As Price Dips Below Key Level Insights

Ethereum is currently trading at a critical resistance level as bulls attempt to regain momentum and push for a fresh high. The broader market remains under pressure as global uncertainty escalates, largely fueled by ongoing trade tensions between the United States and China. Last week, US President Donald Trump announced a 90-day tariff pause on all countries except China, intensifying concerns about an extended trade conflict that could destabilize global financial markets. Related Reading: Ethereum Trades At Bear Market Lows: Fundamentals Signal Major Undervaluation In this high-stakes environment, Ethereums price action is drawing close attention from investors and analysts. Top crypto analyst Ali Martinez shared that historically, the best Ethereum buying opportunities have emerged when the price drops below the lower MVRV (Market Value to Realized Value) Price Banda level that signals potential undervaluation. Notably, ETH is now trading precisely in that zone. This alignment between technical conditions and macroeconomic instability suggests that Ethereum could be entering a phase of accumulation, with long-term investors looking to capitalize on discounted prices. However, sustained upward momentum will depend on whether bulls can overcome immediate resistance and whether macro conditions improve. The coming days could prove pivotal for ETH as it tests both technical and psychological thresholds. Ethereum Dips Into Historical Opportunity Zone Ethereum is currently trading below key resistance levels after enduring several weeks of selling pressure and weak market performance. Since losing the crucial $2,000 support level, ETH has fallen roughly 21%, a clear indication that bulls have yet to regain control. Broader macroeconomic pressures, especially rising global tensions and uncertain trade conditions between the US and China, have further dampened market sentiment. These conditions have driven many investors to exit riskier assets like cryptocurrencies, leading to elevated volatility and reduced market participation. Despite this downtrend, some analysts believe Ethereum could be nearing a pivotal turnaround zone. According to Martinez, one of the best historical signals for Ethereum accumulation has been price action dipping below the lower bound of the MVRV Price Banda metric that compares market value to realized value to assess whether an asset is over- or undervalued. Currently, Ethereum is trading beneath that lower band. Martinez emphasizes that this positioning has typically preceded strong upside reversals, especially during periods of extreme market pessimism. While short-term volatility may persist, ETHs entry into this zone could present a rare opportunity for long-term investors to accumulate at historically discounted levelsif market conditions stabilize and sentiment shifts. Related Reading: Cardano Whales Offload 180 Million ADA In 5 Days Smart Profit-Taking? ETH Stalls In Tight Range Ethereum is currently trading at $1,610 after nearly a week of low volatility and sideways action. Since last Tuesday, ETH has remained locked in a tight range between $1,550 and $1,630, reflecting the markets uncertainty and hesitation to take a clear directional stance. This narrow trading zone highlights a period of price compression, often a precursor to a larger move in either direction. For bulls to regain momentum and shift sentiment, Ethereum must reclaim the $1,700 level and push decisively above the $2,000 mark. These levels not only serve as key psychological barriers but also represent critical zones of previous support that have now turned into resistance. A breakout above $2,000 would likely trigger renewed buying interest and set the stage for a potential recovery rally. Related Reading: Ethereum Price Stalls In Tight Range Big Price Move Incoming? However, if bearish pressure builds and the $1,550 floor is breached, Ethereum could quickly test the $1,500 support zone. A breakdown below that level would confirm further downside risk, potentially accelerating sell-offs and deepening the current correction. Until a breakout or breakdown occurs, traders should prepare for more consolidation and volatility as the market awaits a macro or technical catalyst. Featured image from Dall-E, chart from TradingView

Apr 19, 2024 05:55

Chainlink (LINK) Forms Bullish Pattern That Led To 50% Rally On Average

On-chain data shows that a Chainlink indicator is currently forming a pattern that has led to an average 50% increase for LINK in the past. Chainlink 30-Day MVRV Ratio Has Plunged In a new post on X, analyst Ali discussed the latest trend in Chainlinks 30-day MVRV ratio. The Market Value to Realized Value (MVRV) [...]

The post Chainlink (LINK) Forms Bullish Pattern That Led To 50% Rally On Average appeared first on Crypto Breaking News.

Apr 12, 2025 12:05

Bitcoin Dominance: BTCs MVRV Outpaces ETHs For Record 812 Days

On-chain data shows the Bitcoin Market Value to Realized Value (MVRV) Ratio is currently on a record streak against the metric for Ethereum. Bitcoin Has Continued To Dominate Ethereum In MVRV Recently In its latest weekly report, the on-chain analytics firm Glassnode has discussed about the divergence forming between Bitcoin and Ethereum. First, below is a chart that shows how the two cryptocurrencies have compared in terms of the Realized Cap growth since the start of the bull cycle. The “Realized Cap” here refers to an indicator that measures the total amount of capital that the investors of a given asset as a whole have invested into it. Changes in this metric, therefore, reflect the amount of capital going in/out of the cryptocurrency. Related Reading: Bitcoin Breakout Above This Level Could Set Stage For $208,550 Top, Analyst Says From the graph, it’s visible that Bitcoin has observed a massive increase of $468 billion in the Realized Cap since the bear market bottom back in November 2022. In this same window, Ethereum has seen inflows amounting to only $61 billion. As the analytics firm explains, This disparity in capital inflows between the two assets partly underscores why these assets have experienced diverging performance since 2023. Ethereum has experienced a relatively smaller inflow of demand and fresh capital this cycle, which has resulted in weaker price appreciation and a lack of a fresh ATH, despite Bitcoin prices reaching over $100k in December. Divergence between the assets has also formed in another metric: the MVRV Ratio. This indicator keeps track of the ratio between the Market Cap of an asset and its Realized Cap. Since the Market Cap represents the value the holders are carrying in the present, its comparison against the Realized Cap in the MVRV Ratio tells us about the profit-loss status of the investors as a whole. As is visible in the above graph, Bitcoin’s MVRV Ratio diverged from Ethereum’s around the start of the bull market. This implies that BTC investors have consistently enjoyed a higher amount of unrealized profits in this cycle. In the recent market downturn so far, ETH has taken a larger hit than BTC, so its MVRV Ratio has also declined at a faster rate. BTC investors as a whole are still in the green, but ETH holders are now underwater as the indicator for it has dipped under the 1 mark. Related Reading: 62.8% Of XRP Realized Cap Held By New Investors: Sign Of Fragility? To better showcase the disparity in the MVRV Ratio of the two coins, Glassnode has charted the difference between the two. As displayed in the graph, the difference between the Bitcoin and Ethereum MVRV Ratio has remained positive for 812 consecutive days now, which is the longest streak in history. BTC Price At the time of writing, Bitcoin is floating around $79,300, down over 3% in the last seven days. Featured image from Dall-E, Glassnode.com, chart from TradingView.com

Your Crypto Gateway

Claim 1,000
Free WCG Coins

World Crypto Global opens the door to digital freedom for everyone.
Manage your free WCG Coins securely—where simplicity meets global accessibility.

11 bn

FREE CRYPTO COINS

8.9 bn

AVAILABLE FOR RESERVATION

2.1 bn+

ALREADY ALLOCATED

× WCG Coin

🎉 Get 1,000 WCG Coins

No fees. No catch. Your crypto journey starts here.