W o r l d . C r y p t o . G l o b a l

Loading

Welcome at World Crypto Global. This portal is packed with useful content and resources to built out your own crypto skills. WorldCrypto is a site member of Gabriel Vega Network.

Contact Info

CATEGORY: mvrv ratio


Jul 28, 2024 12:05

Shiba Inu, XRP Forming Bullish Divergence, Analytics Firm Reveals

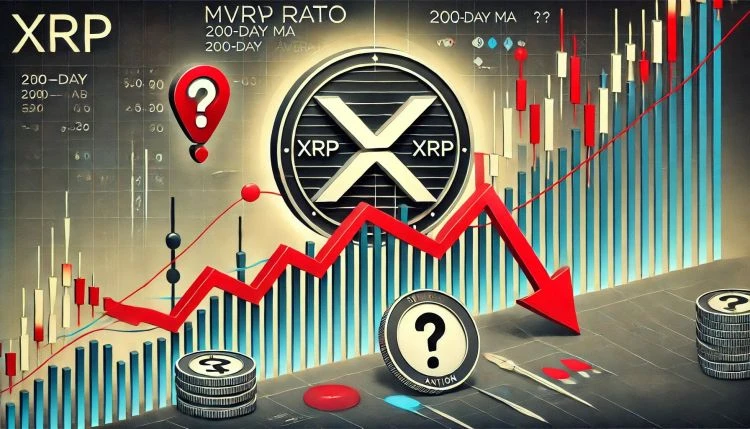
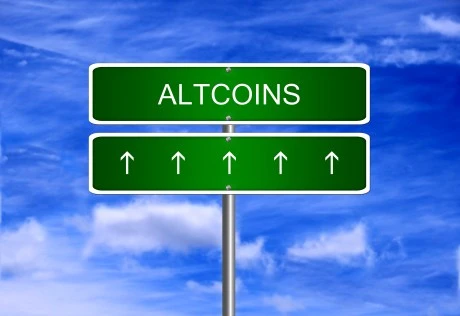
The on-chain analytics firm Santiment has revealed how Shiba Inu and XRP are among altcoins that are seeing a bullish divergence on the MVRV Z-Score. MVRV Z-Score Says XRP And Shiba Inu Traders Are Seeing Losses Currently In a new post on X, Santiment has discussed how the various top coins in the cryptocurrency sector look on the MVRV Z-Score. The “Market Value to Realized Value (MVRV) ratio” is a popular indicator that, in short, measures the deviation between the total value held by the investors of an asset (that is, the market cap) and what they used to purchase it (the realized cap). When the value of this indicator is positive, it means the holders of the given coin as a whole are currently holding net unrealized profits. On the other hand, the metric being below zero suggests the dominance of losses in the market. Related Reading: Bitcoin Crashes To $64,000: Will This Historical Support Hold? Now, here is the chart shared by the analytics firm that shows the trend in the MVRV Z-Score for different top assets by market cap over the past few months: As displayed in the above graph, Bitcoin (BTC), Ethereum (ETH), Dogecoin (DOGE), and Toncoin (TON) are all currently in the positive territory of the MVRV Z-Score, suggesting that their average traders are currently enjoying profits. At the same time, XRP (XRP), Cardano (ADA), Shiba Inu (SHIB), Chainlink (LINK), Polygon (MATIC), and Uniswap (UNI) are witnessing their investors carrying a higher unrealized loss than profit. Generally, the investors in profits are more likely to sell their coins, and the likelihood of this profit-taking only increases with more gains they hold. As such, a high MVRV Z-Score has historically led to tops for any cryptocurrency’s price. Related Reading: Cardano Among Alts Likely To See Price Boosts, Santiment Says Of the four assets in positive territory of the indicator right now, Toncoin has the indicator at the highest level, suggesting that a selloff due to profit-taking could be probable for it. In the case of the coins inside the negative region, their prices could see a bullish outlook instead, as there may not be many sellers left for them now. Shiba Inu and Uniswap are particularly seeing the most deviation between the market and realized cap. “If you believe markets are about to surge, history says that buying into assets that traders have experienced the most pain in have a greater probability of netting high returns for you,” notes Santiment. As such, coins like SHIB may be offering the best buying window right now, according to the MVRV Z-Score. SHIB’s Price Analysis Shiba Inu has consolidated sideways over the past month as its price still trades around the $0.0000168 mark. Featured image from Shutterstock.com, Santiment.net, chart from TradingView.com

Jun 20, 2024 12:05

Dogecoin, Cardano Very Bullish Based On MVRV: Santiment

The on-chain analytics firm Santiment has revealed that Dogecoin and Cardano are two assets that look “very bullish” according to this metric. Dogecoin & Cardano Currently Have Low 30-Day MVRV Ratios In a new post on X, Santiment has discussed about how some of the top assets in the cryptocurrency sector are looking like right now in terms of the Market Value to Realized Value (MVRV) Ratio. The MVRV Ratio is a popular on-chain indicator that keeps track of the ratio between the market cap and realized cap for any given coin. The market cap here naturally refers to the simple total valuation of the asset’s supply at the current price. The realized cap is also a method of calculating the valuation of the cryptocurrency, but the twist here is that this model doesn’t take the value of all tokens in circulation the same as the spot price. Rather, this model assumes that the “real” value of any coin is the same as the price at which it was last transferred on the blockchain. Related Reading: Hard To Be Too Scared Of Bitcoin Price Action, Says Analyst. Heres Why Generally, the last transaction can be assumed to be the last point at which the coin changed hands, so the price at its time could be considered to be its current cost basis. As such, the realized cap basically calculates the sum of the cost basis of every coin in circulation. One way to view the model, therefore, is as a measure of the total amount of capital that the investors have used to purchase the total Bitcoin supply in circulation. Since the MVRV ratio compares the market cap, which represents the value that the investors are holding right now, against this initial investment, its value can tell us about the profit-loss status of the market as a whole. Now, here is the chart shared by the analytics firm that reveals the recent trend in the 30-day MVRV ratio of six top coins: Bitcoin (BTC), Ethereum (ETH), XRP (XRP), Dogecoin (DOGE), Toncoin (TON), and Cardano (ADA). The 30-day MVRV Ratio only includes the data for the investors who bought their coins within the past month. Thus, its value reflects the profit-loss balance of these new buyers. From the graph, it’s visible that the indicator is at negative levels for all of these assets right now, implying that the 30-day investors would be at a loss. This may not actually be bad, though, as Santiment notes, “the lower a cryptocurrency’s 30-day MVRV is, the higher the likelihood we see a short-term bounce.” At present, Bitcoin, Ethereum, and XRP are seeing small negative values, suggesting that these assets may be slightly undervalued. The metric stands at just -0.6% for Toncoin, though, implying that TON is more or less neutral currently. Related Reading: XRP, Dogecoin, & Shiba Inu All See Negative Sentiment: Signal To Buy? Dogecoin and Cardano, on the other hand, stand out with their 30-day MVRV Ratios of -16.7% and -12.6%, respectively. These values are deep enough that Santiment has labelled these coins as “very bullish.” It now remains to be seen how DOGE and ADA develop in the coming days, given this potential positive signal in the MVRV Ratio. DOGE Price Dogecoin has been riding on bearish momentum over the last couple of weeks as its price has now dropped to $0.125. Featured image from Dall-E, Santiment.net, chart from TradingView.com

Apr 10, 2024 01:10

Bitcoins MVRV ratio shows LTHs move the market while STHs react

The market value to realized value (MVRV) ratio is one of the most important indicators for analyzing the Bitcoin market. It measures the ratio between the market cap (the current price of Bitcoin multiplied by the total number of coins in circulation) and the realized cap (the sum of the value of all coins in […]

The post Bitcoins MVRV ratio shows LTHs move the market while STHs react appeared first on CryptoSlate.

Apr 09, 2024 12:05

Polygon (MATIC) In Buy Zone That Earlier Led To 112% & 87% Surges

On-chain data shows Polygon (MATIC) is currently inside the same buy zone that earlier led to rallies of around 112% and 87% for the asset. Polygon 30-Day MVRV Ratio Is Significantly Negative Currently As pointed out by analyst Ali in a post on X, MATIC is showing a historically bullish pattern in its 30-day MVRV ratio. The “Market Value to Realized Value (MVRV) ratio” here refers to an on-chain indicator that keeps track of the ratio between the Polygon market cap and realized cap. The realized cap is a capitalization model that calculates the total valuation of the cryptocurrency by assuming that the “real” value of any coin in circulation isn’t the current MATIC spot price, but rather the price at which it was last transferred on the blockchain. Related Reading: Dogecoin Whale Takes $52.3 Million In DOGE Off Binance, Sign Of Buying? Considering that the last movement of any coin was the last time it changed hands, the price at its time would serve as its current cost basis. As such, the realized cap essentially sums up the cost basis of every coin in circulation. Put another way, the realized cap is a measure of the total amount of capital the investors have put into the asset. Since the MVRV ratio compares the value the holders are carrying right now (that is, the market cap) against this initial investment, its value can tell us about the profit-loss status of the market as a whole. Now, here is a chart that shows the trend in the 30-day version of the Polygon MVRV ratio, which tells us about the profit-loss balance specifically for the investors who bought within the past month: The value of the metric seems to have been quite low in recent days | Source: @ali_charts on X In the graph, the 30-day MVRV ratio has been displayed in terms of a percentage, with the 0% mark aligning with the scenario where the market cap and realized cap are equal. It’s visible that the indicator has registered some steep drawdown for Polygon recently and has dipped deep inside the negative territory. This would imply that the investors who bought within the last 30 days have entered into notable losses. The latest levels of the metric have been low enough to qualify for a zone that has provided profitable buying opportunities in the past. “Historically, the last two entries into this zone saw MATIC surge by 112% and 87%,” notes the analyst. Related Reading: Polygon Observes Buy Signal: Analyst Suggests MATIC Rebound To This Level A possible explanation behind this pattern could be the fact that as these 30-day investors enter into losses, the selling pressure in the market goes down as there aren’t many profit-takers left. This naturally facilitates for bottoms to take place. It now remains to be seen whether this past pattern would repeat for Polygon this time as well, and if it does, whether any resulting surge would be of a similar scale or not. MATIC Price Polygon has registered a 3% surge in the past day, with its price now floating above $0.93. Given the timing, it’s possible the MVRV ratio buy signal may already be in effect. Looks like the price of the coin has shot up over the past day | Source: MATICUSD on TradingView Featured image from GuerrillaBuzz on Unsplash.com, Santiment.net, chart from TradingView.com

Apr 28, 2025 12:10

Dogecoin MVRV Returns To This Crucial Level DOGE Price Up 400% The Last Time

The altcoin market has been one of the most-affected segments of the crypto industry by the uncertainty that has clouded the global financial markets in the past few months. For instance, Dogecoin the largest meme coin by market capitalization  lost over 55% of its value in the first quarter of 2025. However, things seem to be looking up for the DOGE token, as its price jumped by nearly 15% in the past week. According to the latest on-chain observation, this recent rally might just be the beginning of another leg up for the meme coin over the coming weeks. Is A Sustained Bull Run On The Cards For DOGE? In an April 26 post on the X platform, pseudonymous crypto analyst Cryptollica posited that the price of Dogecoin could be gearing up for an extended bullish period over the next few weeks. This projection is based on the changes in the MVRV metric, which tracks the ratio of a coins market cap to its realized cap. Related Reading: Ethereum Price Reaches Last H1 Support, Next Major Resistance Comes Into View The MVRV ratio basically tells how much value the investors hold (the market cap) against the value they put in (the realized cap). Hence, when the value of this metric is greater than 1, it means that more investors are in profit at the moment. Meanwhile, a less-than-one value implies that most of the market is in the red. As such, a high MVRV ratio is generally viewed as a price top signal because investors show more propensity to offload their assets when they are in profit. On the flip side, when the metric is below the 1 threshold, it suggests that the market might be bottoming out. As observed in the chart above, the Dogecoin MVRV ratio seems to be thickening in and around the 1 threshold level. Besides its on-chain significance, this level has proven pivotal in certain trend reversals seen in the past, with the DOGE price bouncing back to a new local high each time the MVRV ratio persists around this mark.  The price of Dogecoin surged by 1,900% and 2,200% in August 2017 and August 2020, respectively, when the MVRV ratio was at its current level. The last time it was around this level in August 2024, the DOGE price rallied by more than 400% to surpass $0.5. Going by the historical precedent, there is a likelihood that the DOGE price could be preparing for a significant upward movement. Considering the improving market climate, a sustained bullish run might not seem completely out of the question anymore at this point. Dogecoin Price At A Glance After briefly touching the $0.19 mark in the early hours of Saturday, April 19, the DOGE price appears to have cooled off. As of this writing, the price of DOGE is hovering around $0.18, reflecting a 0.3% decline in the past 24 hours. Related Reading: Ethereum Flips Key Resistance Into Support Can Bulls Reclaim $2,000 Level? Featured image from iStock, chart from TradingView

Apr 12, 2025 12:05

Bitcoin Dominance: BTCs MVRV Outpaces ETHs For Record 812 Days

On-chain data shows the Bitcoin Market Value to Realized Value (MVRV) Ratio is currently on a record streak against the metric for Ethereum. Bitcoin Has Continued To Dominate Ethereum In MVRV Recently In its latest weekly report, the on-chain analytics firm Glassnode has discussed about the divergence forming between Bitcoin and Ethereum. First, below is a chart that shows how the two cryptocurrencies have compared in terms of the Realized Cap growth since the start of the bull cycle. The “Realized Cap” here refers to an indicator that measures the total amount of capital that the investors of a given asset as a whole have invested into it. Changes in this metric, therefore, reflect the amount of capital going in/out of the cryptocurrency. Related Reading: Bitcoin Breakout Above This Level Could Set Stage For $208,550 Top, Analyst Says From the graph, it’s visible that Bitcoin has observed a massive increase of $468 billion in the Realized Cap since the bear market bottom back in November 2022. In this same window, Ethereum has seen inflows amounting to only $61 billion. As the analytics firm explains, This disparity in capital inflows between the two assets partly underscores why these assets have experienced diverging performance since 2023. Ethereum has experienced a relatively smaller inflow of demand and fresh capital this cycle, which has resulted in weaker price appreciation and a lack of a fresh ATH, despite Bitcoin prices reaching over $100k in December. Divergence between the assets has also formed in another metric: the MVRV Ratio. This indicator keeps track of the ratio between the Market Cap of an asset and its Realized Cap. Since the Market Cap represents the value the holders are carrying in the present, its comparison against the Realized Cap in the MVRV Ratio tells us about the profit-loss status of the investors as a whole. As is visible in the above graph, Bitcoin’s MVRV Ratio diverged from Ethereum’s around the start of the bull market. This implies that BTC investors have consistently enjoyed a higher amount of unrealized profits in this cycle. In the recent market downturn so far, ETH has taken a larger hit than BTC, so its MVRV Ratio has also declined at a faster rate. BTC investors as a whole are still in the green, but ETH holders are now underwater as the indicator for it has dipped under the 1 mark. Related Reading: 62.8% Of XRP Realized Cap Held By New Investors: Sign Of Fragility? To better showcase the disparity in the MVRV Ratio of the two coins, Glassnode has charted the difference between the two. As displayed in the graph, the difference between the Bitcoin and Ethereum MVRV Ratio has remained positive for 812 consecutive days now, which is the longest streak in history. BTC Price At the time of writing, Bitcoin is floating around $79,300, down over 3% in the last seven days. Featured image from Dall-E, Glassnode.com, chart from TradingView.com

XRP MVRV Ratio Dips Below The 200-Day MA  Trend Shift Underway?

Author: Sebastian Villafuerte
United Kingdom
Apr 02, 2025 12:05

XRP MVRV Ratio Dips Below The 200-Day MA Trend Shift Underway?

XRP has been navigating a volatile consolidation phase since late January, shedding over 40% of its value from its most recent all-time high. While the broader crypto market has struggled under the weight of macroeconomic uncertainty, XRP has managed to outperform many altcoins during this downturn. Several major altcoins have lost more than 60% of their value during the same period, highlighting XRP’s relative strength despite the ongoing correction. Related Reading: Chainlink Weekly Indicator Flashes Buy Signal Can Bulls Hold $13.20 Support? Global financial markets remain under pressure, with inflation concerns, geopolitical tensions, and interest rate uncertainty fueling a risk-off environment. These macro factors continue to ripple through the crypto space, dragging down sentiment and slowing momentum across most digital assets. However, on-chain data from Santiment has revealed an interesting development for XRP. The MVRV (Market Value to Realized Value) Ratio has just dipped below its 200-day moving average a crossover that historically signals a potential macro trend shift. This could be an early indication of a possible accumulation phase or a deeper correction, depending on how price reacts in the coming weeks. With volatility high and sentiment mixed, XRPs ability to hold its ground and respond to key on-chain signals will be crucial in determining its next move. XRP Holds Above $2 as Market Tension Builds XRP is currently facing a crucial test as it hovers just above the $2 mark a key psychological and structural support level. Analysts warn that if this level fails to hold, it could trigger a steep correction and send XRP into a deeper downtrend. The market is on edge, with sentiment growing increasingly split and volatile. Some investors remain optimistic, arguing that XRP is positioned to reclaim its range highs once macro conditions stabilize and market confidence returns. They point to XRPs relative strength in recent months compared to other altcoins, believing that any recovery across crypto could quickly lift XRP back into its previous trading range. However, others are more cautious, pointing to weakening momentum and uncertain price structure. A growing number of analysts believe XRP may be entering a new bearish phase, particularly if the $2 support fails. Adding to this tension, top analyst Ali Martinez shared insights on X highlighting a key on-chain development: the XRP MVRV (Market Value to Realized Value) Ratio has dipped below its 200-day moving average. Historically, this crossover has signaled a potential macro trend shift in price action. While not inherently bearish, it often precedes major directional moves up or down. As XRP teeters on the edge, this MVRV signal may prove crucial in determining the next leg. If bulls can hold $2 and reclaim momentum, XRP could recover swiftly. If not, a bearish outlook could materialize quickly. The coming days may define the trajectory of XRP for the rest of the quarter. XRP Bulls Fight to Hold Key Support XRP is trading at $2.13 after several days of sustained selling pressure, marking a decline of over 21% since March 19. The recent downturn has put bulls on the defensive, with the $2 level now acting as a critical support zone. If XRP fails to hold above this mark, it could confirm a shift toward a bearish trend and open the door to further downside in the short term. For bulls to regain momentum, defending $2 is essential but holding support alone wont be enough. XRP must also reclaim the $2.40 resistance level, which has acted as a ceiling during recent attempts to break higher. A successful move above $2.40 could reignite bullish sentiment and potentially push XRP toward new all-time highs. However, the broader market remains fragile, and investor confidence is shaky amid macroeconomic uncertainty. A breakdown below $2 would likely trigger increased selling pressure and confirm that the recent upswing was only a temporary bounce within a larger corrective structure. Related Reading: Dogecoin Holds Key Support: A Demand Spike Could Trigger A Rally The coming days are critical for XRP. Whether bulls can defend $2 and begin a recovery, or if bears take control, will determine the next direction of the trend. Featured image from Dall-E, chart from TradingView

Litecoin Holds Bullish Outlook As the MVRV Ratio Signals Strength  Analyst

Author: Sebastian Villafuerte
United Kingdom
Mar 08, 2025 12:05

Litecoin Holds Bullish Outlook As the MVRV Ratio Signals Strength Analyst

Litecoin (LTC) has shown resilience amid market uncertainty and selling pressure, holding its ground despite the broader downtrend in cryptocurrencies. After retracing from $130 to the $100 mark, LTC has successfully held this crucial support, signaling that bulls are still active in defending key levels. Related Reading: BTC Could Gain Momentum For A Move To $150,000 If Bulls Reclaim This Level Details While most altcoins have struggled, Litecoin appears to maintain a slight bullish edge. According to Santiment data, LTC continues to show strength in its on-chain metrics, with the Market Value to Realized Value (MVRV) Ratio signaling a bullish outlook. This suggests that investors are still holding onto their LTC, with less incentive to sell at current levels, potentially paving the way for a recovery in the near future. However, the coming days will be critical for Litecoin, as Bitcoin remains under pressure, struggling below key levels. Market uncertainty continues to drive volatility, and if BTC experiences further downside, LTC could face increased selling pressure. On the other hand, if Bitcoin stabilizes or pushes higher, Litecoin could quickly capitalize on its strong fundamentals and begin a renewed upward trend. Litecoin Bulls Defend Crucial Demand Litecoin is currently trading between key liquidity levels, navigating months of volatility and uncertainty in the broader market. Despite the recent market downturn, LTC has shown relative strength over the past few weeks, managing to hold crucial support levels while other altcoins continue to struggle. Related Reading: Dogecoin Indicator Flashes A Buy Signal On The 4-Day Chart Is DOGE Gearing Up For A Rebound? However, price action remains uncertain, as Litecoin has been unable to break above key supply zones. Bulls have attempted to push the price higher, but selling pressure at resistance levels has kept LTC within a tight trading range. Until a clear breakout occurs, traders remain cautious about the next major move. Top analyst Ali Martinez shared insights on X, highlighting that Litecoin maintains a bullish outlook based on on-chain data. According to Santiments MVRV Ratio, LTC is showing strength, suggesting that investors are holding onto their positions despite the markets recent volatility. This metric often indicates whether an asset is undervalued or overvalued, and in Litecoins case, it signals that the coin still has strong upside potential. If the broader crypto market starts to recover, Litecoin could emerge as one of the strongest assets, given its relative stability and bullish on-chain signals. For now, all eyes remain on LTCs ability to hold key support levels and whether bulls can break past resistance to confirm a new uptrend. LTC Price Action: Technical Levels To Watch Litecoin is currently trading at $104 after facing days of selling pressure. However, despite the bearish sentiment, sellers have struggled to push LTC below the crucial $100 demand zone. This level has acted as strong support, preventing further downside, and every day that LTC holds above this mark increases the probability of a recovery move. For bulls to regain control, Litecoin needs to reclaim the $115 level soon. A decisive break above this resistance could trigger renewed buying momentum, paving the way for a push into higher price levels around $130-$145. These areas represent the next major liquidity zones, where LTC could face strong resistance but also attract significant bullish interest. Related Reading: 2.23 Million Chainlink Moved To Exchanges In Two Weeks Selling Pressure Incoming? If Litecoin continues to hold above $100, it would indicate buying confidence at lower levels, setting the stage for a potential breakout. However, failure to reclaim $115 in the short term could keep LTC in a prolonged consolidation phase, leaving its next major move uncertain. Featured image from Dall-E, chart from TradingView

Ethereum MVRV Ratio Nears 160-Day MA Crossover  Accumulation Trend Ahead?

Author: Sebastian Villafuerte
United Kingdom
Mar 31, 2025 12:05

Ethereum MVRV Ratio Nears 160-Day MA Crossover Accumulation Trend Ahead?

Ethereum is once again under heavy selling pressure after losing the critical $2,000 level a psychological and technical zone that bulls have struggled to defend in recent weeks. With price action turning increasingly bearish, investor sentiment is weakening, and analysts are warning that a deeper correction may be on the horizon. As Ethereum slides lower, concerns are growing across the broader crypto market, which often relies on ETH’s strength to lead recovery phases. Related Reading: Bitcoin OTC Desks Are Draining Supply Squeeze On The Horizon? The current situation is both tense and delicate. Ethereums inability to hold key support levels has rattled short-term holders and is now testing the resolve of long-term investors. Many are now closely watching for any signs of stabilization or fresh accumulation. One promising on-chain signal comes from Glassnodes MVRV (Market Value to Realized Value) metric. Historically, a crossover of the MVRV ratio above its 160-day moving average has marked the beginning of strong Ethereum accumulation zones often preceding significant price rebounds. That signal is now approaching once again, and if confirmed, it could offer a glimmer of hope to bulls waiting for a shift in momentum. Until then, Ethereum remains in a fragile state. Ethereum Faces Critical Breakdown As Accumulation Signal Nears Ethereum is now in a critical position, with bulls continuing to lose control as key support levels break one by one. Selling pressure has intensified over the past few weeks, dragging ETH further into a prolonged downtrend that began in late December. Macroeconomic uncertainty, rising interest rates, and heightened global tensions continue to create a hostile environment for risk assets and the crypto market has felt the impact most severely. Currently, Ethereum is trading 55% below its local high of $4,100, reached earlier this cycle. The sharp decline has shaken investor confidence, and the continued breakdown in price structure leaves little room for error. Without a swift recovery and strong defense of support zones, Ethereum risks further downside, with analysts warning of continued weakness if sentiment doesnt shift soon. Amid the decline, some analysts are watching closely for signs of a potential bottom. Top analyst Ali Martinez shared a key insight on X, pointing to the MVRV (Market Value to Realized Value) ratio as a reliable indicator of accumulation zones. According to Martinez, when the MVRV ratio crosses above its 160-day moving average, it has historically marked strong accumulation phases moments when long-term investors begin quietly positioning for the next leg higher. This crossover has not yet occurred, but it is approaching. If confirmed, it could signal that Ethereum is entering a high-value zone despite the current bearish conditions. While the market remains fragile, such on-chain metrics offer a glimmer of hope that accumulation is quietly underway even as price action continues to look weak on the surface. Bulls will need to act quickly to reverse the trend, but for now, Ethereums outlook remains on edge. Related Reading: Solana Bears Eye $113 Target If Ascending Structure Breaks Down Details Bulls Defend Crucial $1,800 Support Ethereum is trading at $1,830 after suffering a sharp 14% drop since last Monday, reflecting renewed selling pressure across the crypto market. The steep decline has pushed ETH toward a critical support level at $1,800 a zone that now stands as a must-hold for bulls. This level has historically acted as a strong pivot point, and losing it could trigger a deeper correction. If ETH fails to hold above $1,800, the next significant support lies near the $1,500 zone, which would mark a dramatic shift in market structure and likely accelerate bearish sentiment. A breakdown to this level would erase much of the years gains and deal a serious blow to investor confidence. However, if bulls manage to defend $1,800 successfully, a rebound could follow, potentially pushing ETH back above the $2,000 mark. Reclaiming this psychological level would help restore momentum and open the door for a broader recovery. Related Reading: XRP Must Break Above $3 To Invalidate Bearish Pattern And Flip Bullish Analyst The next few days will be crucial for Ethereums short-term outlook. With macroeconomic uncertainty still looming, bulls must step in with conviction because if $1,800 breaks, the fall could be fast and steep. Featured image from Dall-E, chart from TradingView

Mar 26, 2024 12:05

Bitcoin Top In Yet? What The Legendary MVRV Ratio Says

Here’s what the latest trend in the Bitcoin Market Value to Realized Value (MVRV) ratio suggests about where the market is currently in terms of a top. Bitcoin MVRV Ratio Has Seen A Decline To The 2.34 Level According to data from the market intelligence platform IntoTheBlock, the BTC MVRV ratio surged high earlier this year as the cryptocurrency rally took place. The “MVRV ratio” is a popular indicator that tracks the ratio between the Bitcoin market cap and the realized cap. The former is simply the total valuation of the asset’s supply at the current spot price, while the latter is an on-chain capitalization model. Related Reading: Bitcoin Long-Term Holders & Price Top: Glassnode Reveals Pattern The realized cap measures the total sum of the value of the cryptocurrency’s supply, assuming that each coin in circulation has its true value at the price at which it was last transferred on the blockchain rather than the current spot value. One way to interpret the realized cap is that since it takes into account the buying price of every token in circulation (assuming that the last transaction of every token was indeed the point at which it last changed hands), it essentially sums up the total capital the investors have invested in the asset. As such, the MVRV ratio tells us how the total value that Bitcoin investors are carrying right now (that is, the market cap) compares against the value they put in (the realized cap). Now, here is a chart that shows the trend in the Bitcoin MVRV ratio over the past few years: Looks like the value of the metric has been turning down in recent days | Source: IntoTheBlock on X As is visible in the graph, the Bitcoin MVRV ratio has had a value greater than 1 for a while now. When the indicator has such values, the market cap is greater than the realized cap, and hence, the investors carry net profits. With the latest rally in the asset, this indicator has surged to relatively high levels, a natural consequence of the holders’ profits ballooning up with the price surge. After the recent drawdown in the price, though, the MVRV ratio has also turned itself around, as it’s now heading down. At present, the ratio has a value of around 2.34. “Traditionally, an MVRV ratio above 3 has been a reliable marker for predicting price peaks,” notes IntoTheBlock. So far, in the current rally, the metric hasn’t crossed this mark. It did come close recently, but the latest decline has meant it has gained a bit more distance to the level. Related Reading: This Bitcoin Halving May Not Result In Supply Squeeze: Glassnode Why have tops historically occurred at high values of the Bitcoin MVRV ratio? The answer is that investors in profits are more likely to participate in selling, and this temptation to take profits only increases as their gains grow larger. Because of this, selloffs are most probable when the market is holding extreme levels of profits, which is exactly what high MVRV ratio values reflect. BTC Price At the time of writing, Bitcoin is trading at around $67,200, up 3% over the past 24 hours. The price of the asset appears to have rebounded over the last few days | Source: BTCUSD on TradingView Featured image from Yiit Ali Atasoy on Unsplash.com, IntoTheBlock.com, chart from TradingView.com

Mar 21, 2024 12:05

Santiment Reveals Best Altcoins Currently In Opportunity Zone

The on-chain analytics firm Santiment has revealed the altcoins that have recently surged into the mid-term “opportunity zone.” These Altcoins May Be More Likely To See Rebounds In a new post on X, Santiment has discussed what the various altcoins in the market are looking like from the perspective of the MVRV. The “Market Value To Realized Value” (MVRV) refers to an indicator that keeps track of the ratio between the Bitcoin market cap and the realized cap. The realized cap here is a capitalization model for BTC that measures the total sum of capital that the investors have used to purchase their coins. As such, the MVRV tells us about how the value that the investors are holding right now (the market cap) compares against this initial investment. Related Reading: Bitcoin Plunges Under $63,000, Heres Where Next On-Chain Support Is Historically, the more profits the investors have held (that is, the higher the market cap has been compared to the realized cap), the more likely tops have been to occur. This is naturally because investors become more likely to give in to the allure of profit-taking the higher their gains get. On the other hand, cryptocurrencies have been probable to see rebounds when holders’ returns have dropped into the negative territory. In these conditions, there aren’t many profit-takers left, so selling pressure begins to run out. Based on these facts, Santiment has come up with an “Opportunity & Danger Zone Model” that uses the MVRV’s divergence from the norm on various timeframes to determine if an asset is providing a potential window for selling or buying right now. Below is the chart shared by the on-chain analytics firm that reveals what this model is saying for altcoins around the sector: Looks like some of the coins are approaching the opportunity zone | Source: Santiment on X From the graph, it’s visible that a lot of coins are still inside the overbought territory, but several altcoins have managed to sneak into the mid-term opportunity zone following the recent market downturn led by Bitcoin’s plunge. “This zone gets breached when an asset’s 30-day, 90-day, and 365-day average wallet returns are combining to be in negative territory,” explains Santiment. It should be noted, though, that while mid-term returns are red for these coins, they are still not yet inside the buy zone proper. “In a zero sum game like crypto, projects with minimal returns compared to the rest of the sector have a higher probability of a more efficient rebound for those who are willing to #buythedip on projects traders are in the most pain on,” notes the analytics firm. Related Reading: Bitcoin Has Undergone This Bearish Structure Change, Analyst Explains According to Santiment, some of the best altcoin candidates who are inside the mid-term opportunity zone include Lido DAO (LDO), Synthetix (SNX), Storj (STORJ), and OMG Network (OMG). LDO Price Lido DAO has had a bad time recently as its price has gone down more than 31% over the past week. With these red returns, it’s no wonder that the coin is becoming underbought on the MVRV. The price of the altcoin appears to have plunged down in the last few days | Source: LDOUSD on TradingView Featured image from Shutterstock.com, Santiment.net, chart from TradingView.com

May 23, 2023 02:10

Litecoin’s MVRV Has Surged, Why This Is Bearish

On-chain data shows the Litecoin MVRV has been at relatively high levels recently, something that could be bearish for the cryptocurrency. Both 30-Day & 365-Day Litecoin MVRV Ratios Are High Currently According to data from the on-chain analytics firm Santiment, LTC traders are well above water at the moment. The “MVRV ratio” is an indicator [...]

The post Litecoin’s MVRV Has Surged, Why This Is Bearish appeared first on Crypto Breaking News.

Jan 05, 2023 12:05

Bottom Signal: Bitcoin MVRV Ratio Falls To Three-Year Lows

Bitcoin is still stalling in terms of its price movement and has not made any significant jumps in the past couple of weeks. However, there could be a change in the trajectory of the digital asset in the coming weeks as the Bitcoin MVRV Ratio could be announcing a bottom signal. Bitcoin MVRV Ratio Reaches 2019 Lows Co-founder and CEO of on-chain data analysis firm Cryptoquant recently took to Twitter to share an interesting chart. The image showed that the bitcoin MVRV Ratio has fallen to levels that have not been seen since 2019 – three years ago. Related Reading: Bitcoin Mining Difficulty Sees Sharp 3.59% Drop Now, the bitcoin MVRV Ratio compares the market capitalization of BTC to its realized value. This helps to determine if the digital asset is actually trading at a fair value, if it’s overvalued, or if it is currently undervalued. The lower the value falls, the more undervalued BTC is. The times when the BTC MVRV Ratio has fallen to similar levels as the one shown in the Cryptoquant chart has been when the market had reached its bottom. This is during bear markets when prices decline drastically for a stretched-out period of time before bouncing back up. MVRV Ratio falls to 3-year low | Source: Cryptoquant Looking at the chart, it is easy to spot the times when the MVRV Ratio had been so low was when the previous bottom was reached. One time was in 2015, and the other time was in 2019, a couple of months before the bull market was triggered. If history is anything to go by, then this chart shows that the BTC bottom is already in, or very close to it. However, going by the previous timelines of when the MVRV Ratio has declined so low, it could be a few months at least before another bull market is triggered.  What To Do With Such Trends With the bitcoin MVRV Ratio being so low, it does provide a unique opportunity for investors to buy the digital asset at one of the lowest possible prices before another bull rally. BTC being so undervalued in previous years has only ended in a bull cycle that saw its price hit a new all-time high. Related Reading: Santiment Paints Bullish Picture For XRP, But This May Not Be The Case Even if this is not the bottom, it may be very close to it, so investors may not suffer heavy losses even if the price ended up falling lower. The lack of interest in the market in the market has beaten down investor sentiment but it brings into play a strategy proposed by legendary investor Warren Buffett: “Be greedy when others are fearful.” BTC is trending at $16,855 at the time of this writing. It is up 0.64% in the last 24 hours and 1.21% in the last 7 days. Follow Best Owie on Twitter for market insights, updates, and the occasional funny tweet… Featured image from Medium, chart from TradingView.com

Dec 22, 2022 04:45

Bitcoin Correction Soon? MVRV Triple Ribbon Approaches Bearish Cross

On-chain data shows the Bitcoin MVRV Ratio Triple Ribbon is approaching a bearish cross, a sign that a correction could be coming soon for the crypto’s price. Bitcoin MVRV Ratio Triple Ribbon Is Close To Bearish Crossover As pointed out by an analyst in a CryptoQuant post, the MVRV ratio warns that a new round of decline may be coming for BTC. The “MVRV ratio” is an indicator that measures the ratio between the market cap of Bitcoin and its realized cap. The realized cap is a capitalization model for BTC that calculates a sort of “real value” for the asset by assuming that the true worth of each coin in circulation is the price at which the particular coin was last moved. Related Reading: XRP Accumulation: Key Sharks And Whales Group Hits All-Time High Holdings By comparing this realized cap with the market cap, the indicator tells us whether the coin’s actual price is fair or not right now. Here is a chart that shows the trend in three moving averages (10-day, 15-day, and 20-day) of this metric over the last few months: The three MAs seem to have been closing in on each other in recent days | Source: CryptoQuant These three MAs of the Bitcoin MVRV Ratio together form the “Triple Ribbon” indicator, and crossovers between these ribbons have historically had implications for the price of the asset. As you can see in the above graph, whenever the 10-day MA has passed below both the 15-day and the 20-day versions, while at the same time the 20-day has gone above both the others (thus keeping the 15-day’s position unchanged in the middle), a bearish crossover has formed for BTC. There have been two instances of such a cross during the last few months; the first one occurred back in August when Bitcoin was at the height of its first relief rally of this bear market, while the other one formed in November right as the FTX crash came around. In both of these occurrences, BTC’s price took a deep plunge following the cross formation. Related Reading: Altcoin Indexes Take Beating As Investors Flip Alts For Bitcoin From the chart, it’s apparent that the MVRV Ratio Triple Ribbon has once again been approaching this same kind of bearish crossover recently. If these MAs continue in this trajectory and the cross does end up happening, then it might mean the crypto will see another sharp drop soon. BTC Price Looks like the value of the asset has continued to move sideways in the last few days | Source: BTCUSD on TradingView At the time of writing, Bitcoin’s price floats around $16,800, down 5% in the last week. Featured image from Mark Basarab on Unsplash.com, charts from TradingView.com, CryptoQuant.com

Sep 05, 2022 01:10

Research: Bitcoin’s realized price shows a bottom could be forming

Determining a market bottom requires looking at various different sets of data.

The post Research: Bitcoin’s realized price shows a bottom could be forming appeared first on CryptoSlate.

Mar 01, 2024 12:05

Bitcoin MVRV Hits Levels That Led To Parabolic Bull Run In 2020

On-chain data shows the Bitcoin MVRV ratio is currently at the same high levels as those that led to the parabolic bull run back in 2020. Bitcoin MVRV Ratio Has Shot Up As Latest Rally Has Occurred As pointed out by CryptoQuant founder and CEO Ki Young Ju in a post on X, the MVRV ratio has just hit a value of 2.5. The “Market Value to Realized Value (MVRV) ratio” is a popular on-chain indicator that keeps track of the ratio between the Bitcoin market cap and the realized cap. The “realized cap” here refers to a capitalization model for BTC that assumes that the real value of any token in circulation is not its current spot price (as the market cap takes it to be), but rather the value at which the coin was last transferred on the network. Related Reading: TRON Hits 95 Million Addresses Milestone, Will This Help Price? The previous transaction for any coin may be considered the last time it changed hands, which implies that the price at the time would be its current cost basis. As such, the realized cap adds up the cost basis of every token in circulation. This means that the realized cap essentially keeps track of the total amount of capital that the investors have used to purchase their Bitcoin. Since the MVRV ratio compares the market cap (that is, the value the investors are holding right now) against this initial investment, its value can tell us about the amount of profit or loss the investors as a whole are currently carrying. Now, here is a chart that shows the trend in the Bitcoin MVRV ratio over the history of the cryptocurrency: Looks like the value of the metric has been shooting up in recent days | Source: @ki_young_ju on X As is visible in the graph, the Bitcoin MVRV ratio has rapidly climbed up as the asset’s price has gone through its latest rally. In this surge, the metric has managed to exceed the 2.5 level. When the ratio is greater than 1, it means that the market cap is higher than the realized cap right now, and thus, the overall market is holding its coins at some profit. A value of 2.5 implies the average wallet is currently carrying gains of 150%. Related Reading: Cardano (ADA) Among Only Coins Seeing Loss-Taking: What It Means “In Nov 2020, MVRV was 2.5 at $18K, preceding the all-time high and parabolic bull run,” explains Ju. Back in that bull run, the peak of the first half of 2021 wasn’t hit until the MVRV ratio crossed the 3.7 mark, just like the two bull runs preceding it. The top in November 2021, however, didn’t follow this pattern, as it formed close to the 3.0 level. It now remains to be seen which path Bitcoin would take in its current rally, if it is at all similar to either of these. BTC Price Following Bitcoin’s impressive 22% rally over the past week, the asset’s price is now trading around the $62,800 level, not very far from setting a new all-time high now. The price of the asset has gone through rapid growth over the past few days | Source: BTCUSD on TradingView Featured image from Kanchanara on Unsplash.com, CryptoQuant.com, chart from TradingView.com

Dec 06, 2024 12:05

Bitcoin 30-Day Trader Profits Back In Healthy Range, Is BTC Ready For $100,000?

On-chain data shows the unrealized gains of the 30-day Bitcoin investors are now back inside the historical ‘healthy’ zone, a sign that could be bullish for BTC. Bitcoin MVRV Ratio For 30-Day Traders Has Declined Recently In a new post on X, the on-chain analytics firm Santiment has discussed about the trend in the Bitcoin Market Value to Realized Value (MVRV) Ratio. The MVRV Ratio here refers to an indicator that keeps track of how the value held by the BTC investors (that is, the market cap) compares against the value that they initially put in (the realized cap). Related Reading: XRP, Bitcoin See Lack Of Euphoria: Why This Is Bullish When the value of this metric is greater than 1, it means the market as a whole is in a state of net unrealized profit. On the other hand, it being under the threshold implies the dominance of loss among the investors. In the context of the current topic, the MVRV Ratio for the entire market isn’t of interest, but rather that of two specific holding ranges: 30-day and 365-day. The indicator corresponding to these ranges provides insight into the profit-loss breakdown of the monthly and yearly buyers of the asset. Now, here is the chart shared by the analytics firm that shows the trend in the Bitcoin MVRV Ratio for the 30-day and 365-day traders over the last few months: As displayed in the above graph, the Bitcoin MVRV Ratio for the 30-day investors had shot up to significant levels last month as the asset’s all-time high (ATH) exploration had taken place. Since the cryptocurrency has fallen to its consolidation phase, though, the metric has observed a cooldown. In the chart, Santiment has highlighted three zones for the indicator based on the historical trend. It would appear that the earlier increase had seen the metric surge into the ‘danger’ region, but with this decline, it’s now back inside the ‘healthy’ range. More specifically, the indicator has a value of 4.2% now, which is just inside the +5% to -5% range of the healthy zone. From the chart, it’s visible that the metric was last at this level on 26 November, just after which BTC observed a rebound. Generally, the tendency of the investors to sell goes up the higher amount of profits that they own, so high values of the MVRV Ratio can be a bad sign for the asset’s price. This is why the indicator being higher than 5% corresponds to the danger zone. Related Reading: Strong Bitcoin Rise Expected Within 1-2 Months, Quant Explains Why With the MVRV Ratio of the 30-day traders making a return into the healthy range, it’s possible that Bitcoin may be able to see a resumption of its rally or at least, avoid a further drop. The indicator for those who bought within the past year sits at more than 37%, but usually, investors who have been holding for so long don’t tend to sell easily, so these high profits may not be an immediate threat to BTC. BTC Price At the time of writing, Bitcoin is trading around $94,900, down 1% over the last week. Featured image from Dall-E, Santiment.net, chart from TradingView.com

Dec 22, 2024 12:05

Solana MVRV Signals More Gains Ahead Amid Market Downturn: Analysts

Amid a crypto market mayhem over the past week, Solana (SOL) has suffered significant losses to the tune of 17.13%,. according to data from CoinMarketCap.  This decline adds to the tokens steep price movement after it reached a new all-time high of $263.83 following the US Presidential elections in November. However, with the crypto bull cycle still in its early stages, analysts at Glassnode remain positive on the tokens ability to regain its bullish form despite not establishing any higher highs in the past three weeks. Related Reading: Solana Holds Monthly Support As Network Activity Grows Time For A Breakout? More Room For SOL Price Growth, Analysts Say In a recent blog post on December 20, Glassnode in collaboration with crypto analysts UkuriaOC and CryptoVizArt shared vital insights on the current state of the Solana market.  By analyzing the Net Realized Profit/Loss metric, these market experts discovered that Solana has experienced a positive net capital inflow since early September 2023, with a recorded peak inflow of $776 million of new capital per day.  During this period, the SOL market witnessed minor inflows with the majority of the profit-taking volume coming from coins aged 1 day-1 week, 1 week-1 month, and 6 months-12 months, demonstrating the endearment of Solana to both long and short-term holders. To ascertain the status of Solana amidst these recent market activity, Glassnode employs the MVRV ratio to determine if the market is overheated. For context, the Market Value To Realized Value (MVRV) ratio is used to assess if an asset is potentially overvalued (>1)  or undervalued (<1).  This MVRV ratio can be used to establish pricing bands that classify investors profitability into ranges. Using this setup, Glassnode observes that Solana is currently observing a sideways movement between the mean MVRV and +0.5 standard deviation range.  This development indicates the Solana market is quite heated but still far from a bull cycle top. This is because MVRV breakouts of +1 standard deviation have historically signaled when the altcoin forms a longer-term macro topping formation.  Therefore, Solana still has the potential to record much profit before entering an overheated zone that will likely precede a market downtrend. Related Reading: Solana Bull Flag Signals A Breakout To $300 Analyst Shares Key Levels Solana A Stellar Investment So Far – Glassnode In addition to more insights on the Solana market, Glassnode notes that altcoin has proven to be a highly profitable asset in the crypto market.  Following its price crash to $9.64 in November 2022, Solana has experienced a remarkable price gain of over 2,143% over the past two years. During this period, the altcoin has outperformed both Bitcoin and Ethereum on 344 out of 727 market days since the FTX exchange collapsed indicating significant market demand and interest. At the time of writing, Solana trades at $194.58 reflecting a price loss of 0.50% in the past day. However, the assets trading volume is up by 18.94% and is valued at $9.94 billion. Featured image from MoneyCheck, chart from Tradingview

Nov 23, 2024 12:05

Bitcoin Officially In Overheated MVRV Zone, Rally End Near?

On-chain data shows Bitcoin has recently surpassed a level of the Market Value to Realized Value (MVRV) Ratio that has historically signaled overheated conditions. Bitcoin Has Surpassed Highest MVRV Deviation Pricing Band In its latest weekly report, the on-chain analytics firm Glassnode has discussed about how Bitcoin is looking right now from the perspective of a pricing model based on the MVRV Ratio. The MVRV Ratio is a popular BTC indicator that keeps track of the ratio between the market cap of the asset and its realized cap. The latter here is an on-chain capitalization model that, in short, tells us about the amount of capital that the investors as a whole have used to purchase their tokens. Related Reading: Shiba Inu Could See A 53% Surge If This Resistance Breaks, Analyst Explains Since the MVRV Ratio compares this initial investment against the value that the investors are currently holding (that is, the market cap), it essentially provides information about the profitability of the addresses on the BTC network. Now, the pricing model that Glassnode has created doesn’t directly make use of the MVRV Ratio itself, but rather some standard deviations (SDs) from its mean. Below is the chart for this model shared by the analytics firm in the report. In this model, pricing levels correspond to BTC prices at which the MVRV Ratio would attain a value equal to a certain SD above or below its mean. At the +0.5 SD level, for instance, the MVRV Ratio is 0.5 SD greater than its mean value. From the graph, it’s apparent that the Bitcoin price has broken past the highest of the pricing bands part of this model with its latest run. The level in question is the +1.0 SD, equivalent to $90,200 at the moment. Historically, BTC has tended to form tops when its price has exceeded this pricing band. The reason behind this is the fact that at such high levels of the MVRV Ratio, the investors carry a significant amount of profits, so a mass selloff with the motive of profit-taking can become a real possibility. Related Reading: XRP Binance Inflows Spike: What It Means For Price The last time that the cryptocurrency broke past this barrier was in the first quarter of this year. As is visible in the chart, it didn’t take the price long to top out back then. In full-blown bull markets in the past, however, Bitcoin has generally sustained inside this overheated territory for notable periods of time before finding a peak. An example of this trend is also highlighted in the chart; the first half 2021 bull run saw the coin stay in the zone for a few months thanks to high capital inflows. As such, it’s not necessary that BTC would immediately reach a cyclical top now that it has become overheated on this model. BTC Price Bitcoin had risen beyond the $98,000 level earlier in the past day, but it seems the coin has suffered a minor setback as it’s now back at $97,500. Featured image from Dall-E, Glassnode.com, chart from TradingView.com

Oct 07, 2024 12:05

Bitcoin Holds Steady As Bullish Breakout Awaits These Conditions Details

According to data from CoinMarketCap, Bitcoin currently hovers near the $62,000 price mark with no significant movement in the past day. Notably, the premier cryptocurrency has slipped into a minor consolidation state since the little gains recorded on Friday. However, for long-term traders, Bitcoin has remained in a range-bound movement stretching to March. And while many investors are highly expectant of a bullish breakout in Q4 2024, certain market conditions must be met. Related Reading: Bitcoin Futures Liquidation Forms Local Price Bottom A Return To $65,000 Inevitable? Bitcoin MVRV, CQ Bull & Bear Indicators Show Market Uneasiness In a Quicktake post on CryptoQuant, an analyst with username burakkesmeci shares that the Bitcoin market is currently set for key price movements. Based on the MVRV Ratio and CQ Bull & Bear metric, burakkesmeci notes that Bitcoin investors are presently showing a significant level of market anticipation.  For context, the MVRV Ratio compares the current price of Bitcoin to its realized value i.e. the price at which the asset last moved on-chain. It is generally used to indicate if Bitcoin is undervalued or overvalued relative to its realized value.  When the MVRV ratio crosses above its 365-day Simple Moving Average (SMA 365), it indicates a bullish trend as investors are seeing a year-to-date gain on their assets. However, burakkesmeci notes that Bitcoins MVRV currently at 1.90 has been hovering just below its SMA 365 (2.03) since July showing the BTC market remains in a steady position waiting for a breakout. The analyst has also observed a similar pattern in the CQ Bull & Bear indicator which measures recent price action relative to longer-term price movements. According to burrakesmeci, the CQ Bull & Bear metric has been oscillating slightly below its SMA 365 (0.46) since August enforcing the notion that the Bitcoin market is in a holding pattern.   Related Reading: Bitcoin Investors Show Fear Could A Price Bottom Be Imminent? Factors That Will Spark A Bitcoin Rally For Bitcoin to experience a bullish breakout from its current holding position, burakkesmeci highlights certain events that must occur. First, he notes that the Federal Reserve must fully engage in a rate-cut cycle, gradually lowering interest rates over time. Interestingly, following a 50 basis points cut in September, market experts are tipping the Fed to implement another 25% cut at their next FOMC meeting in November.   Another bullish factor highlighted by burakkesmeci is an impending quantitative easing which will see the US government inject liquidity into the economy. It is expected that higher liquidity will allow individuals to explore risky investments such as Bitcoin.  At the time of writing, Bitcoin trades at $62,009 with a 0.02% loss in the past 24 hours. Meanwhile, the assets daily trading volume is down by 53.80% and valued at $12.97 billion.  Featured image from StomGain, chart from Tradingview

Your Crypto Gateway

Claim 1,000
Free WCG Coins

World Crypto Global opens the door to digital freedom for everyone.
Manage your free WCG Coins securely—where simplicity meets global accessibility.

11 bn

FREE CRYPTO COINS

8.9 bn

AVAILABLE FOR RESERVATION

2.1 bn+

ALREADY ALLOCATED

× WCG Coin

🎉 Get 1,000 WCG Coins

No fees. No catch. Your crypto journey starts here.