Quant Price Prediction for Today, March 18 QNT Technical Analysis
According to the daily chart, after touching the daily low of $123.6, the Quant price prediction touches a new daily high of $136.2. Quant’s Price [...]
Loading
Welcome at World Crypto Global. This portal is packed with useful content and resources to built out your own crypto skills. WorldCrypto is a site member of Gabriel Vega Network.

According to the daily chart, after touching the daily low of $123.6, the Quant price prediction touches a new daily high of $136.2. Quant’s Price [...]
Like most cryptocurrencies, Quant (QNT) has witnessed a considerable price rally over the past weeks. The token has added more than 8.24% over the past 24 hours. Even the broader cryptocurrency market has recently seen tremendous improvement in its prices. Reports revealed that the cryptocurrency market outperformed the traditional equity market. QNT saw a 14-day gain of 26.8% and a 7-day price surge of 7.58%. These performances could be credited to improving economic conditions and recent improvements on the Quant Network. Related Reading: ApeCoin Buckles As News Of Stolen BAYC NFT Hits The Market What Factors Could Be Driving Quant Price Up? Quant Network is an interoperability-enabling platform launched to connect several blockchains effectively. The Quant token price often moves in response to changes in the U.S. economy. For example, the Consumer Price Index (CPI) for December at 6.5% showed a value in line with market expectations. CPI is a metric in the United States that measures inflation. A higher CPI signifies high inflation, while a lower value indicates a reduction. The crypto market had positive sentiments before the CPI release, which boosted the sector, including QNT. Over the past weeks, Quant showed signs of a breakout from the descending channel. A movement above the descending channel often indicates a potential breakout, which drives the price upwards. This trend could also be one of the factors influencing Quant’s rally. Data indicates that Quant might have seen a double-bottom on the daily time frame while the cryptocurrency broke out of a channel that pushed the price action upwards. Also, Quant oscillators and the 7-day Moving Average is currently showing a strong buy. It could be among the factors driving QNT’s price upwards. Also, the fear and greed index is showing neutral. Latest developments on the Quant Network could also be among the factors driving the asset price upwards. The Quant Network designs secure bridges for asset transfer. Bridges are networks used for asset transfer from one network to another. But it is common knowledge that bridges are usually susceptible to hack attacks. Quant Price Predictions, will it Continue Soaring? QNT is currently trading at $154.91. The coin is above its 50-day and 200-day Simple Moving Average (SMA). The formation of a golden cross in the coming weeks is likely if the 50-day SMA crosses over the 200-day SMA. Quant’s support levels are $137.30, $139.09, and $141.27. It has broken its resistance levels at $145.24, $147.02, and $149.21. The token is currently under bullish pressure. A new resistance will form at the $164.67 level, with the old resistance levels turning to support. The formation of a long green candle today shows the bulls have controlled most of the trading activity. Quant’s Relative Strength Index (RSI) reading is 72.97, which is in the overbought region. That is also a bullish signal. The MACD (Moving Average Convergence/Divergence) is now above the signal line showing positive readings. Expect the positive trend to sustain for a few more weeks. Although the token might record a slight price correction, it will remain bullish for the short term. Related Reading: Dogecoin Whale Transfers $5M In DOGE To Coinbase, Bearish Signal? Please note that altcoins are relatively volatile and might deviate from a predicted trend. Also, an altcoin that loses half its value must recover 100% to return to its original price. However, they provide opportunities for traders who love volatile markets to profit with proper risk management techniques. Featured image from Pixabay and chart from TradingView.com.
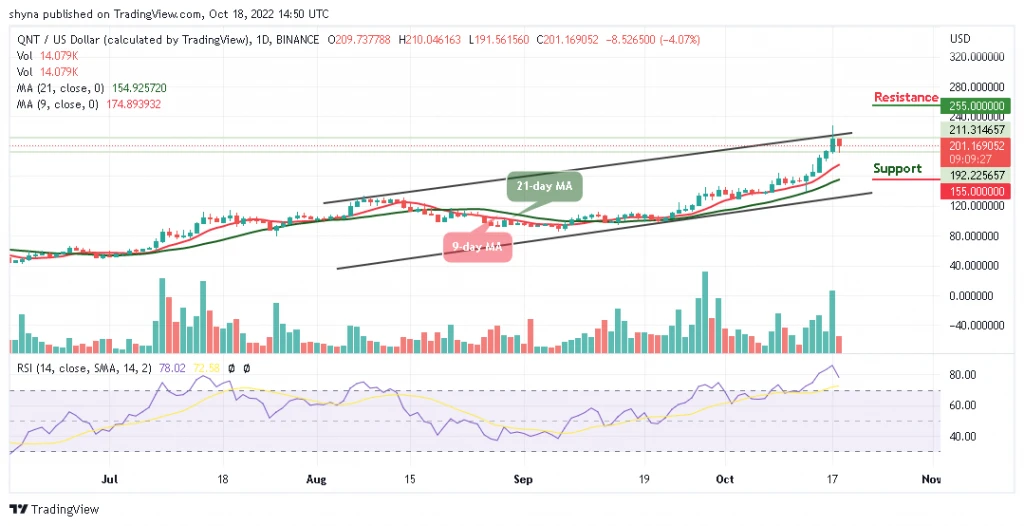
After the Quant price encountered bearish resistance at the $225 price level, the price had a steep fall below the $175 price level. Buyers needed [...]
After the Quant price encountered bearish resistance at the $225 price level, the price had a steep fall below the $175 price level. Buyers needed [...]
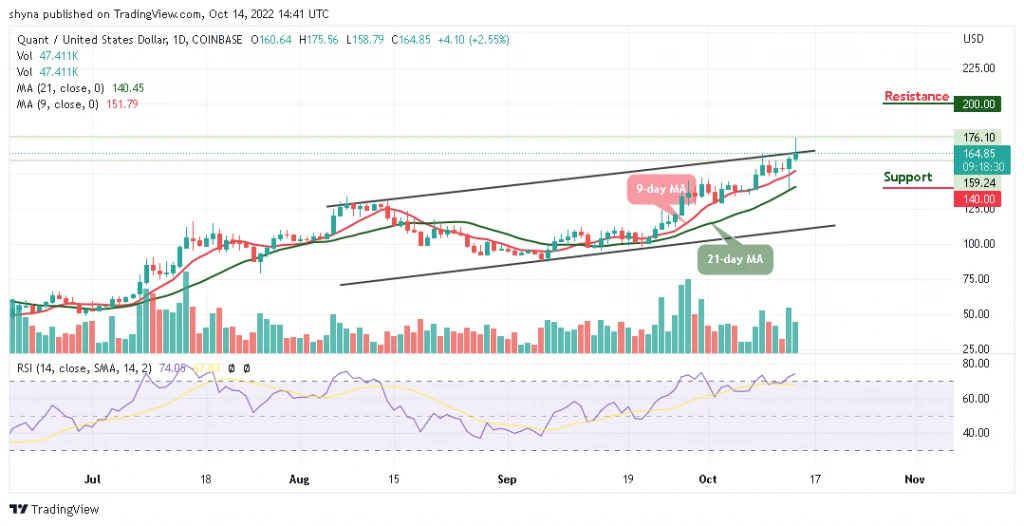
After a brief price consolidation from the 9th of October to the 13th of October, the price of Quant skyrockets continuously for 5 days [...]
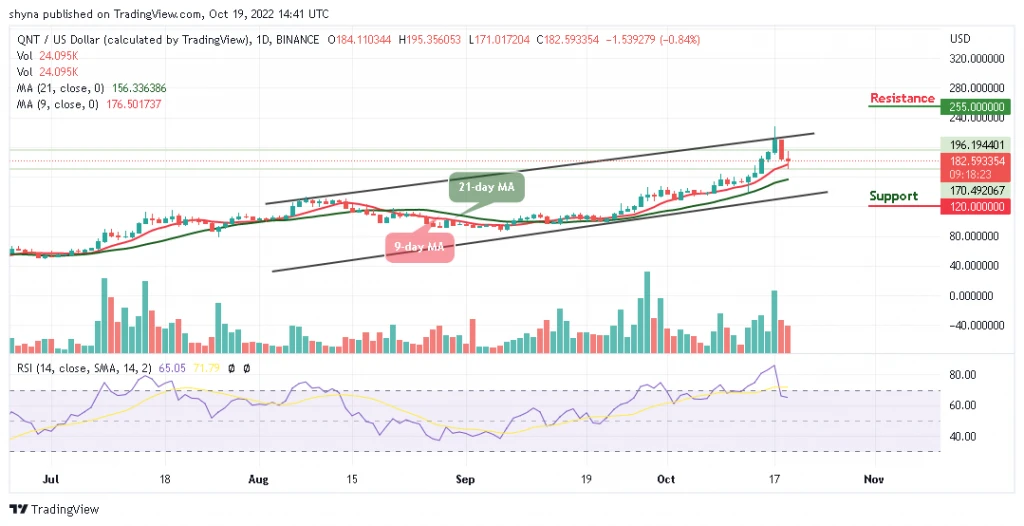
The Quant price prediction shows that QNT is currently changing hands at $182.5 as the coin retreats below the resistance level of $195. Quant Prediction [...]
The Quant price prediction shows that QNT failed to cross above the upper boundary of the channel as the selling pressure takes over the market. [...]
According to the daily chart, after touching the daily low of $190, the Quant price prediction touches a new daily high of $227. Quant Prediction [...]
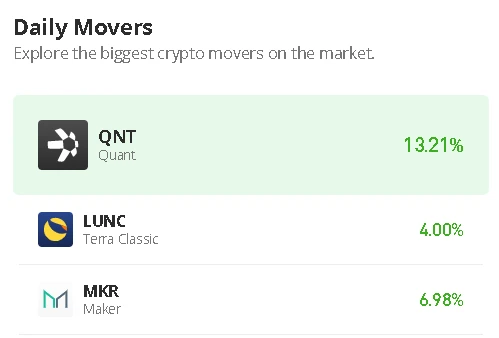
The Quant price prediction shows that QNT is rising with a gain of 2.55% over the past 24 hours as it crosses above the channel. [...]
Despite being a lesser-known cryptocurrency, Quant has held gains while top coins, including Bitcoin, have fallen in value. The price of Quant had fallen along with the rest of the crypto market at the start of the year. However, it has slowly experienced growth since then, trading at $157 at press time. This is over 248% gain from its yearly low of $44.42 on June 17. Quant’s weekly and three-month charts have also been in the green. Its weekly chart shows that the coin has been on an uptrend for the past two weeks. The coin has seen some volatility, but it has been able to hold onto its gains. This is quite impressive given the recent dump seen by other cryptocurrencies, including Bitcoin, the pioneer crypto. Related Reading: Bitcoin Dominance Rises As Market Turns Red, What Does This Mean For Altcoins? Quant Price Analysis Quant (QNT) prices continued to climb for a second day on Thursday, hovering above an eight-month high. The coin reached a new all-time high of $163.83 on Sunday, the first time this has happened since February 8. Earlier on in today’s trading session, the QNT/USD pair reached a high of $157.80. This brought the coin’s price to within $6 of the all-time highs stated earlier. QNT’s 14-day relative strength index (RSI) is at 70.19, which indicates that the stock is overbought after recent gains. This is just below a resistance level of 71.00. Quant bulls will need to break through this resistance to propel prices higher. This area is also expected to see heightened price uncertainty as bears wait for a chance to rejoin the market. Can Quant Breakthrough Its $158 Price Resistance? Despite holding gains when top coins like Bitcoin are dumping, Quant has experienced difficulty breaking through its $158 monthly barrier. Further, the price movement is stumbling at this level, with declining volume action suggesting the bullish momentum is depleted and a price reversal is imminent. The altcoin has lost 1.23% today, trading at $154.9. The QNT/USD price chart shows a high-velocity bullish climb from $86 to $155. The price trend suggests a rounded bottom breakout rally against rising supply around $155. However, the determined buyers wobble at this barrier and reattempt a bullish breakthrough. The daily rejection candles with lengthy wicks highlight the continuous volatility in the cryptocurrency market. Moreover, within a week, the second breakout effort has been met with diminishing volume activity. The action suggests a strong likelihood of a reversal. This monthly barrier is crucial since a bearish reversal should set off a large correction. Therefore, the growth in the supply entering the market will push prices lower than $150, maybe down to $132. Related Reading: Shiba Inu Adds Another Zero, Is It Time To Jump Ship? What To Expect From Quant The bullish reversal pattern should keep the Quant price on an upward trajectory. Therefore, this pattern suggests that a rebound should encourage buyers to test the $158 barrier again after a pullback. A bullish breakthrough from the $158 barrier will release momentum and give traders an entry chance. Thus, the rise may continue to $186. Featured image from Pixabay and chart from TradingView.com
The Quant price prediction shows that QNT is moving above the main resistance level of $145 as the coin aims higher. Quant Prediction Statistics Data: [...]
The Quant price prediction manages to maintain its position, while the bulls maintain the desire to defend the support at $132. Quant (QNT) Prediction Statistics [...]
The Quant (QNT) price prediction spikes above the upper boundary of the channel as the coin touches the daily high at $145. Quant Prediction Statistics [...]
The Quant price prediction shows that QNT touches the resistance level of $108 today as the coin prepares for the upside. QNT Prediction Statistics Data: [...]
The Quant (QNT) price prediction may continue to show a bullish movement if the market could rise above the $42 resistance level. Quant (QNT) Statistics [...]
The daily chart reveals that the Quant price prediction is likely to follow a long-entry level near the support level of $95 level. Quant Prediction [...]
The Quant price prediction could set a bullish run if the buyers can push the coin above the resistance level of $115. Quant Prediction Statistics [...]
World Crypto Global opens the door to digital freedom for everyone.
Manage your free WCG Coins securely—where simplicity meets global accessibility.
FREE CRYPTO COINS
AVAILABLE FOR RESERVATION
ALREADY ALLOCATED

No fees. No catch. Your crypto journey starts here.