W o r l d . C r y p t o . G l o b a l

Loading

Welcome at World Crypto Global. This portal is packed with useful content and resources to built out your own crypto skills. WorldCrypto is a site member of Gabriel Vega Network.

Contact Info

CATEGORY: rsi


Sep 07, 2024 05:50

MATIC Slides Deeper: Will It Break The $0.3132 Barrier?

MATIC is under mounting bearish pressure as it continues its downward slide, drawing closer to a critical support level at $0.3132. A break below $0.3132 could open the door to additional losses, signaling a deeper bearish trend ahead. With the market sentiment turning increasingly negative, speculations are whether the bears can push the price beyond [...]

The post MATIC Slides Deeper: Will It Break The $0.3132 Barrier? appeared first on Crypto Breaking News.

Sep 06, 2024 12:05

Dogecoin Falls Below Trendline Resistance, Eyes On $0.09149 Breach

Dogecoin (DOGE) finds itself in a challenging position as bearish forces continue to dominate the market. Currently trading below a key descending trendline, DOGE faces mounting pressure that could push the price toward the critical $0.09149 support level. With the bearish trendline acting as a formidable resistance, any failure to hold this support could signal further downside movement. This article aims to provide a comprehensive analysis of Dogecoin’s current negative outlook, highlighting its position under the trendline resistance and the potential implications of a breach below the $0.09149 support level. By examining key technical indicators and market sentiment, the article seeks to offer insights into whether DOGE will continue its downward trajectory or find a reversal. With a market capitalization exceeding $14 billion and a trading volume surpassing $471 million, Dogecoin was trading at approximately $0.9683, reflecting a 1% increase at the time of writing. In the past 24 hours, its market cap has risen by 1.01%, while trading volume has declined by 3.71%. Price Action Analysis: Assessing The Downward Pressure On Dogecoin On the 4-hour chart, Dogecoin, trading below the 100-day Simple Moving Average (SMA), is exhibiting consistent bearish momentum. The cryptocurrency is currently consolidating just above the $0.09149 mark.  Related Reading: Major Dogecoin Indicator Flashes Bullish, Is It Time To Buy? This consolidation near a critical support level suggests that despite brief attempts to recover, selling pressure remains dominant. If DOGE fails to maintain its position above $0.09149, it could trigger an extended decline, potentially pushing the price lower as bears continue to exert control. Additionally, on the 4-hour chart, the Relative Strength Index (RSI) is positioned at 45%, failing to rise above the 50% mark. This failure to gain traction above the midpoint reflects persistent pessimistic momentum, suggesting that downward pressure may continue, as the RSIs position below 50% reinforces the likelihood of further bearish activity in the market. On the daily chart, Dogecoin is still demonstrating notable bearish movement below the 100-day SMA and the trendline. The cryptocurrency is currently approaching the support level at $0.09149, indicating ongoing downward pressure and the potential for more declines if this support fails to hold. Finally, the RSI signal line on the 1-day chart has fallen to 41%, slipping below the 50% threshold, reflecting a shift in momentum that could lead to additional downward movement in DOGE’s price. Potential Scenarios: What Could Happen If DOGE Breaks $0.09149? If Dogecoin breaches the $0.09149 support level, several scenarios could unfold. A successful break below this key support might intensify the downbeat trend, potentially driving DOGE toward the $0.07456 support range. Should this level be breached, the price could further decrease to test the $0.0559 support mark, and possibly explore even lower support zones. Related Reading: Dogecoin Price (DOGE) Struggles: Can It Overcome the Slump? Conversely, if Dogecoin holds above $0.09149 and reverses its decline, it could indicate a bullish turnaround, which might set the stage for a rally toward the trendline resistance. A successful break above this trendline could trigger a significant uptrend, possibly pushing DOGE toward $0.1293 and beyond. Featured image from Unsplash, chart from Tradingview.com

Solana-Focused 3-Unit Course Now on its 2nd Sem in UP Diliman

Author: Shiela Bertillo
Philippines
Sep 05, 2024 02:50

Solana-Focused 3-Unit Course Now on its 2nd Sem in UP Diliman

A Solana-focused program is set to equip students from the countrys top university with the skills and industry connections needed to thrive in the rapidly growing web3 space.

Sep 05, 2024 12:05

Bitcoin Bearish Move: Indicators Suggest Next Stop Could Be $53,541

Bitcoin faces mounting pressure as crucial indicators signal a potential drop to the $53,541 mark. With sellers gaining momentum and technical charts flashing red, the cryptocurrency is struggling to find a foothold in a volatile market.  Traders are watching closely to see if the bearish trend will continue or if a reversal is on the horizon as BTC hovers near critical support levels. The next few days could be crucial in determining Bitcoin’s short-term trajectory. As Bitcoin faces increasing selling pressure, this article explores the recent bearish signals affecting its price movement, analyzing key technical indicators that suggest a potential drop to $53,541. By examining the critical support levels to watch, insights into whether BTC will find stability or continue its slide will be provided. As of the time of writing, Bitcoin was trading at approximately $56,691, reflecting a 4.04% decline with a market capitalization exceeding $1 trillion and a trading volume surpassing $31 billion. Over the past 24 hours, BTC’s market cap has dropped by 3.96%, while trading volume has surged by 22.55%. Analyzing BTC’s Recent Price Action And Key Indicators On the 4-hour chart, Bitcoin has displayed strong bearish momentum below the 100-day Simple Moving Average (SMA) following its failure to break above the $60,152 mark. The price is now attempting to fall toward the $53,541 mark. If the cryptocurrency successfully breaches this key level, it could begin a more pronounced downtrend, potentially driving the price down to other crucial support levels. Additionally, on the 4-hour chart, the Relative Strength Index (RSI) has slipped below the 50% mark, currently resting at 32%. This decline highlights growing bearish momentum and suggests that selling pressure could intensify. On the daily chart, BTC is showing significant negative movement below the 100-day SMA by printing two bearish momentum candlesticks. This downbeat surge reflects strong selling pressure and negative market sentiment, increasing the likelihood of BTC reaching the $53,541 mark soon. Finally, the 1-day RSI shows that bearish pressure on BTC is intensifying. The signal line has recently dropped below 50%, now resting at 39%, which also signals growing selling pressure and a pessimistic sentiment for the digital asset. Investor Outlook: Preparing For Bitcoin Potential Downside  With bearish pressure mounting and key indicators pointing to further declines, Bitcoin appears poised to drop to the $53,541 mark. Should the cryptocurrency breach this level, it could signal a more significant pessimistic move, potentially driving the price down to the next support at $50,604 and beyond. However, if Bitcoin hits the $53,541 support level and the bulls manage to stage a comeback, the price could start moving upward toward the $60,152 resistance mark. A successful breach of this resistance might lead BTC to test its all-time high of $73,811, with the potential to set a new record if it surpasses this level. Featured image from iStock, chart from Tradingview.com

Oct 01, 2024 12:05

BNB Rally Fades As Price Dips Under $600: Is A Correction Looming?

BNB‘s recent rally appears to be losing steam, as the price has dipped below the crucial $600 mark. After a strong upward surge that reignited bullish sentiment, the momentum is now showing signs of cooling off. This dip raises concerns about whether the rally can sustain itself or if a broader correction is on the horizon. As selling pressure increases and the market cools, this article seeks to explore whether BNB’s rally is losing steam after dipping below the key $600 level. By analyzing technical indicators, market sentiment, and price action, we aim to evaluate the potential for a deeper correction or a renewed bullish push. Current Market Conditions: Analyzing The Position Of BNB Recently, BNB has taken a bearish turn on the 4-hour chart after struggling to break above the significant resistance level of $605. This failure to maintain upward movement has led to a decline, bringing the asset down to the 100-day Simple Moving Average (SMA). Furthermore, a breach below this moving average could intensify selling pressure, while a bounce back might indicate a possible reversal. An analysis of the 4-hour Relative Strength Index (RSI) suggests bullish momentum may wane. Currently, the RSI has fallen to around 36%, indicating that the buying pressure is diminishing. An RSI below 40 can signal that an asset is entering oversold territory, which often precedes further declines or the possibility of a price correction. Related Reading: BNB Price Surge Eyes $550 Breakout: Can It Push Higher? Also, on the daily chart, BNB is exhibiting significant negative movement, as reflected by a series of bearish candlesticks. This ongoing downward trend highlights a prevailing selling pressure within the market. Although BNB is currently trading above the 100-day SMA, which is typically seen as a bullish indicator, the strength of the bearish candlesticks suggests that upward momentum may be limited. Finally, on the 1-day chart, a closer examination of the RSI formation reveals that the RSI signal line has dipped to 53%, approaching the crucial 50% threshold. As the RSI approaches this level, it may heighten the risk of additional declines if it falls below 50, reinforcing the bearish sentiment in the market. Will The 100-Day SMA Hold? Currently, BNB is trading just above the 100-day SMA, which has historically served as a strong indicator of market sentiment. If the price breaks below the 100-day SMA, it could trigger increased selling pressure, leading to an extended drop toward the $531 support level. Related Reading: BNB Price Struggles to Hold $500: Is a Breakout Coming? In the event that BNB maintains its position above the 100-day SMA, it may indicate a potential rebound and restore bullish sentiment, allowing the price to begin climbing back toward the $605 resistance level. A successful breakout above this mark could pave the way for more price growth toward other resistance levels, increasing optimism among traders and signaling a more sustained upward trend. Featured image from Shutterstock, chart from Tradingview.com

Sep 04, 2024 12:05

Solana Pullback To $137: Will Bulls Break Through Or Bears Dominate?

Solana (SOL) has recently pulled back to the $137 level, a key point that could dictate its next move in the market. As the cryptocurrency tests this resistance, market participants are watching closely to see if the bears will seize the opportunity to drive prices lower, or if the bulls will capitalize on this pullback to ignite a breakout.  This article aims to analyze Solana’s recent pullback to the $137 level and assess whether the bears can regain momentum to push the price lower or if the bulls will leverage this moment to drive a breakout. By examining key technical indicators, market sentiment, and potential scenarios, we aim to provide traders and investors with a comprehensive outlook on SOL’s next potential moves and what to watch for in this crucial phase. Currently, Solana is trading at approximately $135, reflecting a 4.66% increase. The cryptocurrency boasts a market capitalization of over $63 billion, with a trading volume surpassing $2 billion. Over the past 24 hours, Solana’s market cap has grown by 4.70%, while its trading volume has dipped by 6.89%. Market Overview: SOL’s Recent Movement To $137 On the 4-hour chart, Solana has gained significant bullish momentum, advancing toward the $135 mark and forming multiple positive candlesticks just below the 100-day Simple Moving Average (SMA). This upward movement suggests increasing buying interest. However, the proximity to the 100-day SMA indicates that the bulls will need to maintain their momentum to overcome this resistance and push higher. Additionally, on the 4-hour chart, the Relative Strength Index (RSI) has climbed to 48% after rebounding from the oversold zone and is now attempting to move above the 50% mark. This upward shift in the RSI indicates strengthening buying pressure, which could support further positive movement if it continues. On the daily chart, Solana is showing signs of a bullish attempt toward the $137 level, remaining below the 100-day SMA. A bullish momentum candlestick was formed in the previous trading session, suggesting potential upward movement despite its current position below the key moving average. Finally, the 1-day RSI suggests that Solana might extend its current pullback. The signal line, which had previously dropped to 34%, is now showing signs of recovery and is currently sitting at 40%. Thus this upward movement could indicate a potential shift in momentum, suggesting that SOL might regain optimistic strength as it progresses. Crucial Levels To Watch: Resistance And Support Zones For Solana Monitoring key support and resistance levels will be critical as Solana navigates its current price action. The immediate resistance is at the $137 level, which could challenge the ongoing bullish momentum. Should Solana surpass this resistance, it may target higher levels, potentially testing new highs. On the downside, the crucial support level to monitor is approximately $118. If SOL cannot break through the $137 resistance, it may face additional declines, potentially dropping toward $118 and reaching even lower support zones. Featured image from Adobe Stock, chart from Tradingview.com

Sep 30, 2024 12:05

BONK In Trouble As Sharp Decline Hints At An Impending Pullback

BONK is currently facing turbulent waters as a sharp decline casts a shadow over its recent price performance. After a period of impressive gains, the recent downturn is raising concerns about an impending correction, with mounting selling pressure suggesting that the bullish momentum may be waning. As the market sentiment shifts, the crypto community is left wondering how low BONK could go and whether it can regain its footing. With uncertainty in the air, this analysis aims to analyze the recent sharp decline of BONK and explore the implications for its future price action. By examining key technical indicators, market sentiment, and trading patterns, we aim to assess the likelihood of an impending correction. This piece will provide insights into potential support levels and resistance points, enabling traders and investors to make informed decisions in the face of uncertainty. Recent Performance: Analyzing The Decline Recently, BONKs price has turned bearish on the 4-hour chart, retracing toward the 100-day Simple Moving Average (SMA) and moving above the $0.00001792 support level. The drop from the overbought zone may signal that traders are taking profits or that buying enthusiasm is diminishing resulting in the pullback. An analysis of the 4-hour Relative Strength Index (RSI) reveals that the signal line has decreased to 66%, retreating from the overbought territory. This decline suggests a shift in market momentum, indicating that buying pressure is beginning to wane. A retreat from the overbought zone often signals that the market may be experiencing a correction, as traders who bought during the bullish run might start to take profits. Related Reading: BONK About To Enter 3rd Wave, Analyst Reveals Next Target Furthermore, on the daily chart, BONK is exhibiting negative momentum, as evidenced by the formation of a bearish candlestick, even while trading above the 100-day SMA. This situation reveals a possible contradiction in market sentiment. Should selling pressure continue and BONK is unable to maintain its position above the 100-day SMA, it may lead to a more significant price correction. Finally, on the 1-day chart, the RSI has climbed above 50% and currently sitting at 73%, reflecting strong optimistic sentiment and buying pressure. Although this points to more price gains, the closeness to the overbought zone increases the chance of a reversal if buying slows down. Predictions For The Price Trajectory Of BONK With technical indicators suggesting an impending pullback, BONK may face a decline in price toward the $0.00001792 level. If this support is breached, it could open the door to further losses, potentially pushing the price down to $0.00000942 and other lower ranges. Related Reading: Bonk Inu (BONK) Skyrockets 10%, Dethroning WIF As Solanas Largest Meme Coin However, if the bulls manage to mount a comeback and push the price above $0.00002320, the meme coin could continue its upward momentum toward the next resistance level at $0.00002962. A successful breach of this level may trigger additional gains, allowing the price to challenge other resistance levels above. Featured image from Shutterstock, chart from Tradingview.com

Sep 29, 2024 12:05

Bitcoin Set For Biggest September Gains In A Decade: Heres Why

Bitcoin (BTC) looks poised to record its best September in a decade, surging past $65,000. This uncharacteristic price appreciation could be attributed to several key factors. Reasons Behind Bitcoins Impressive September Gains Historically, September has consistently been the worst month for BTC in terms of price performance. However, the apex cryptocurrency is now on track to post its best September in at least a decade, driven by several macroeconomic developments. Related Reading: Bitcoin Could Top At $400,000 Based On This Model, Analyst Says On September 18, the US Federal Reserve (Fed) initiated its interest rate cut cycle for the first time in four years, slashing rates by 50 basis points (bps) in response to slowing inflation and rising unemployment.  The rate cut immediately impacted risk-on assets, including BTC, which has appreciated by over 10% since the cut. In comparison, Bitcoins average price decline in September over the past decade has been 3.45%, according to the chart below from CoinGlass. According to the Fed’s decision, the European Central Bank (ECB) and the Peoples Bank of China (PBoC) lowered borrowing costs to stimulate their respective economies. This further propelled BTCs price towards its previous highs. Bitcoin halving is another key factor that could now be starting to show its effect on the digital assets price action. Bitcoin underwent its halving earlier this year in April, reducing block confirmation rewards for miners from 6.25 BTC to 3.125 BTC. Past data indicates that halving has typically been a bullish trigger for Bitcoin due to the resulting supply scarcity. For instance, in May 2020, BTC price rose from roughly $8,900 before the halving to more than $64,000 by April 2021 – an 8x price surge in less than a year. Meanwhile, US spot Bitcoin exchange-traded funds (ETFs) continue to witness rising interest from retail and institutional investors alike, as they recorded $365.57 million in total net daily inflows on September 26, the largest since late July. Since their launch, the cumulative net inflow for Bitcoin ETFs now totals $18.31 billion. Cautious Optimism Key To Riding The BTC Wave While BTC appears to have shaken off its typical September slump, its worth highlighting that the leading digital asset still needs to overcome certain important price levels before hitting a new all-time-high (ATH). Related Reading: Here Is Why The Bitcoin Bull Run Hasnt Started, According To Analyst As previously reported, Bitcoins relative strength index (RSI) fell below 80 on the monthly chart, signaling that the cryptocurrencys bullish momentum might fade after an enthusiastic buying spree. In addition, a recent report by crypto exchange Bitfinex noted that despite Bitcoins recent upward movement, it must decisively overcome a strong resistance level of $65,200 to continue its positive momentum. The good news for bulls is that BTC is holding steady at $65,674, up 2% in the last 24 hours. Featured image from Unsplash, Charts from CoinGlass.com and Tradingview.com

Sep 28, 2024 05:50

Shiba Inu Breakout Eyes $0.00002631 Level After Rallying Over 19%

Shiba Inu is experiencing a notable price breakout, surging over 19% and positioning itself toward the critical resistance level of $0.00002631. This significant rally indicates a shift in market momentum, characterized by robust buying pressure and increased trading volume. Technical indicators suggest that SHIB is establishing a bullish trend, with key support levels solidifying its [...]

The post Shiba Inu Breakout Eyes $0.00002631 Level After Rallying Over 19% appeared first on Crypto Breaking News.

Sep 27, 2024 02:15

Project Guacamaya Uses AI and Satellites to Combat Amazon Deforestation


Project Guacamaya leverages AI and satellite technology to protect the Amazon rainforest, monitor deforestation, and preserve biodiversity. (Read More)

Sep 27, 2024 12:05

WIF Bulls Push Hard Toward $2.1 Resistance Amid Market Optimism

Dogwifhat (WIF) is on the verge of a major breakout, with bulls targeting the $2.1 level as upward momentum continues to build. After a strong period of gains, all eyes are on whether this momentum can trigger the price past this critical resistance. A successful push could ignite a broader rally, further solidifying WIFs bullish outlook. As the market heats up, this article seeks to analyze WIF’s price action as it approaches the critical $2.1 resistance level, focusing on the bullish strength that has driven recent gains. By examining technical indicators, market sentiment, and potential key levels, the goal is to assess whether the bulls can sustain their push and trigger a breakout, or if bearish pressure may halt the rally. WIF, with a market capitalization surpassing $2.1 billion and a trading volume of over $528 million, was trading at around $2, indicating an 8.15% increase at the time of writing. In the last 24 hours, its market cap rose by 8.14%, while trading volume saw a decrease of 27.81%. Bulls Push Gains Steam: Can WIF Surpass The $2.1 Barrier? Following the recent trendline break, WIF’s price on the 4-hour chart has continued to gain momentum as it reaches $2.1, with the purpose of breaking past it. WIF is also trading above the 100-day Simple Moving Average (SMA), suggesting a positive upward trend that could lead to a potential breakout. An analysis of the 4-hour Relative Strength Index (RSI) suggests a potential for further upward movement. The RSI has risen again to the 70% threshold after previously dropping to 63%, indicating that positive movement is gaining strength. Related Reading: Dogwifhat On The Edge: Can WIF Hold Above $1.47 As Bears Close In? On the daily chart, WIF shows strong upside movement, reflected in multiple bullish candlesticks following a successful move above the 100-day SMA. This rising strength suggests that bulls are actively in control and may push the cryptocurrency higher, aiming to surpass the $2.1 mark. Finally, on the 1-day chart, a detailed examination of the RSI formation indicates that WIF may maintain its optimistic trajectory as the indicator’s signal line has risen above the 50% threshold and is currently positioned at 70%, displaying a sustained bullish outlook. How High Can The Meme Coin Go Post-Breakout If the upbeat momentum continues and WIF successfully breaks through the $2.1 resistance level, it could target the next resistance level at $3.5. A decisive move above this level might pave the way for additional gains, possibly reaching its all-time high of $4.8 and beyond. Related Reading: Dogwifhat Price Up 15%, Analyst Predicts it Will 25x in 2024 Conversely, if the breakout leads to profit-taking or bearish sentiment, WIF may retrace to the previous support level of $1.47. When this level is breached, it could result in deeper declines, potentially dropping toward $0.7122 and other lower ranges. Featured image from Medium, chart from Tradingview.com

Sep 26, 2024 12:05

Bitcoin Capped Below $65,000 As RSI Falls Below 80 In Monthly Chart: Should You Worry?

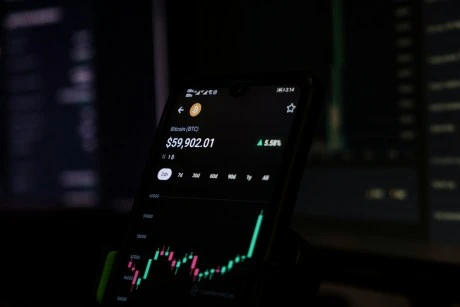
Bitcoin is firm at press time. According to CoinMarketCap data, the world’s most valuable coin is changing hands above $63,500, steady on the last day and up a decent 7% over the previous week of trading. Technically, the uptrend remains as long as prices stay above the support zone at around $58,000 and $60,000. Bitcoin Up 30% From August Lows, RSI Dips Below 80% Level In The Monthly Chart At press time, traders are upbeat and optimistic, which could form the base of another leg up. So far, since the dip in early August, Bitcoin is up 30% and retesting August highs at around $65,000. However, there are high expectations that buyers will push prices above this level, marking another phase for confident bulls, a development in the monthly chart is worth noting. Related Reading: Bitcoin Could Top At $400,000 Based On This Model, Analyst Says Taking to X, the analyst notes that as bulls struggle to break above $65,000 and print a fresh 2-month high, the upside momentum seems to be fading. At press time, the Relative Strength Index (RSI) in the monthly chart is falling, recently breaking below the 80%. Typically, the zone between 80% and 100% marks the upper limit of the oscillator, denoting that the coin is overvalued or in the overbought territory. With the RSI falling, it can be interpreted that the upside momentum is down, which is a net negative for bulls. Since this is printed out in the monthly chart, it could have serious consequences in the daily and lower time frames. It can hint that cracks are forming, and sellers may be preparing to push lower, especially if bulls fail to break above $65,000. There Is Hope, BTC Will Likely Spike Once Prices Race Above $73,000 Bearish as this may be, there is hope. The analyst observes that though the RSI is below the 80% mark, this is not the first time. On multiple occasions, Bitcoin prices recover steadily when the RSI falls to this level. Nonetheless, this doesn’t happen all the time. As this is a concern, traders should closely monitor how price action pans out in the coming days. A drop toward the $60,000 mark will pour cold water into the current momentum, signaling the start of a possible correction. Related Reading: Cardano (ADA) Reclaims Top 10 Crypto Spot, Analysts Set New Targets Even with this outlook, the analyst is bullish. In a separate post, the analyst said if Bitcoin shakes off weakness and climbs towards $73,000, the coin may rally strongly. When this happens, the analyst expects a new influx of fresh liquidity, especially in the futures market. The inflow, in turn, could drive prices to new levels, perhaps even above all-time highs. All the same, before this happens, BTC needs to gather momentum. This surge will happen, especially if there is a decisive close above the $65,000 resistance line. Feature image from DALLE, chart from TradingView

Sep 26, 2024 12:05

SUI Eyes $1.45 Retest Following Breakout: Will Bulls Defend Support?

SUI is on the brink of a key moment as it prepares to retest the $1.45 level following a successful breakout. The recent surge has positioned the cryptocurrency for a crucial test, where the bulls must step in to defend this newfound support. With the breakout still fresh and momentum hanging in the balance, the battle between bulls and bears continues to intensify. Can the bulls maintain control and solidify $1.45 as a foundation for further gains, or will selling pressure push SUI back into retreat? The aim of this analysis is to assess SUI’s potential as it approaches the critical retest of the $1.45 level after a strong breakout. We’ll explore the key technical signals, market sentiment, and the strength of bullish sentiment to determine whether the bulls can successfully defend this support. Technical Analysis: Key Indicators Point To $1.45 Retest Despite SUI’s price trading above the 100-day Simple Moving Average (SMA) on the 4-hour chart, the cryptocurrency is undergoing a noticeable pullback, aiming to retest the $1.45 level. This suggests that the recent bullish strength may be slowing down as traders reassess key support and resistance zones. An analysis of the 4-hour Relative Strength Index (RSI) shows a potential price decline toward $1.45 as the RSI line is dropping from the overbought zone toward the 50% threshold, indicating that SUI’s upbeat momentum may be losing strength. Related Reading: SUI Rises 8% Amid Market Retrace, Will The Joy Be Short-Lived? Also, on the daily chart, SUI is showing bearish momentum as it attempts to retest the $1.45 mark. There have not been any notable declines in the price since it broke above the 100-day SMA, which implies that a correction might be approaching. Finally, on the 1-day chart, a closer analysis of the RSI signal line reveals a drop to 72% after previously peaking above 77%. This decline from overbought levels indicates that bullish momentum is waning, potentially signaling the beginning of a price consolidation or correction. The Road Ahead: What A Successful Retest Could Mean For SUI A successful retest of the $1.45 support level could mark a pivotal moment for SUI, potentially setting the stage for further upward movement. If the bulls manage to defend this key level, SUI may aim for higher resistance points, with targets like $2.18 and beyond coming into focus. Related Reading: SUI Price Sits 40% Below All-Time High As TVL Approaches $1 Billion However, should SUI fail to hold the $1.45 support level, it could trigger a deeper correction toward the next key support at $1.22. A breach of this level might signal a shift in the trend, possibly accelerating additional downside moves and completing a bearish reversal. At the time of writing, SUI was trading at approximately $1.74, marking a 13.14% increase over the past 24 hours. The cryptocurrency’s market capitalization was around $4.6 billion, with trading volume exceeding $1 billion, reflecting increases of 13.14% and 70.81%, respectively. Featured image from Shutterstock, chart from Tradingview.com

Sep 25, 2024 12:05

BNB Falters At $600, Paving The Way For A Deeper Pullback

BNB bullish rally has hit a wall as the $600 resistance level proves to be a formidable barrier. After an impressive upward run, momentum has stalled, and downside pressure is starting to build. While bulls are struggling to regain control, the bears are gaining confidence, signaling a potential shift in market direction. With the rally halted and key support levels under threat, BNB is now facing an increased risk of a pullback, leaving traders on edge as the price hovers at this crucial threshold. As BNB faces the formidable $600 resistance, the aim is to analyze the mounting pressure that has halted its recent rally. We will explore the technical indicators that signal a potential downturn, market sentiment, and potential price movements as the bulls fight to regain control.  Risk Assessment: Evaluating The Downside Potential Despite BNB’s price trading above the 100-day Simple Moving Average (SMA) on the 4-hour chart, which typically signals a positive trend, the cryptocurrency has faced significant resistance at the $600 mark. This resistance has resulted in a noticeable pullback, indicating that upward momentum falters as sellers capitalize on the current price level. An analysis of the 4-hour Relative Strength Index (RSI) suggests a potential price drop as the RSI line is dropping from the overbought zone toward the 50% threshold, reflecting rising bearish pressure for the cryptocurrency that might push the price toward $537. Related Reading: BNB Price Surge Eyes $550 Breakout: Can It Push Higher? Also, on the daily chart, BNB is currently showing bearish momentum as it drops toward the $537 mark. Since breaking above the 100-day SMA, the price has experienced a consistent upward trend without any significant pullbacks, indicating that a huge correction may be on the horizon. Finally, on the 1-day chart, a comprehensive analysis of the RSI signal line reveals a recent decline to 68% after peaking at 72%. This movement suggests a shift in momentum, signaling that BNB is entering a consolidation phase or facing increased selling pressure, which could lead to additional price corrections. Future Outlook: What Lies Ahead for BNB? Although the cryptocurrency has demonstrated resilience by maintaining its position above key moving averages, the increasing bearish pressure and recent pullbacks indicate that BNB’s price could decline toward the $537 support level. If it reaches this point and manages to break below, this could trigger a further drop toward other support levels, heightening concerns among traders about the potential for extended downward momentum. Related Reading: BNB Weekly Active Addresses Surge Over 6% Is A Rally On The Way? Alternatively, if the bulls can stage a recovery before BNB reaches the $537 support level, the price could begin to rise again toward the $600 resistance. A breakout above this key level may open the door for more gains, with BNB likely testing higher resistance points as bullish momentum builds. Featured image from iStock, chart from Tradingview.com

Sep 24, 2024 12:05

SUI Eyes Potential Pullback As RSI Flashes Warning: $1.4 Retest In Sight

SUI impressive bullish momentum appears to be losing steam as technical indicators point toward a potential cooldown, with the Relative Strength Index (RSI) signaling overbought conditions, raising concerns about the sustainability of the recent rally.  The $1.4 level is now in focus, as this cooling strength suggests that a pullback could be on the cards, offering a critical moment for SUI as it navigates through growing market pressure. Will the bulls hold their ground, or is a correction set to unfold? This article aims to analyze SUIs recent price action in light of technical indicators, particularly the RSI, which suggests a potential cooling of momentum. By examining the implications of overbought conditions and the likelihood of a retest at the $1.4 level, this analysis seeks to provide insight into whether SUIs bullish trend will continue or if a correction is on the horizon. Technical Indicators Point To Cooling Momentum: A Turning Point For SUI? Despite SUI’s price trading above the 100-day Simple Moving Average (SMA) on the 4-hour chart, the cryptocurrency is undergoing a noticeable pullback, aiming to retest the $1.4 level. This suggests that the recent bullish pressure may be slowing as traders reassess key support and resistance zones. An analysis of the 4-hour Relative Strength Index suggests a potential price drop toward $1.4 as the RSI line is dropping from the overbought zone toward the 50% threshold, indicating that SUI’s bullish momentum may be losing strength. Related Reading: SUI Climbs 36% Amid Bullish Breakout Is $1.50 The Next Target? Also, on the daily chart, SUI is showing bearish sentiment as it attempts to retest the $1.4 mark. Since breaking above the 100-day SMA, the price has experienced a consistent upward trend without any significant pullbacks, indicating that a noticeable correction may be on the horizon. Finally, on the 1-day chart, a detailed analysis of the RSI signal line indicates that it has surpassed the 50% threshold and is currently at an impressive 82%. This high reading raises concerns about potential overbought conditions, which could trigger a market correction or pullback. $1.4 Retest Looms: What Traders Should Watch For Next As SUI approaches the critical $1.4 level, traders should be vigilant, as a breach below this point could indicate a potential move toward the $1.16 support level. If the price breaks below $1.16, it may signal a further decline toward the $0.8690 level and beyond. Related Reading: SUI Bulls Gear Up, Can They Push Through The $1.16 Ceiling? However, if SUI experiences a strong rebound at the $1.4 level, the price may start to rise again toward its all-time high of $2.18. A breakout above this level could indicate a continuation of the upward trend, possibly paving the way for a new all-time high. At the time of writing, SUI was trading at approximately $1.55, marking a 5.99% increase over the past 24 hours. The cryptocurrency’s market capitalization was around $4.1 billion, with trading volume exceeding $964 million, reflecting increases of 5.64% and 151.91%, respectively. Featured image from Shutterstock, chart from Tradingview.com

Sep 22, 2024 12:05

BONK Bulls Take Over: Upside Momentum Builds After Pullback

After a brief pullback, BONK is showing signs of renewed strength as bullish momentum begins to build. The recent price action indicates that bulls have regained control, pushing the token out of its recent slump.  As the market shifts, traders are now eyeing a potential upside breakout, with BONK’s next targets becoming increasingly clear. Could this be the beginning of a fresh rally, or will the bears attempt to reclaim their dominance once again? In this article, we’ll provide an in-depth analysis of BONK’s recent price action following its pullback and explore the renewed bullish strength that has emerged. By examining key technical indicators, well assess whether this shift in momentum signals the potential for further upside and a breakout, or if the token is likely to face resistance in the near term. Technical Indicators: Signs Of Bullish Momentum Building Recently, BONKs price has turned bullish on the 4-hour chart, rebounding and moving above the $0.00001792 resistance level. The meme coin is trading above the 100-day Simple Moving Average (SMA) and is demonstrating strong momentum, with a current focus on moving toward the $0.00002962 level. An analysis of the 4-hour Relative Strength Index (RSI) indicates that bulls may be poised to make a comeback. Although the RSI has decreased to 59% from the overbought zone, it remains above the 50% threshold, suggesting that bullish momentum is still present. This positioning indicates that while there has been some cooling off, the market retains the potential for upward movement as long as the RSI stays above this key level. Related Reading: Bonk Inu (BONK) Skyrockets 10%, Dethroning WIF As Solanas Largest Meme Coin Also, on the daily chart, BONK is displaying positive momentum, evidenced by a rejection wick on the present daily candlestick. Despite being below the 100-day SMA, this rejection wick shows that buyers are stepping in and pushing the price higher, causing the selling pressure to diminish. Finally, on the 1-day chart, a close look at the 1-day RSI formation suggests that BONK may fully resume its upward movement as the indicator’s signal line has climbed above the 50% threshold and is currently positioned at 53%. Potential Upside Targets: Where Could BONK Be Headed Next? As BONK demonstrates renewed bullish strength, key resistance levels to watch include the $0.00002320 mark, where previous price action has encountered obstacles. If BONK can break through this level, it could pave the way for further gains, potentially reaching the next target of around $0.00002962 and beyond. Related Reading: Can BONK Break The Mold? Analyst Predicts Stellar Rise For The Solana Memecoin Conversely, if BONK faces significant resistance at $0.00002320, the price may consolidate or attempt to test the $0.00001792 support level. A break below this range accompanied by strong volume could signal a continuation of the downward trend, possibly targeting the support level at $0.00000942. BONK was trading at about $0.00001803, showing a 2.33% decline over the last 24 hours. The cryptocurrency’s market capitalization stood at roughly $1.2 billion, while trading volume exceeded $128 million, marking decreases of 2.32% and 23.11%, respectively. Featured image from LinkedIn, chart from Tradingview.com

Sep 21, 2024 12:05

BNB Rides Bullish Wave After 100-Day SMA Breakout, Next Stop $605?

Recent price movement reveals that BNB has surged past a critical barrier, clearing the 100-day Simple Moving Average (SMA) and signaling renewed bullish momentum. With this breakout, BNB bulls are setting their sights on the $605 resistance level, as market sentiment strengthens around the potential for further gains. The move above the 100-day SMA has sparked optimism, hinting at the possibility of a sustained rally as BNB looks to capitalize on this momentum and break through key price targets. The goal of this analysis is to highlight BNBs recent surge above the 100-day Simple Moving Average (SMA) and evaluate the potential for continued positive movement toward the $605 resistance level. By examining current market dynamics and technical signals, this analysis aims to provide insight into whether BNB can maintain its upward momentum and achieve a significant breakout in the coming sessions. Rallying Strength: Analyzing BNB’s Surge Above The 100-Day SMA On the 4-hour chart, BNB has demonstrated sustained positive momentum after successfully breaking above the 100-day Simple Moving Average (SMA). This significant breach has not only triggered a shift in market sentiment but set the stage for a bullish trajectory as BNB rises toward the $605 mark. BNBs ability to maintain above this key technical level reflects growing confidence among traders, suggesting that the upward movement may continue. Additionally, the Relative Strength Index (RSI) on the 4-hour chart has climbed above the 50% threshold, currently sitting at 69%. This upward movement in the RSI indicates that bulls are firmly in control, as the index approaches overbought territory. If selling pressure remains subdued, there is potential for an extended increase in BNBs price, signaling a strong bullish trend ahead. Related Reading: BNB Weekly Active Addresses Surge Over 6% Is A Rally On The Way? On the daily chart, BNB is maintaining an upswing toward the $605 resistance level while trading above the 100-day Simple Moving Average (SMA). The price has printed multiple candlesticks above this key indicator, underscoring the strong buying pressure from investors and indicating a solid sentiment in BNB’s potential for continued growth. Finally, on the 1-day chart, a careful examination of the formation of the 1-day RSI reveals that BNB could sustain its bullish trend toward the $605 resistance mark as the signal line of the indicator has risen above 50% and is currently attempting a move towards the 70% threshold. Whats Next For BNB As Resistance Beckons With strong buying interest and positive market sentiment, BNB is gearing up to reach the $605 resistance level. When BNB breaks above this point, it could lead to more gains, aiming for the $635 resistance zone and beyond. Related Reading: BNB Price Struggles to Hold $500: Is a Breakout Coming? However, the altcoin may face a pullback toward the $537 support mark if the momentum falters and fails to surpass this level. A decline below this support could lead to additional drops, with the price potentially testing the $500 support range and other lower levels. At the time of writing, BNB was trading at approximately $575, reflecting a 3.05% increase over the past day. Its market capitalization was around $84 billion, with trading volume surpassing $1.9 million, showing increases of 3.05% and 9.81%, respectively. Featured image from Adobe Stock, chart from Tradingview.com

Amazon to revamp Alexa with Anthropic's Claude AI model: report

Author: Cointelegraph by Savannah Fortis
United States
Sep 03, 2024 12:00

Amazon to revamp Alexa with Anthropic's Claude AI model: report

Amazon is set to overhaul its Alexa virtual assistant, integrating Anthropic's Claude AI model to enhance its capabilities, with a new premium version scheduled to launch in October.

Sep 20, 2024 12:05

Shiba Inu Jumps Nearly 6% In Latest Price Rebound, Rally Incoming?

Shiba Inu has caught the market’s attention once again with a nearly 6% price rebound, signaling renewed bullish momentum for the popular meme coin. After a period of consolidation, this jump has raised speculation that the bulls might be returning to drive the price higher. Could this price surge mark the beginning of a major rally, or is it just a temporary spike? All eyes are on the next move. This analysis aims to explore the recent 6% price rebound of Shiba Inu and assess whether this upward movement signals the start of a larger rally. By examining key technical indicators and market trends, we determine if the current momentum can sustain further gains and levels to watch for potential breakouts or pullbacks. Indicators And Trends: Are Bulls Gaining Strength? Recently, SHIBs price has turned bullish on the 4-hour chart, rebounding from the $0.00001272 support level. The cryptocurrency is trading above the 100-day Simple Moving Average (SMA) and is demonstrating strong momentum, with a current focus on moving toward the $0.00002045 level. An analysis of the 4-hour Relative Strength Index (RSI) reveals that bulls have been firmly established in the market. The RSI’s signal line has surged past the 50% threshold to around 69%, reflecting increasing positive movement for the cryptocurrency. This upward trend suggests that buying interest is intensifying, and momentum could continue to build, potentially leading to further price gains. Related Reading: Shiba Inu Seen Exploding 1,000%-7,300%: Bold Predictions Signal Massive Growth Meanwhile, on the daily chart, Shiba Inu is still showing upbeat momentum, marked by the formation of bullish candlesticks. This indicates a favorable shift in price action as the cryptocurrency moves towards the 100-day SMA and the $0.00002045 level, with the bullish candlestick patterns suggesting a growing upward strength. Furthermore, if this momentum continues, SHIB could see further advances as it approaches this key resistance level. Finally, on the 1-day chart, a careful examination of the formation of the 1-day RSI reveals that SHIB could sustain its optimistic trend as the indicator’s signal line has risen above 50% and is currently attempting to move towards the 60% threshold. What Could Next Moves Look Like For Shiba Inu As Shiba Inu continues its upward trajectory, several scenarios could unfold. If the cryptocurrency maintains its bullish momentum and breaks through the $0.00002045 resistance level, it could signal the start of a significant rally, potentially pushing toward the next resistance level at $0.00002631. Related Reading: Get Ready For Take-Off! Shiba Inu Price To Jump 7,350% Analyst Conversely, should SHIB encounter strong resistance or a pullback, the price might consolidate or move to test $0.00001272 support level. When the price breaks through this range with strong volume, it could indicate a continuation of the downward trend and possibly target the support level at $0.00000847. SHIB was trading at approximately $0.00001415, reflecting a 6.97% gain over the past 24 hours. Its cryptocurrencys market capitalization reached around $8.3 billion, with trading volume surpassing $230 million, representing an increase of 6.73% and 72%, respectively. Featured image from iStock, chart from Tradingview.com

Sep 19, 2024 12:05

Chainlink Signals Deeper Losses: Can Bulls Stage A Comeback?

Chainlink is facing increasing bearish pressure as its price continues to edge lower, signalling a potential move toward the further downside. After a period of consolidation, the bears have regained control, pushing Chainlink closer toward the $9.28 support level.  However, bulls may not be ready to give up just yet. With market sentiment fluctuating, the possibility of a bullish comeback looms on the horizon. By examining key technical indicators and market sentiment, we seek to determine if LINK is poised for a deeper decline or if bullish forces could reverse the current trend and drive the price upward. At the time of writing, Chainlink was trading around $10.59, marking a 0.10% decline over the past day. The cryptocurrencys market capitalization stood at approximately $6.4 billion, while trading volume exceeded $206 million, showing increases of 0.10% and 15.36%, respectively. Current Market Sentiment: Bearish Pressure Mounts On Chainlink On the 4-hour chart, following a successful drop below the $11 mark, LINK has continued to experience negative momentum, dropping toward the 100-day Simple Moving Average (SMA). As the cryptocurrency approaches the 100-day SMA, it could either find temporary support or risk further declines if the bearish momentum continues to intensify. Also, the Relative Strength Index (RSI) on the 4-hour chart, has dropped below the 50% threshold, now sitting at 42%. With the RSI attempting to move deeper into the oversold territory, it shows that bears are gaining control, and an extended decrease could be on the horizon if buying interest does not pick up soon. Related Reading: Is Chainlink (LINK) $12 Breakout Imminent? Data Reveals A Rising Open Interest On the daily chart, Chainlink is currently making a bearish movement, toward the $7.14 trading below the 100-day Simple Moving Average. This movement underscores strong selling pressure and negative market sentiment, signaling a heightened risk of further losses. Lastly, the 1-day RSI reflects increasing pessimistic pressure on LINK, as the indicator has fallen to 47% after briefly crossing above the 50% threshold. This drop highlights mounting selling activity and signals a stronger potential for additional downward movement. Will LINK See A Recovery Or Further Decline? As the cryptocurrency approaches the $9.28 support level, which could spark a potential rebound, technical indicators like the RSI still point to strong selling pressure. If LINK fails to hold this level, a break below could result in persistent declines, potentially testing the $7.14 support level and even lower thresholds. Related Reading: Chainlink (LINK) Could Drop To $8 If It Loses Current Support: On-Chain Data Reveals However, should Chainlink manage to hold above this crucial support level, it could set the stage for a potential upward move toward the $11.10 resistance. A successful breakout through this resistance could ignite a significant rally, paving the way for the price to aim for the next key resistance at $12.44. If bullish momentum continues to build, Chainlink may even reach higher levels, extending the rally beyond current resistance points. Featured image from Medium, chart from Tradingview.com

Your Crypto Gateway

Claim 1,000
Free WCG Coins

World Crypto Global opens the door to digital freedom for everyone.
Manage your free WCG Coins securely—where simplicity meets global accessibility.

11 bn

FREE CRYPTO COINS

8.9 bn

AVAILABLE FOR RESERVATION

2.1 bn+

ALREADY ALLOCATED

× WCG Coin

🎉 Get 1,000 WCG Coins

No fees. No catch. Your crypto journey starts here.