W o r l d . C r y p t o . G l o b a l

Loading

Welcome at World Crypto Global. This portal is packed with useful content and resources to built out your own crypto skills. WorldCrypto is a site member of Gabriel Vega Network.

Contact Info

CATEGORY: signal


Sep 28, 2024 12:05

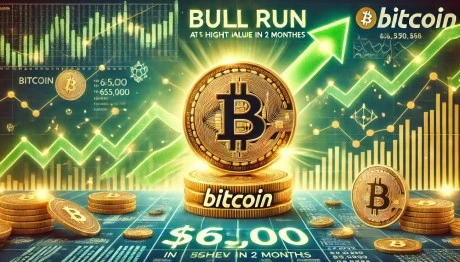
Bitcoin Futures Under Pressure: $64,000 Support Critical To Avert Long Squeeze

With Bitcoin (BTC) hitting a near three-month high of $66,000 on Friday, technical analyst InspoCrypto suggests that the BTC futures market is at a critical juncture, with the potential for further short squeezes and the importance of maintaining support around the $64,000 level. Divergence Despite BTC Uptrend The analyst recently noted in his writing that the latest data shows that the BTC/USDT price chart hit a Friday high of $66,106, reflecting bullish sentiment as the cryptocurrency continues to climb.  Over the past 24 hours, Bitcoin has seen a steady price increase, indicating optimism among investors. The True Strength Index (TSI) shows a slight divergence, indicating indecision in the market, but the upward trend remains intact. Related Reading: Solana Price (SOL) Pushes Higher: Surge Shows No Signs of Slowing Trading volume also plays a key role in understanding market dynamics, and current figures show a volume delta of $675.457 million, indicating a higher volume of buy orders than sell orders. This suggests buyers are currently dominating the market, supporting the bullish momentum. Notably, there has been a significant amount of short liquidations, totaling $331.24 million. This indicates that as Bitcoin’s price rises, many short positions are forced to close, further driving the price upward. In contrast, long liquidations remain comparatively low, suggesting that those holding long positions are confident in the markets direction. InspoCrypto’s heatmap analysis of Hyblock Capital shows a concentration of short liquidation levels around the $63,000 to $64,000 area. This clustering indicates a likely short squeeze that could push prices even higher.  However, the analyst shows that long liquidation levels appear more scattered, presenting a lower risk of cascading liquidations on the long side. Analyst Predicts Further Bitcoin Price Surge InspoCrypto further found that open interest (OI) in Bitcoin futures is rising, indicating increased interest in the market and a potential buildup for significant price movements.  The heatmap shows strong concentrations of open interest around the $64,000 to $65,000 range, suggesting that any price movement beyond these levels could trigger volatility as traders adjust their positions. The funding ratio currently stands at 763.8, indicating that the longs are paying off the shorts, adding to the bullish sentiment in the market. However, the analyst warns that a high funding ratio also signals a risk of long liquidation if the market unexpectedly shifts. Related Reading: XRP Struggles Below $0.60 Metrics Reveal Growing Selling Pressure Looking ahead, InspoCrypto anticipates that the next 24 hours could see continued upward momentum as shorts are squeezed. However, the elevated funding rates could lead to long liquidations if the market is downturned.  By the end of the week, InspoCrypto believes that if the current buying pressure continues, the Bitcoin price could reach prices around $68,000, inching closer to its all-time high of $73,700 in March this year. At the time of writing, BTC has seen a slight retracement to its current trading price of $65,800.  Featured image from DALL-E, chart from TradingView.com

Sep 27, 2024 12:05

Bitcoin Peaks At Highest Value In 2 Months Above $65,000: Bull Run Predictions

For the first time in nearly two months, Bitcoin (BTC) has surpassed the $65,000 mark, marking a significant recovery following two notable downturns in August and September. During these crashes, Bitcoin experienced a steep decline of 20% on two separate occasions, specifically on August 5 and September 6.  However, as October approachesa month often associated with a bullish resurgence for Bitcoinmarket predictions are increasingly optimistic, suggesting that the cryptocurrency might be gearing up for another major uptrend. Could Bitcoin Reach $79,000 In October? On Thursday, Bitcoin recorded a 3% increase within a 24-hour period, reaching a price of $65,500. This upward movement has sparked discussions among analysts about whether this signals the start of a parabolic bull run. Related Reading: BlackRock Continues To Buy Bitcoin: Holdings Now Reach 358,000 BTC Worth $22 Billion  Crypto investor Scott Melker expressed this sentiment, emphasizing that Bitcoin is currently attempting to establish its first higher high since peaking at $74,000 in March of this year.  Melker noted that closing above $65,000 would confirm a new upward trend, transitioning from the lows of $50,000 observed in August. This patterna low, high, higher low, and higher highsuggests a bullish market structure replacing the previous bearish trends. Historically, October has been a strong month for Bitcoin, with analysts like Lark Davis pointing out that the average return during this month is approximately 22.90%.  If Bitcoin were to experience a similar increase this year, it could potentially rise to around $79,000, surpassing its previous all-time high and overcoming key resistance levels. Such a move would set the stage for a powerful rally into November according to Davis analysis. Record-Breaking Performance In September In a further analysis, Rekt Capital provided insights into Bitcoin’s recent performance. He noted that September, often viewed negatively, turned out to be the best September for Bitcoin on record, with a 9% increase.  Rekt also highlighted historical patterns related to Bitcoins Halving cycles, indicating that Bitcoin typically breaks out from its re-accumulation range approximately 154 to 163 days post-Halving.  Currently, Bitcoin is 159 days past its last Halving that took place in April of this year. Based on previous cycles, Rekt believes that this timing suggests that a breakout could be imminent, reinforcing the idea that Bitcoin is well-positioned for significant gains in the near future. Related Reading: Dogecoin Eyes Bullish 50% Rally To $0.16, But Will A Crash Come First? The current resurgence can be attributed to the US Federal Reserve’s (Fed’s) dovish stance and recent 0.50% basis point (bps) interest rate cut on September 18, which was seen as a notable bullish catalyst not only for BTC but also for the broader market, which has followed Bitcoin’s performance to the upside in recent days.  In addition, last week saw a resumption of inflows into the Bitcoin ETF market, following steady outflows throughout August and early September. For instance, US spot Bitcoin ETFs had a total net inflow of $106 million on Wednesday, continuing their net inflows for 5 consecutive days. BlackRock’s IBIT ETF had an inflow of $184 million. Overall, there seems to be a combination of bullish catalysts in place for the market’s largest cryptocurrency to continue its recovery, with massive gains expected in the last half of the year and early 2025.  Featured image from DALL-E, chart from TradingView.com

Sep 24, 2024 05:50

Is Altcoin Season Coming? These Two Signals Could Suggest So

An analyst has pointed out two patterns forming in altcoin and Bitcoin-related charts that could suggest an altseason may be coming soon. Signs May Finally Be Aligning For An Altcoin Season In two new posts on X, analyst Ali Martinez has discussed some signals that could foreshadow an altcoin season. The first chart shared by [...]

The post Is Altcoin Season Coming? These Two Signals Could Suggest So appeared first on Crypto Breaking News.

XRP $0.60 Triangle Breakout Could Ignite Parabolic Rally  Key Levels To Watch

Author: Sebastian Villafuerte
United Kingdom
Sep 24, 2024 12:05

XRP $0.60 Triangle Breakout Could Ignite Parabolic Rally Key Levels To Watch

XRP trades at a pivotal moment after several days of volatile price action, sparking renewed optimism among investors. Some analysts believe that XRP is on the verge of breaking out from a massive 4-year bullish triangle pattern, which has served as an extended accumulation period.  Related Reading: Bitcoin Indicator Signals Shift To Bullish Territory Can BTC Break Past $65,000? This technical formation has been steadily building up, and now XRP appears poised for a significant expansion phase. Following years of underperformance caused by the ongoing SEC lawsuit and broader economic uncertainty, the market is watching closely for a potential breakout. If XRP breaks through its current resistance levels, many expect a parabolic rally, potentially leading to new highs. Investors eagerly await confirmation of this move, viewing it as a crucial moment in XRP’s long-term market trajectory. As momentum builds, XRP’s next moves could define its performance in the coming months and its role in the broader crypto market.  XRP Price Action Suggests A Bullish Breakout  The entire crypto market has experienced a surge, with Bitcoin and many altcoins seeing double-digit percentage increases in price. This rally follows the Federal Reserve’s recent decision to cut interest rates by 50 bps, sparking optimism among investors who believe a new crypto bull run is on the horizon. XRP investors also feel optimistic, as analysts share promising insights suggesting positive performance in this cycle. Related Reading: Ripple Whales Accumulate Over 380 Million XRP in Just 10 Days: Is A Breakout Near? One prominent crypto analyst, Carl Runfelt, shared his technical analysis on X, highlighting the bullish triangle pattern that XRP has been forming since 2020. According to Runfelt, XRP could see explosive growth during this bull cycle, potentially going parabolic and rising by over 200% within weeks if the pattern breaks. The key level to watch is $0.60, which has acted as significant resistance in recent weeks. If XRP breaks above this critical price point, it could trigger a wave of “fear of missing out” (FOMO), driving substantial demand and pushing prices to new highs. Investors are closely watching this level, anticipating a breakout that could reshape XRPs trajectory for the remainder of the cycle. Pivotal Liquidity Levels XRP is currently trading at $0.587, sitting at a crucial level that could ignite a massive rally for the altcoin. After surging 15% since early September, the price is testing the weekly 200 moving average (MA) at $0.609 as resistance, a level that has held XRP down since April. Breaking through this barrier is essential for bulls aiming to extend the rally. XRP has reclaimed the weekly 200 exponential moving average (EMA) at $0.52, a strong demand zone since early July. This level will be key in holding up the price if a correction occurs. Related Reading: Crypto Analyst Predicts Dogecoin Will Surge 1,000% Past ATH Price Targets Revealed For XRP to continue up, the price must break the $0.60 level and reclaim the 1W 200 MA as support. A clean break above these levels would signal the potential for a larger rally and a shift in market sentiment. However, failure to close above current levels could lead to more sideways consolidation or even a deeper pullback. In that scenario, XRP may retest the weekly 200 EMA at $0.52, which could work as a critical support level. Featured image from Dall-E, chart from TradingView

Sep 18, 2024 05:50

Massive Bitcoin Rally Predicted For Next 6 Months After Fed Rate Cut

As the crypto community awaits the Federal Reserve’s (Fed) rate cut announcement on September 18, the stakes are high for Bitcoin (BTC) and the broader financial landscape. This upcoming decision marks the first central bank rate cut since the Fed slashed its key rate to near zero in March 2020 amid the COVID-19 pandemic.  Will A [...]

The post Massive Bitcoin Rally Predicted For Next 6 Months After Fed Rate Cut appeared first on Crypto Breaking News.

Sep 17, 2024 05:50

Bitcoin Alert: Analyst Predicts New Blood Monday With 0.50% Fed Rate Cut Looming

As Bitcoin (BTC) grapples with a challenging market environment, it has struggled to regain momentum, hovering around the $53,000 and $60,000 levels for six consecutive weeks.  After losing the crucial $70,000 threshold on August 1, the largest cryptocurrency remains at risk of further declines, particularly with the upcoming Federal Reserve (Fed) meeting on September 18, [...]

The post Bitcoin Alert: Analyst Predicts New Blood Monday With 0.50% Fed Rate Cut Looming appeared first on Crypto Breaking News.

Sep 13, 2024 05:55

Bitcoin Price Forecast: Trump Win Could Boost BTC To $125,000, Standard Chartered

Geoff Kendrick, the Head of Crypto Research at Standard Chartered Bank, has put forth bullish predictions regarding the Bitcoin price trajectory in the event of the 2024 US presidential election.  Bitcoin Price Predictions Soar According to a CNBC report, Kendrick posits that a potential re-election of Donald Trump could propel Bitcoin to a staggering $125,000 [...]

The post Bitcoin Price Forecast: Trump Win Could Boost BTC To $125,000, Standard Chartered appeared first on Crypto Breaking News.

Is Chainlink (LINK) $12 Breakout Imminent? Data Reveals A Rising Open Interest

Author: Sebastian Villafuerte
United Kingdom
Sep 12, 2024 12:05

Is Chainlink (LINK) $12 Breakout Imminent? Data Reveals A Rising Open Interest

Chainlink is in a consolidation phase after weeks of volatility and selling pressure. The price currently holds above a support level of $10, a crucial liquidity level. The altcoin attracts the attention of analysts and investors who anticipate higher prices soon.  Related Reading: Solana (SOL) Surges Past $130 Resistance As Funding Rate Signals Bullish Momentum Data from Santiment reveals rising open interest, which signals sustained demand for Chainlink. As more traders and investors build positions, this increase in open interest suggests that a price rally could be on the horizon. This stabilization around the $10 mark has given some confidence to those who believe LINK may be poised for a breakout. Many analysts see this as a potential turning point for Chainlink, with its current price action reflecting growing optimism for future gains. If the consolidation holds and momentum builds, LINK could potentially push past its recent resistance and aim for higher levels. Chainlink Investors Showing Confidence  Chainlink is testing key supply at its current levels, and top traders and investors are confident in a potential rise for LINK in the coming weeks. One significant indicator signaling strength is the rising Open Interest (OI), as revealed by Santiment. OI tracks the number of active contracts tied to a cryptocurrency, serving as a reflection of market engagement. When OI increases, it signals growing liquidity and interest in the market, while a decrease in OI typically points to reduced exposure. From a price analysis perspective, a rise in OI combined with a price dip often confirms a continuing downtrend. On the other hand, if OI decreases while the price rises, it may signal a bearish reversal. In Chainlinks case, both OI and price are increasing, which suggests that the current uptrend could persist. As investors monitor the market, many are waiting for price confirmation above current levels to keep the momentum going and shift the overall negative sentiment that has clouded Chainlink in recent weeks. Related Reading: Cardano (ADA) Rally Brewing? On-Chain Metrics Suggest Investors Optimism LINKs breakout could fuel a bullish run, as traders expect a more bullish trajectory in the short term. The rising OI serves as a strong indicator that market participants are increasingly confident in LINK’s potential for further gains. LINK Price Testing Supply At $10.8 Chainlink (LINK) is trading at $10.40 after testing local resistance at $10.83, positioning for a potential breakout toward higher prices. The price is struggling to clear the 4-hour 200 moving average (MA) at $10.71, a key indicator that has acted as a resistance since late August. For bulls to maintain momentum, LINK must reclaim the 4H 200 MA and target the next resistance at $12.70. Breaking past this level would signal a reversal and could lead to a more sustained uptrend, offering investors hope for further gains. However, if LINK fails to break through the 4H 200 MA, the altcoin will likely face a pullback, with support anticipated at lower demand levels around $9.30. A failure to hold this support could result in even lower prices, reinforcing the downside risk for traders. Related Reading: Avalanche (AVAX) Ready To Target $28: Investors Expect A Reversal The coming days will be crucial for LINKs price trajectory as the battle between bulls and bears intensifies. Featured image from Dall-E, chart from TradingView

Sep 11, 2024 12:05

Bitcoin Shakeout Ahead: Analysts Predict Final Dip Before Bull Run Resumes

The Bitcoin market has seen some consolidation since Monday, maintaining a price above the $56,000 mark after a brief drop from $65,000 to around $52,600 last Friday.  However, one analyst suggests that the bearish sentiment may still be ongoing, with expectations of a potential revisit to lower levels before a significant upward movement. BTCs Future Price Action In Focus Crypto analysts known as VirtualBacon on X (formerly Twitter) have raised concerns about an impending huge Bitcoin shakeout. In the coming 2-3 weeks, the analyst explains that Bitcoin could experience one last decline before initiating a bull run.  Panic is everywherepeople are calling for lows in the $40,000s, claiming the bull run is over, VirtualBacon noted. Yet, he argues that whether Bitcoin dips to $45,000, $48,000, or even $43,000, a bull run remains on the horizon. This period often sees a shakeout of many holders right before significant rallies. Related Reading: Solana (SOL) Surges Past $130 Resistance As Funding Rate Signals Bullish Momentum While the current charts indicate lower highs and lower lows, suggesting a downtrend, VirtualBacon believes that a prolonged bear market appears unlikely. The primary driver of this sentiment is the anticipated liquidity injection and interest rate cuts by the Federal Reserve, conditions that typically favor a bull run, particularly looking ahead to 2025. Another crucial aspect of VirtualBacons analysis lies in Bitcoin’s key support levelthe 100-week Exponential Moving Average (EMA). This level has historically marked the end of bear markets, with Bitcoin bouncing off similar levels in 2015 and 2019.  Currently, this support level sits around $45,000, with various technical indicators, including Fibonacci retracements and high-volume nodes, suggesting strong support in the $43,000 to $49,000 range. Even if Bitcoin does dip into this range, the analyst believes it would likely be a temporary “wick” rather than a sustained drop. VirtualBacon also highlights that some traders speculate about around $50,000 to $51,000. However, this could be risky; a touch at these levels might trigger a cascading liquidation event that could push prices to $44,000. How Upcoming Fed Decisions May Fuel Bitcoin Bullish Momentum Historically, September has been a weaker month for Bitcoin. However, the upcoming monthsOctober, November, and Decembertend to show more bullish trends. VirtualBacon notes that over the last decade, eight out of ten Octobers have ended positively for Bitcoin, with November also historically strong. The backdrop of this market analysis coincides with the Federal Reserve’s upcoming Federal Open Market Committee (FOMC) meeting, where the analyst predicts a 70% chance of a 25 basis point rate cut and a 30% chance of a double cut.  VirtualBacon notes that this could initiate a 12-month liquidity injection cycle that typically boosts risk assets like BTC and propels the leading cryptocurrency above current all-time high levels of $73,700. Related Reading: Ethereum In 3 Months: Legendary Analyst Reveals Prediction For December Despite the prevailing fear in the market, as the Fear and Greed Index indicates, the analyst argues that this fear may be irrational, especially with the impending monetary policy shifts. As the Fed begins to cut rates, sentiment is expected to shift rapidly, potentially leading to renewed interest and investment in Bitcoin. BTC trades at $56,930 when writing, recording a slightly 0.7% gain in the last 24 hours. Featured image from DALL-E, chart from TradingView.com

Aug 08, 2024 05:50

MicroStrategys Michael Saylor Reveals Bitcoin Holdings Top $1 Billion

In a bold display of faith in the future of the largest cryptocurrency on the market, Bitcoin (BTC), MicroStrategy co-founder and executive chairman Michael Saylor has disclosed that he owns around $1 billion. Saylor’s Bitcoin Vision Unshaken In a recent interview with Bloomberg Television, Saylor disclosed that he has been steadily accumulating Bitcoin over the [...]

The post MicroStrategys Michael Saylor Reveals Bitcoin Holdings Top $1 Billion appeared first on Crypto Breaking News.

Aug 24, 2024 12:05

Bitcoin Price Breaches $62,000: Market Reacts To Powells Speech

In a week marked by economic anticipation and turbulence, the crypto market experienced a rollercoaster ride as the Bitcoin price surged and retreated in response to Federal Reserve Chair Jerome Powell’s remarks at the Jackson Hole Economic Symposium. Bitcoin Price Rallies On Powell’s Dovish Tones Powell’s remarks struck a dovish tone, indicating that the central bank is open to further interest rate cuts in the coming months to address potential cooling in the labor market. This stance was positive for risk assets like Bitcoin, as it signals a more accommodative monetary policy stance from the Fed. Related Reading: Algorand Achieves New Record With 2 Billion Transactions, ALGO Price Jumps 14% Indeed, the Bitcoin price rapidly breached the $62,000 mark, a level it had not seen in over a week, as investors reacted positively to Powell’s comments. However, the rally was short-lived, as the price subsequently retreated to around $60,800. According to crypto analyst Inspo Crypto, Bitcoin now faces a critical juncture:  We have to wait and see if Bitcoin consolidates below $61,000 again or heads towards the lower end of the upward channel, which is right at $60,000. If that breaks, we still have a safety net at $59,500. However, if BTC stays above $61,000 and the selling pressure eases, it could be an interesting and, above all, bullish weekend. Key Indicators Flip Positive Another analyst, Rekt Capital, noted that the Bitcoin price still lacks a daily close above $62,000, which would be needed to confirm a continuation of the recent price recovery.  However, Rekt Capital suggested that Bitcoin could form a bullish flag pattern, similar to the one seen in early March 2024, which could enable a move towards $65,000 or higher over time. Market expert Ali Martinez highlighted a positive development, noting that Bitcoin’s bull-bear market indicator has switched back to bullish after oscillating between bearish and bullish territory since early August.  This, Martinez suggests, could further bolster the case for continuing the price recovery witnessed over the past two weeks after Bitcoin briefly dipped to a 6-month low of $49,000 earlier this month. Related Reading: The Shiba Inu Shibarium Suffers 97.6% Crash In Active Accounts, Whats Going On? Looking ahead, Martinez has identified two crucial resistance levels to watch for Bitcoin: $64,045 and $66,250. According to Martinez, if the cryptocurrency can maintain support at $60,365, a move toward these higher price points could be in the cards.  https://www.tradingview.com/x/V0tMHEUY/ For now, the Bitcoin price seems to have stabilized around $61,600 after the notable spike in volatility minutes after Powell’s speech. CoinGecko data shows that the largest cryptocurrency on the market is still up 2% in the 24-hour time frame.  It will be important to watch what price BTC closes the day at, as it will be important to gauge the next week’s price movement before the expected monthly close.

Aug 23, 2024 05:50

Aave Forms Sell Signal That Led To 27% Average Correction Last 4 Times

An analyst has pointed out how Aave is currently forming a bearish pattern that led to significant drawdowns the last four times it occurred. Aave Is Showing A TD Sequential Sell Signal Right Now In a new post on X, analyst Ali Martinez has discussed about a Tom Demark (TD) Sequential signal that has taken [...]

The post Aave Forms Sell Signal That Led To 27% Average Correction Last 4 Times appeared first on Crypto Breaking News.

Aug 23, 2024 05:50

Bitcoin Could Target $63,000 But Must First Clear This Vital Resistance Level

After experiencing a significant 25% pullback earlier this month, plunging to the $49,000 level, the king of cryptocurrencies, Bitcoin (BTC), has managed to consolidate above the crucial $60,000 support for the last 24 hours. However, Bitcoin’s journey toward further price appreciation has been without obstacles. The digital asset has been unable to surpass higher resistance [...]

The post Bitcoin Could Target $63,000 But Must First Clear This Vital Resistance Level appeared first on Crypto Breaking News.

Is A Bitcoin (BTC) Negative Correlation With Stocks A Bullish Signal? Analyst Reveals

Author: Sebastian Villafuerte
United Kingdom
Aug 22, 2024 12:05

Is A Bitcoin (BTC) Negative Correlation With Stocks A Bullish Signal? Analyst Reveals

Bitcoin (BTC) and U.S. stocks have shown a negative correlation lately, with Bitcoin often moving in the opposite direction of traditional markets. This divergence has caught the attention of analysts and investors, especially as the cryptocurrency enters a period of consolidation along with the broader crypto market. Historically, shifts in this correlationfrom negative to positivehave often signaled a bullish trend for Bitcoin.  Related Reading: Battleground At $60,000: Bitcoin Faces Pivotal Test As Bulls Aim To Reclaim Key Support As both markets face challenges, the changing dynamics between BTC and U.S. stocks could provide crucial insights into where the market is headed. Investors are closely watching this relationship, anticipating that a shift could indicate a potential breakout for Bitcoin. Bitcoin Data Suggests Potential Uptrend The negative correlation between Bitcoin (BTC) and the U.S. stock market, particularly the S&P 500 (SPX), has become increasingly evident. Prominent analyst and trader Daan on X recently highlighted this phenomenon by overlaying the BTC/USDT futures chart with SPX prices. His analysis shows that while traditional markets like the SPX have experienced a swift recovery, Bitcoin has not followed suit. This divergence underscores the decoupling between these two markets, with Bitcoin lagging behind the broader stock recovery. Another key analyst, Caleb Franzen, brought attention to this trend, sharing data revealing Bitcoins negative correlation with major stock indices. Specifically, Franzen points out that the 90-day correlation between Bitcoin and the Nasdaq-100 ($QQQ) currently stands at -27%. This negative correlation suggests that as tech stocks recover, Bitcoin has been moving in the opposite direction, which can signify unique market dynamics. While periods of negative correlation between Bitcoin and stocks are not inherently bullish, historical evidence suggests that positive market shifts often follow such phases. The critical point for investors is to monitor a potential reversal of this correlationwhen Bitcoin begins to move in tandem with the Nasdaq-100 ($QQQ) once again. If Bitcoin’s correlation with tech stocks turns positive, it could signal a strengthening market and a possible uptrend for BTC. This shift could provide a key indicator for timing potential entry points in the market. BTC Price Trading Below A Key Indicator Bitcoin trades at $59,350, below the critical daily 200-day moving average (MA) at $62,915. This moving average is a key indicator many analysts use to gauge market trends. When BTC’s price is below the daily 200 MA, it typically suggests a downtrend or a significant correction. Conversely, trading above this level indicates market strength and bullish momentum. For Bitcoin to confirm the continuation of its bull market, it needs to reclaim the daily 200 MA and consistently close above it. This would signal a potential shift in trend, providing confidence to traders and investors that the bullish phase is still intact. Currently, BTC is hovering around the key psychological level of $60,000, and the market remains in a consolidation phase after enduring months of uncertainty and volatility. For the bullish scenario to unfold, Bitcoin must break above $63,000, retaking the daily 200 MA and surpassing the August 8th local high of $62,729. This would mark a significant recovery and indicate that the market is regaining its strength. Related Reading: Battleground At $60,000: Bitcoin Faces Pivotal Test As Bulls Aim To Reclaim Key Support On the other hand, if BTC fails to close above $57,500 in the coming days, it could signal further downside pressure, potentially leading to a pullback to sub-$50,000 levels. The coming days will be crucial in determining whether Bitcoin can regain its upward momentum or if more bearish pressure lies ahead. Cover image from Dall-E, charts from TradingView.

Aug 20, 2024 12:05

Bitcoin Price Action Watch: 3 Pivotal Zones That Could Sway BTCs Next Move

As the Bitcoin price consolidates below the $60,000 threshold, the market has been characterized by a mix of indicators and technical levels, leading to a divided forecast and heightened uncertainty. Mixed Signals Cloud Bitcoin Price Trajectory According to Bitcoin maximalist Mark Cullen, the current Bitcoin price action presents a complex technical picture. He suggests that the $57.5,000 level will likely be tested, and the key question is whether it will hold.  Cullen believes it will, at least initially, before potentially breaking lower. He also highlights the importance of the $59,500 level, stating that if Bitcoin can push through, it would be a strong signal to heavily long the asset with a tight stop-loss below. Related Reading: MATIC Price (Polygon) Sets Sights Higher: Can It Gain Bullish Momentum? However, Cullen also warns of the potential for a sweep of the liquidity below the $54,500 level, which could pave the way for a move to new lows in the $40,000 range if that level is breached. Crypto analyst Axel Adler also points to a similar picture, highlighting that as the Bitcoin price currently trades below its 200-day simple moving average (SMA), this could lead to further bearish continuation for BTC. According to Adler’s analysis, the next support level is the 365-day SMA at $50,000. What Do BTCs On-Chain Fundamentals Say? Compounding the technical uncertainty, the data intelligence platform Glassnode has reported that Swissblock’s Bitcoin Fundamental Index (BFI) moved from positive to neutral territory last week.  According to the platform’s co-founders Yan Alleman and Jan Happel, this shift reflects the uncertainty surrounding the Black Monday event and the post-Consumer Price Index (CPI) bull trap felt on the chain. The BFI, composed of two sub-metrics measuring network liquidity and network growth, has recently shown a bifurcation. While network liquidity has dropped into neutral territory, network growth has risen, painting a complex picture of Bitcoin’s fundamental outlook. Related Reading: XRP Price Set To Breakout: Will It Trigger A Strong Rally? Alleman and Happel note that the drop in network liquidity, while concerning the short term, is not necessarily a bearish signal in the long run. They explain that increased network liquidity is desirable, as it enhances Bitcoin’s functionality as a medium of exchange. However, the rise in network growth is seen as a strong bullish sign, indicating that more players interact with the Bitcoin network on an entity-adjusted basis. This effectively creates a deeper pool of crypto-native capital, which could support the asset’s long-term valuation. The Glassnode co-founders stated: Given the current store-of-value ‘digital gold’ narrative and the increased ease of getting BTC exposure via ETFs, CEXes, etc., rising network growth is a strong bullish sign. When writing, the Bitcoin price is $58,680, down over 2% in the last 24 hours. Featured image from DALL-E, chart from TradingView.com

Aug 17, 2024 12:05

When To Be Bearish On Bitcoin? On-Chain Analyst Answers

An on-chain analyst has explained signals in several metrics to see if Bitcoin is in a bearish phase. These Bitcoin Indicators Could Be To Follow For Bear Market Signals In a new post on X, on-chain analyst Checkmate replied to a user asking about an on-chain metric indicating when it’s time to turn bearish on cryptocurrency. Checkmate has shared two indicators: the Short-Term Holder Realized Profit/Loss Momentum and the Short-Term Holder MVRV Ratio Momentum. “Short-Term Holders” (STHs) here refer to the Bitcoin investors who bought their coins within the past 155 days, meaning that both of these metrics are only for the recent buyers in the market. Related Reading: Bitcoin Observes Pullback To $58,000: Is This The Cause? First, the “Realized Profit/Loss Momentum” measures, as its name suggests, the momentum in the ratio of the profit and loss that the STHs are realizing through their selling. Below is the chart for the indicator posted by the analyst. According to the analyst, it is time to be bearish when the oscillator on the bottom of this chart turns red (corresponding to negative momentum in the STH Realized Profit/Loss). The graph shows that this oscillator assumed negative values soon after the price set its new all-time high (ATH) and has since remained in the region. And indeed, while the indicator has seen these values, Bitcoin has been going through a rough phase. The STH MVRV Ratio Momentum’s second indicator works similarly and keeps track of the distance between the Market Value to Realized Value (MVRV) Ratio for this cohort and its 155-day moving average (MA). The MVRV Ratio is a popular indicator that tells us how the value held by the investors (the market cap) compares against what they used to purchase their coins (the Realized Cap). In other words, the metric provides information about the unrealized profit/loss of the holders. Thus, whereas the Realized Profit/Loss keeps track of the net profit/loss the investors are harvesting through their selling, this metric tells us about the profit/loss they have yet to take. Related Reading: This Is The On-Chain Level That Made The Bitcoin Crash Bottom Here is the data for the momentum indicator for the MVRV Ratio specifically for the STHs: According to the analyst, just like with the first indicator, this one also gives a bearish signal when the momentum turns red. As the chart shows, the STH MVRV Ratio has been under its 155-day MA for the same period as the bearish momentum in the Realized Profit/Loss, thus providing confluence to the signal. BTC Price Bitcoin had pushed towards $62,000 earlier in the week, but the asset has since slipped up as it’s now back at $57,800. Featured image from Dall-E, checkonchain.com, chart from TradingView.com

Key Bitcoin bull signal flashes for first time in nearly 2 years, hinting at 2x price surge

Author: Cointelegraph by Zoltan Vardai
United States
Aug 16, 2024 12:00

Key Bitcoin bull signal flashes for first time in nearly 2 years, hinting at 2x price surge

The Bitcoin price could increase by over two-fold based on a key bull signal historically correlated with price rallies.

Jul 10, 2024 05:50

Massive Mt. Gox Bitcoin Shift Unlikely To Disrupt Prices, Says CryptoQuant CEO

Recent developments surrounding the repayment of creditors and investors of the defunct Bitcoin (BTC) exchange, Mt. Gox, have sparked concerns about potential effects on Bitcoin’s price.  As the market retraced over 20% from its three-month high above $70,000, the movement of 47,000 BTC to repay creditors has raised questions about the market’s stability.  However, industry [...]

The post Massive Mt. Gox Bitcoin Shift Unlikely To Disrupt Prices, Says CryptoQuant CEO appeared first on Crypto Breaking News.

Jul 06, 2024 12:05

Social Media Screams Sell As Bitcoin Crashes To $54,000: Buy Signal?

Data shows users on social media platforms have been calling to sell Bitcoin after its latest crash, a signal that contrarian traders may be waiting for. Bitcoin Sentiment On Social Media Has Turned Quite Bearish According to data from the analytics firm Santiment, social media is showing historic levels of FUD amid the market drawdown. The indicator of interest here is the “Social Volume,” which basically tells us about the degree of discussion around a given topic or term that users on the major social media platforms are currently participating in. This metric works by going through posts/threads/messages on these platforms to look for mentions of the keyword. The indicator then counts up the number of posts that contain at least one such mention. Related Reading: Bitcoin Traders Sink Into Fear As Price Crashes Below $58,000 The reason the Social Volume doesn’t simply count up the mentions themselves is that mentions alone don’t contain any information about if the trend is being followed across social media as a whole. Sometimes, for example, mentions can be high for a topic, but most of them could be limited to niche circles (that is, inside a few posts). The Social Volume naturally wouldn’t spike in this case, but it would when users across the platforms are making posts about the term. Now, what the analytics firm has done here is that it has applied terms related to sentiment to Social Volume, to differentiate between discussions related to positive and negative sentiments. Here is the chart shared by Santiment that shows how the Social Volume for negative and positive sentiments has changed alongside the recent Bitcoin volatility: To discern the sentiment, the analytics firm has chosen terms such as buy, bottom, and bullish in the case of positive sentiment, and sell, top, and bearish for negative sentiment. From the graph, it’s visible that the Social Volume for the latter type of keywords has observed a huge spike alongside the plunge in the Bitcoin price. This would imply that a large amount of bearish posts have popped up on social media. The indicator has also spiked for terms pertaining to positive sentiment, but clearly, the scale has been lesser than the one for bearish terms. In fact, the latest ratio between sell and buy calls has actually been the largest observed in the year so far. Thus, it would appear that social media users as a whole are feeling FUD towards Bitcoin. This may actually be a positive development for the cryptocurrency, however, as its price has historically been more likely to move in the opposite direction to what the crowd expects. Related Reading: Why Did Bitcoin Plunge Under $58,000? On-Chain Data Says This As is apparent in the chart, buying calls had spiked on a few occasions following price plunges in the past month, but this optimism had only led to a continued decline for the asset. With the latest crash, sentiment appears to have finally flipped, with Bitcoin traders starting to give up. “For bold traders, this is a window that some may wish to be a true contrarian and buy into the crowd’s anger and frustration,” notes Santiment. BTC Price Bitcoin had briefly slipped under the $54,000 level during the plunge, but the asset appears to have bounced back to $55,400 since then. Featured image from Dall-E, Santiment.net, chart from TradingView.com

Jul 05, 2024 05:50

Glassnode: Bitcoin $110,000 Target Holds, Breaking These Key Levels Crucial To Avoid Crash

Bitcoin (BTC) experienced a significant drop, reaching as low as $56,700 on Thursday. This price level has not been seen since May 1st, as Bitcoin faces several challenges, including US political uncertainties and the ongoing sell-off of BTC seized by the German government. These factors have contributed to a nearly 20% price correction for Bitcoin, [...]

The post Glassnode: Bitcoin $110,000 Target Holds, Breaking These Key Levels Crucial To Avoid Crash appeared first on Crypto Breaking News.

Your Crypto Gateway

Claim 1,000
Free WCG Coins

World Crypto Global opens the door to digital freedom for everyone.
Manage your free WCG Coins securely—where simplicity meets global accessibility.

11 bn

FREE CRYPTO COINS

8.9 bn

AVAILABLE FOR RESERVATION

2.1 bn+

ALREADY ALLOCATED

× WCG Coin

🎉 Get 1,000 WCG Coins

No fees. No catch. Your crypto journey starts here.