Solana Price Explodes Past Key Resistance as Long/Short Ratio Hits 30-Day High More Upside Ahead?
Solana (SOL) price surges 40% from its 1-year low, breaking key resistance as long/short ratio hits a 30-day high of 1.06.
Loading
Welcome at World Crypto Global. This portal is packed with useful content and resources to built out your own crypto skills. WorldCrypto is a site member of Gabriel Vega Network.

Solana (SOL) price surges 40% from its 1-year low, breaking key resistance as long/short ratio hits a 30-day high of 1.06.
The analytics firm Glassnode has revealed the Solana price levels that could be important to watch, based on on-chain accumulation data. Solana Cost Basis Distribution Reveals Where Supply Is Most Concentrated In a new post on X, Glassnode has discussed about the UTXO Realized Price Distribution (URPD) of Solana. The URPD is an indicator that basically tells us about how much of the SOL supply was purchased at which price levels. Naturally, the metric uses the last transaction price of any token in circulation as its cost basis. Related Reading: Bitcoin Transfer Count Lowest Since 2023Is This Bearish? First, here is how the URPD looked when the cryptocurrency set its new all-time high (ATH) back in January: From the graph, it’s apparent that a few price levels like $144 stood out in terms of the amount of supply that they hosted. At the price levels closer to the new ATH, however, supply was quite thin, meaning not many coins changed hands there. In on-chain analysis, the potential of any level to act as support or resistance is measured in terms of the amount of supply that it hosts. This means that levels that have a large cluster around them on the URPD are the ones of importance to the asset. As for why this is so, the answer lies in investor psychology: holders are sensitive to retests of their cost basis. Whenever the price touches a large cost basis cluster, the investors who are holding these coins may respond by making some panic moves. These moves can tend toward buying if the retest is happening from above, as investors may want to defend their profit-loss boundary. In retests happening from below, however, the traders could react by selling instead, as they may seek to exit at their break-even. When SOL reached its ATH, there was a lack of support nearby. This may be why the asset ended up falling into the cluster that did carry a significant amount of supply. Below is a chart that shows how the URPD has changed following the price drawdown. From the graph, it’s visible that if SOL continues its downtrend, it may have to end up relying on the freshly grown $112 level. In January, this level hosted the cost basis of 4 million tokens, but today, the figure has grown to 9.7 million, equivalent to 1.67% of the entire supply. Beyond this level, Glassnode notes, “$94, $97, and $100 collectively hold nearly 21M SOL (3.5% of supply).” In the scenario that these support levels fail, Solana may find itself in trouble, as there aren’t any major supply clusters until $53. Related Reading: Dogecoin Shark & Whale Population RisesPrice Turnaround Incoming? In terms of the levels above, the $135 and $144 levels stand out, as they hold the acquisition level of 26.6 million and 27 million coins, respectively. These levels could act as major obstacles in SOL’s recovery. SOL Price Solana has jumped more than 5% over the last 24 hours to recover to the $130 level. Featured image from Shutterstock.com, Glassnode.com, chart from TradingView.com
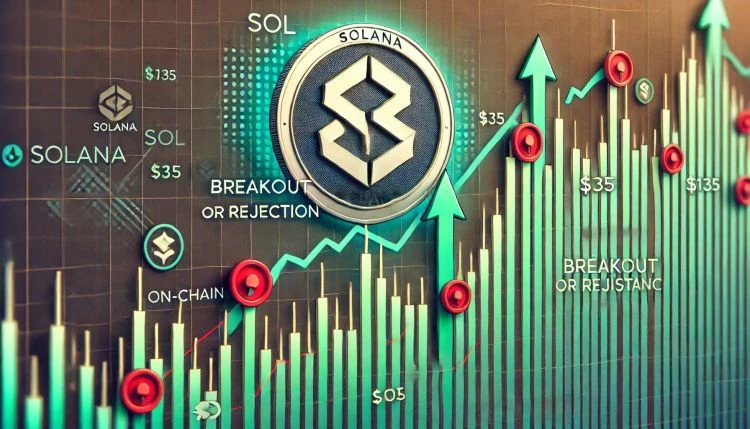
Solana has been struggling since late January, experiencing a sharp decline alongside the broader crypto market. SOL has lost over 60% of its value, with bulls now fighting to hold onto current price levels. Analysts remain skeptical, calling for a continuation of the downtrend as Solana struggles to reclaim higher levels. Related Reading: Bitcoin Accumulation Resumes After 3 Months Of Distribution Analyst Despite the negative sentiment, some investors remain optimistic about a quick and strong recovery in the coming months. They argue that market conditions could shift rapidly, especially if broader economic factors and liquidity conditions improve. On-chain data from Glassnode reveals that Solana faces a major test, as $135 is the most important resistance level according to the UTXO Realized Price Distribution (URPD) indicator. This metric identifies key price levels where large amounts of SOL have previously changed hands, making $135 a critical level for price action. If SOL can break and hold above $135, it could signal a trend reversal and open the door for a potential recovery. However, failure to reclaim this level could result in further downside, reinforcing the bearish outlook. The coming weeks will be crucial for determining Solanas next major move. Solana Struggles Below Key Resistance as Bears Take Control Solana has been trading under heavy selling pressure, struggling to reclaim key levels after weeks of market uncertainty. Bulls lost control once SOL dropped below the $180 mark, and now speculation about a prolonged bear market is rising. The price remains stuck below key resistance, making a recovery challenging. Top analyst Ali Martinez shared insights on X, revealing that Solana faces a major test at the $135 level, which has been identified as the most important resistance based on the UTXO Realized Price Distribution (URPD) indicator. The URPD indicator is an on-chain metric that tracks the price levels at which coins were last moved. It highlights significant areas of accumulation, showing where investors have previously bought and sold. When many tokens have changed hands at a specific price, that level becomes a critical support or resistance zone. In Solanas case, $135 represents a level where a large amount of SOL was last transacted. This means that if bulls reclaim $135, it could act as strong support and signal a trend reversal. However, if SOL fails to break above it, bears could reinforce selling pressure, leading to further downside. Related Reading: Ethereum Is Retesting A 5-Year Long Trendline Massive Rally Incoming? Solana Faces Key Support Test at $126 Solana (SOL) is trading at $126 after experiencing massive selling pressure in recent weeks. The price has been in a strong downtrend, failing to reclaim key levels as market-wide uncertainty and volatility continue to drive sentiment. Currently, SOL is sitting at a crucial weekly demand level, which bulls must defend if they want to initiate a recovery or at least establish a consolidation phase around current prices. Holding this support could provide the foundation for a relief rally, but the market remains fragile. If SOL loses the $120 level, selling pressure could intensify, potentially sending the price toward the $100 mark or even lower. A break below this demand zone would indicate further weakness and could trigger panic selling, leading to deeper losses across the altcoin market. Related Reading: 130,000 Ethereum Moved Off Exchanges Bullish Signal? For any meaningful recovery, bulls need to push SOL above $135 and reclaim $150 to shift momentum in their favor. Until then, downside risks remain high, and traders will closely watch how Solana reacts at this critical support level in the coming days. Featured image from Dall-E, chart from TradingView
Solana (SOL) is facing severe selling pressure as it tests key demand levels, with bears gaining control after a failed breakout above all-time highs. The price has struggled to maintain momentum, and investors are now watching for critical support levels that could determine Solanas next move. Related Reading: Bitcoin Trades At Discount For The Past Month Signaling Selling Pressure What This Means After an explosive rally earlier this year, SOL is now at risk of breaking lower as market sentiment turns uncertain. Top analyst Carl Runefelt shared a technical analysis on X, revealing that Solana might retest a horizontal resistance if it breaks down a bearish flag pattern. This key level will be crucial in determining whether SOL can hold its ground or if it will be dragged into a deeper correction. If the bearish flag confirms a breakdown, SOL could drop to test lower demand zones, leading to further downside pressure. However, if bulls manage to reclaim key resistance levels, a potential recovery could be on the table. The coming days will be critical for Solana as traders look for signs of a trend reversal or continued bearish momentum. Solana Enters A Critical Phase Solana is at a crucial phase, with the next few days set to define whether it will continue its downtrend or establish a structural price change. After failing to sustain its bullish momentum above all-time highs, bears have taken control, pushing SOL into key demand levels. The price has now dropped to $220, and analysts are warning that lower levels may come in the following weeks. Top analyst Carl Runefelt shared a technical analysis on X, highlighting that Solana might retest horizontal resistance around $222 if it breaks down a daily bearish flag. If this bearish pattern plays out, SOL could drop even further to test the $211 level, a major demand zone that will likely decide the trends fate. However, if bulls manage to defend current levels, a push above supply zones could lead to a price recovery. The first step for a reversal would be breaking back above $222 and reclaiming it as support. If that happens, Solana could regain strength and challenge higher resistance levels in the coming weeks. Related Reading: Avalanche Forms A Falling Wedge On The Daily Chart Breakout Target Set At $56 The coming days will be decisive, as SOL stands at a turning point between a deeper correction or the beginning of a recovery phase. Price Struggles Below Key Level Solana is trading at $216 after losing the critical $220 demand level, a major support that bulls needed to hold. Now, bears are in control, and every moment SOL spends below this level increases the risk of further downside. If the price fails to recover quickly, the next significant demand zone to test will be around $200, a level that could determine whether SOL continues its correction or finds a strong bounce. However, bulls are not out of the game yet. If SOL manages to reclaim $220 as support, it could invalidate the bearish breakdown and set up for a potential trend reversal. A strong move above this level would indicate renewed buying pressure and could allow Solana to challenge higher resistance zones in the coming days. Related Reading: Chainlink Could Target $30 Once It Breaks Bullish Pattern Top Analyst For now, SOL remains in a fragile position, and traders should closely watch price action around $220 and $200. A continued downtrend below $200 would confirm a deeper correction, while a swift recovery above $220 could reignite bullish momentum. The next few sessions will be crucial in determining Solanas short-term direction. Featured image from Dall-E, chart from TradingView
Solana (SOL) is experiencing a strong uptrend, breaking crucial resistance levels and positioning itself for even higher price targets. Over the past week, Solana has surged nearly 14%, signaling robust bullish momentum in the cryptocurrency market. This rise comes as part of a broader altcoin rally, fueled by Bitcoins recent surge, which has lifted the […]
World Crypto Global opens the door to digital freedom for everyone.
Manage your free WCG Coins securely—where simplicity meets global accessibility.
FREE CRYPTO COINS
AVAILABLE FOR RESERVATION
ALREADY ALLOCATED

No fees. No catch. Your crypto journey starts here.