W o r l d . C r y p t o . G l o b a l

Loading

Welcome at World Crypto Global. This portal is packed with useful content and resources to built out your own crypto skills. WorldCrypto is a site member of Gabriel Vega Network.

Contact Info

CATEGORY: solana technical analysis


Jun 14, 2024 12:05

Solana Set For A Major 53% Price Move, Analyst Reveals Why

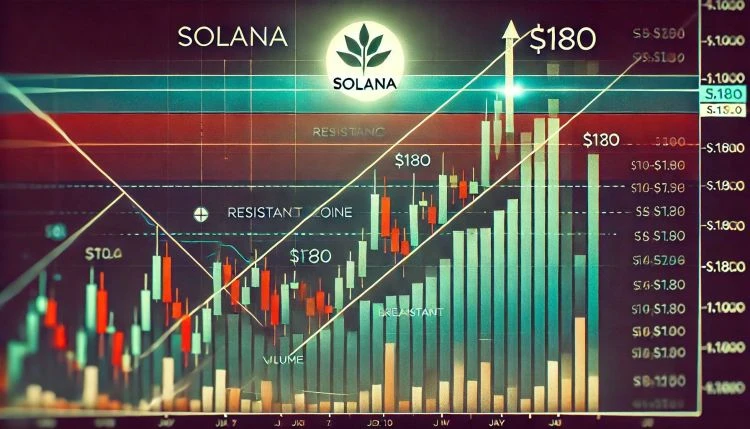
An analyst has explained how Solana could be setting up for a major 53% move based on a Symmetrical Triangle pattern forming in its price chart. Solana Has Been Travelling Inside A Symmetrical Triangle Recently In a new post on X, analyst Ali Martinez discussed a pattern that has recently taken shape in Solana’s daily price chart. The technical analysis (TA) pattern in question is a “Symmetrical Triangle,” which, as its name implies, looks like a triangle. The triangular shape comprises two converging trendlines, with the upper line joining successive lower highs and the lower one connecting higher lows. A key feature of this pattern is that these lines approach each other at roughly the same slope (hence the “symmetrical” in the title). Related Reading: Why Is Bitcoin Stagnant Despite ETF Inflows? Report Answers Like other TA patterns, when the asset price consolidates in the region bounded by these trendlines, resistance will probably be at the upper level and support at the lower one. A break out of either of these lines can suggest a continuation of the trend in that direction. Naturally, a break above the triangle could be a bullish signal, while a decline under the pattern could lead to a bearish outcome. Similar to the Symmetrical Triangle, there are other triangle patterns in TA. A couple of popular ones include the Ascending and Descending Triangles. These patterns differ from the Symmetrical Triangle in that one of their trendlines is parallel to the time axis. Now, here is the chart shared by the analyst that shows the Symmetrical Triangle that the 1-day price of Solana has been trading inside over the last few months: As the above graph shows, Solana has been closing in at the tip of this Symmetrical Triangle pattern recently. As consolidation becomes tighter, a break out of the pattern naturally becomes more probable. As mentioned earlier, which of the two lines the breakout happens from sets the direction the potential price move would go. “Keep an eye on the $143 support and $178 resistance levels to gauge the direction of the SOL trend,” notes Ali. Related Reading: Is Bitcoin Overheated Right Now? This Metric Suggests No From the chart, it’s apparent that Solana is currently floating near the bottom line, so a retest could be coming up soon. If bullish momentum has to return for the coin, this retest must be successful. Moves resulting from a breakout of a Symmetrical Triangle may be the same length as the triangle’s height. In the case of this Solana Symmetrical Triangle, the height represents a price swing of 53%, so Ali believes that a breakout would also set the coin up for a move of a similar scale. SOL Price Solana hasn’t had the best times during the last few weeks, as its price is now down to $149. It remains to be seen whether a potential upcoming retest of the Symmetrical Triangle support would change the coin’s fate. Featured image from Shutterstock.com, charts from TradingView.com

May 09, 2025 02:35

Solana Price Surges: Can This Bullish Setup Push SOL Beyond $300?

Solana is currently trading at $149.76, rising 2.14% over the previous 24 hours. The trading volume rose to $4.55 billion, representing a growth of 53.61%, with investor appetite making a comeback. The asset has appreciated by 0.70% over the last week, which is a steady upward trend. Technical analyst AndrewGriUK recently called out a textbook […]

May 18, 2025 02:30

SOL Price Prediction 2025: Can Solana Hit $372 Amid DeFi Growth?

Solana is currently trading at $168.94 at present, having dipped by a minor 1.84% in the last 24 hours. The downward drop in trading volume at the current level of $3.59 billion from 20.36% indicates the cooling-off period after the rally. Weekly performance also demonstrates a minor 0.81% fall and is placed in the vicinity […]

May 12, 2025 02:30

Solana Price Analysis: SOL Targets Breakout Above $175 Resistance

Solana (SOL) is experiencing positive momentum in the market, with its price on the rise. The market is now displaying a bullish sentiment, and this has also influenced other altcoins. Technical indicators like RSI and MACD suggest a strong upward trend, prompting both traders and investors to keep a close eye on SOL as they […]

Solana Rallies Into Pivotal Zone  $180 Level Could Define Next Move

Author: Sebastian Villafuerte
United Kingdom
May 12, 2025 12:05

Solana Rallies Into Pivotal Zone $180 Level Could Define Next Move

Solana is gaining momentum once again, with price action pushing above the $175 level for the first time in weeks. The move comes as crypto markets roar back to life, fueled by Bitcoins push above $100K and Ethereums explosive rally past $2,500. Solana has surged more than 20% in the past week alone, signaling strong demand and a renewed bullish outlook from traders and investors alike. Related Reading: XRP Whales Are Back 880 Million Tokens Accumulated This Month Top analyst Big Cheds shared a technical analysis revealing that Solana is now making a strong advance into a key spotthe underside of the daily 200 moving average (DMA). The asset is also approaching a lower high around the $180 mark, which previously acted as resistance during the last failed breakout attempt. Cheds notes that reclaiming this zone would be a significant win for bulls, potentially triggering a sharp continuation toward new highs. Market sentiment is turning optimistic across the board, and Solanas technical setup reflects that shift. As price approaches the 200DMA, all eyes are on whether SOL can hold this momentum and break through key levels to join the broader market rally. The coming days will be crucial for confirming a full trend reversal. Solana Approaches Pivotal Level As Bulls Eye Breakout Solana is showing renewed strength after a clean breakout above the $160 resistance zone, a level that had capped price action for several weeks. The surge has brought SOL into a critical region that could act as a pivot pointeither igniting a fresh bullish rally or marking a temporary top before a retrace. As global tensions between the US and China and broader macroeconomic uncertainties linger, the crypto market remains exposed to sudden sentiment shifts. However, recent price action in Solana, along with Bitcoin and Ethereum, suggests that investors are increasingly optimistic about a continued market recovery. Solanas current structure reflects that optimism. The asset is now testing the underside of its daily 200 moving average, a level often viewed by traders as a trend-defining indicator. A successful push above this moving average would add further confidence to the bullish thesis. At the same time, Solana is approaching a lower high near the $180 zone, where the price was previously rejected in March. Cheds points to this convergence as a crucial area: a breakout here could mark the beginning of a larger reversal pattern. Still, risks remain. A rejection at the $180 level could reinforce resistance and trigger a pullback toward the $160 support, especially if macro conditions worsen or profit-taking sets in. For now, however, bulls appear to be in control, and the technical landscape supports a potential continuationif momentum holds. Related Reading: Bitcoin 4H Chart Shows Bullish Consolidation Classic Continuation? Technical Levels: Price Action Shows Strength Solana (SOL) is exhibiting strong momentum as it trades at $176.41, advancing toward a crucial resistance area around the $180 level. The daily chart shows that SOL has surged rapidly from April lows, breaking above both the 200-day EMA ($161.67) and approaching the 200-day SMA ($181.10), a key area that could determine the next major trend. This zone acted as support and resistance multiple times in the past, particularly during Q4 2024 and early 2025. Now, as price returns to this range, it becomes a potential pivot point. If bulls can sustain pressure and close above $181.10 with volume confirmation, it may trigger a continuation toward $200 and possibly retest February highs above $260. However, failure to break above this range could prompt a rejection and consolidation below the 200 SMA. Related Reading: Bitcoin Whale Entry Prices Diverge Sharply Confidence Builds At Higher Levels Volume has picked up significantly over the last few days, indicating rising interest and participation from traders. This is a constructive sign as Solana attempts to reclaim higher ground. For now, the trend remains bullish, but eyes are on the $180$185 resistance zone to confirm whether SOL has the strength to continue its breakout or faces a short-term pullback. Featured image from Dall-E, chart from TradingView

Apr 10, 2025 02:30

Solana (SOL) Price Drops Below Key Support Will $74 or $50 Hold Next

Solanas performance on the market remains cautious as the coin is currently priced at $106.34, down 1.55%, over the last 24 hours. In the last 7 days, the coin has lost 15.20%, noting increasing bearish pressure in the midst of the overall volatility in the space.  Trading volume has also receded significantly, with a 16.72% […]

Solanas Bollinger Bands Are Squeezing: Big Move Incoming?

Author: Paul Adedoyin
Estonia
May 01, 2025 02:30

Solanas Bollinger Bands Are Squeezing: Big Move Incoming?

The gap Solanas Bollinger Bands are reducing, which is a sign that its price is about to change.

Apr 26, 2025 02:30

Solana breaks $154 with strong uptrend; $500M deal signals long-term confidence

Solana shows strong short-term growth with a cautious technical outlook. A $500M investment by Sol Strategies sets a bullish precedent for SOL. Analysts warn of potential retracement amid near-overbought indicators. Solana (SOL) is trading at $154.25, registering a 4.18% increase over the last 24 hours. Yet, in spite of the upswing, the […]

Solana Short-Term Indicator Signals Potential Risk  Reversal Or Pause?

Author: Sebastian Villafuerte
United Kingdom
Apr 22, 2025 12:10

Solana Short-Term Indicator Signals Potential Risk Reversal Or Pause?

Solana is showing signs of strength as it pushes above a key resistance level, suggesting that bulls are beginning to regain some control after weeks of weakness. The broader crypto market remains volatile, driven by ongoing macroeconomic uncertainty and heightened trade tensions between the US and China. Despite these risks, investor sentiment appears to be improving slightly, fueling hopes that Solana and other altcoins could enter a recovery rally. Related Reading: Ethereum Enters Historic Buy Zone As Price Dips Below Key Level Insights However, caution remains warranted. Top analyst Ali Martinez shared a technical signal that tempers the recent optimismaccording to his analysis, Solana may be due for a short-term pullback. A sell signal has flashed on the 12-hour chart using the TD Sequential indicator, which has historically marked local tops and price exhaustion phases. While Solanas recent breakout is encouraging, the presence of this bearish signal suggests the rally may be losing steam in the near term. Investors will be watching closely to see whether SOL can hold support above the reclaimed levels or if it retreats under selling pressure. For now, the market is caught between early signs of recovery and the ever-present risk of another leg down. Solana Faces Key Resistance As Short-Term Pullback Signal Emerges Solana has surged over 48% since April 7, signaling renewed momentum after a prolonged period of intense selling pressure. Bulls are now facing a critical test as price approaches the $150 levela key resistance zone that has held back further advances in the past. Despite the recent recovery, Solana remains one of the most affected assets during the 2025 downtrend, having lost more than 65% of its value since its January peak. This underscores the significance of the current move and the importance of holding higher levels to confirm a true reversal. Still, caution is warranted. Martinez shared data on X highlighting a TD Sequential sell signal on the 12-hour charta technical indicator that often precedes short-term trend exhaustion or reversals. The TD Sequential works by identifying a sequence of price movements that can indicate overbought or oversold conditions. If the signal plays out, Solana could face a temporary pullback before any sustained upside continues. Macroeconomic factors remain in play, with ongoing trade tensions between the US and China still shaping sentiment across global markets. However, hopes for a potential agreement between the two countries and expanding global liquidity are giving bulls some optimism, especially within the altcoin sector. Related Reading: Metrics Reveal Solana Sees Uptick In Whale Activity Accumulation Signal? SOL Price Hovers At Pivotal Zone: Whats Next? Solana (SOL) is currently trading at critical levels, testing the key $150 resistance zone after a sharp recovery from recent lows. Bulls must reclaim and hold above this level to confirm a breakout and validate the start of a sustained uptrend. A decisive move above $150 would likely trigger further buying momentum, possibly leading to a retest of higher targets not seen since early March. However, if SOL fails to break above this barrier in the short term, a period of consolidation between the $130 and $120 levels could still signal strength. Holding this zone would suggest that bulls are building a base for continued upward price action and absorbing selling pressure without a significant retrace. Such consolidation phases are often considered healthy in bullish market structures, allowing momentum to rebuild before the next leg higher. Related Reading: Cardano Whales Offload 180 Million ADA In 5 Days Smart Profit-Taking? On the downside, failure to hold the $120 support level could expose SOL to deeper losses, with the $100 zone as the next significant area of demand. A break below this level would invalidate the current bullish outlook and possibly reignite a broader downtrend. For now, all eyes are on SOLs reaction around the $150 mark. Featured image from Dall-E, chart from TradingView

Solana Turns Bullish On 8H Chart  Break Above $147 Could Confirm New Trend

Author: Sebastian Villafuerte
United Kingdom
Apr 18, 2025 12:05

Solana Turns Bullish On 8H Chart Break Above $147 Could Confirm New Trend

Solana is now at a critical juncture as it trades around a pivotal price level that could determine its short-term direction. After weeks of selling pressure and underwhelming price action, bulls are attempting to regain controlbut success hinges on reclaiming higher resistance zones. Without a decisive move upward, Solanas price action may continue to follow the broader downtrend that has defined the last few months. Related Reading: Over 1.9M Ethereum Positioned Between $1,457 And $1,598 Can Bulls Hold Support? Meanwhile, macroeconomic tensions continue to escalate. Trade conflicts between the United States and China are intensifying, with both nations imposing aggressive tariffs. This has created a high-risk environment across global financial markets, and altcoins like Solana are particularly vulnerable. With uncertainty rising and investor sentiment turning cautious, digital assets are under growing pressure. However, there is a glimmer of technical optimism. Top crypto analyst Crypto Seth shared an analysis suggesting that Solana has flipped bullish on the 8-hour chart. According to his view, if SOL can break above key resistance, it could confirm a trend shift and trigger a potential recovery rally. Until then, traders are watching closely as Solana navigates a critical support-resistance battleground amid a volatile macro backdrop. Bulls Must Hold the Line as Market Faces Trade War Pressure Solana is currently trading in a make-or-break zone, having lost 55% of its value since reaching its all-time high in January. This decline mirrors a broader crypto and equities market correction that began when macroeconomic tensions escalatedmost notably due to rising inflation, global instability, and intensifying trade war rhetoric between the United States and China. Bulls now face a critical moment. Solana must hold current levels and reclaim key resistance zones to spark a recovery rally. Failing to do so could open the door to a sharp meltdown in price, particularly if macro conditions continue to deteriorate. US President Donald Trumps unpredictable policy decisions, especially surrounding tariff impositions, have created a hostile environment for risk assets like Solana. Ongoing tariff escalations with China are only adding to market uncertainty, further weighing on investor sentiment. However, there is a glimmer of hope from the technical side. Seth shared insights suggesting that Solana has flipped bullish on the 8-hour chart. According to his analysis, a break above the $147 level would confirm a trend shift and potentially pave the way for a sustained recovery. For now, all eyes remain on whether SOL can clear this level or face renewed pressure in a volatile global climate. Related Reading: Dogecoin Whales Buy 800 Million DOGE in 48 Hours Smart Money Or Bull Trap? Solana Faces Pivotal Resistance: Can Bulls Break Through? Solana (SOL) is currently trading at $132 after several days of struggling to reclaim this key resistance zone. Price action remains uncertain, and bulls must now show strength to avoid a deeper correction. Reclaiming the $132$135 range is crucial, as it could confirm short-term momentum and signal the start of a recovery rally. To establish a higher high and shift the current downtrend structure, SOL must push decisively above the $150 level. This area has served as a strong rejection point in previous attempts and stands as the next major test for bullish continuation. A clean breakout above this level could open the path toward higher targets and renewed investor confidence. However, if bulls fail to defend the $125 support level, Solana may risk a drop back to lower demand zones around $100or potentially even lower, depending on broader market conditions. Macroeconomic uncertainty, continued trade tensions between the U.S. and China, and overall weakness in altcoins are all contributing factors weighing heavily on SOLs price. Related Reading: Solana Retests Bearish Breakout Zone $65 Target Still In Play? For now, traders are watching the $135 level closely. A breakout above this key threshold could shift the tide in Solanas favor. Until then, caution remains warranted. Featured image from Dall-E, chart from TradingView

Apr 13, 2025 02:30

Solana (SOL) Bulls Charge Ahead: Structural Breakout Sparks $200 Target

Solana (SOL) is reflecting renewed bull strength along with the overall market. After several weeks of volatility, SOL is now primed for the next leg up and has started its upward journey. Over the last 24 hours, SOL is up by almost 10% with a trading price of $130.80.  Solana Defies Downtrend, Targets $200 Next […]

Apr 12, 2025 02:30

Solana Price Prediction: Stability Above $113 Signals Bullish Potential

Solana (SOL), one of the leading Layer 1 blockchain assets, is currently priced at $118.96, marking a modest 1.62% gain in the past 24 hours. This uptick comes amid a sharp 39.64% decline in daily trading volume, now standing at $3.94 billion. The token keeps consolidating its well-established price zone of $113 to $121 with […]

Solana Approaches Make-or-Break Level As Technicals And Fundamentals Align  Analyst

Author: Sebastian Villafuerte
United Kingdom
Apr 12, 2025 12:05

Solana Approaches Make-or-Break Level As Technicals And Fundamentals Align Analyst

Solana is now facing critical liquidity resistance as the broader crypto market attempts to stabilize following weeks of extreme volatility and uncertainty. After a brutal downtrend that saw SOL lose more than 47% of its value since early March, buyers are finally stepping in. This shift in momentum has sparked cautious optimism, but challenges remain ahead. Related Reading: Ethereum Long-Term Holders Show Signs Of Capitulation Prime Accumulation Zone? SOL had been under immense selling pressure for nearly two months, dropping from its peak to levels not seen since late 2023. After briefly falling below $100, Solana has bounced back and is now testing a key trendline resistance a level that could determine whether the recent rebound gains traction or fizzles out. Top analyst Ted Pillows shared a technical view on X highlighting that Solana is now 60% down from its peak, suggesting that capitulation has likely taken place. According to Pillows, the current setup looks like a retest of trendline resistance, which has historically acted as a major barrier for price recoveries. As Solana nears this critical level, traders are closely watching for signs of a breakout or rejection. The next few days could determine whether SOL reclaims lost ground or resumes its downward trend. Solana Eyes Breakout As Bulls Return After Brutal Correction Solana has finally shown signs of life after weeks of relentless selling pressure. Following a sharp correction that drove SOL to a low of $95, the asset bounced over 25% since Monday, signaling renewed buying interest. The recovery came in tandem with a broader market rebound triggered by U.S. President Donald Trumps announcement of a 90-day pause on reciprocal tariffs for all countries except China, whose tariffs were raised from 125% to 145%. Pillows shared a chart suggesting that Solana is once again testing a key trendline resistance, and capitulation may have already occurred. According to Pillows, this could be the turning point for Solana provided bulls can secure a decisive daily close above $130. Looking forward, multiple bullish catalysts are lining up for Solana. The highly anticipated Firedancer upgrade is expected to significantly boost scalability and performance. In addition, talks around the potential approval of Solana ETFs, as well as its inclusion in the Digital Asset Stockpile, add to investor optimism. On-chain activity is also rising, with stablecoin supply on Solana up 140% and DEX volume seeing a notable resurgence. If SOL can push past this trendline resistance and close above $130, a sustained rally could follow one that finally shifts market sentiment back in favor of bulls. Related Reading: Solana Eyes $200 Target As It Gains Momentum Recovery Could Mirror 3-Month Downtrend SOL Price Holds Key Support as Bulls Eye Recovery Solana (SOL) is currently trading at $117 as bulls attempt to reclaim momentum after weeks of selling pressure. The short-term goal remains clear: reclaim the $125 resistance zone, which has acted as a major barrier since the recent downtrend began. A decisive push above this level could open the door for a run toward $145, where the next liquidity zone sits and a full recovery rally may begin. However, maintaining support above $112 is absolutely critical. This level has become a key pivot area in the 4-hour chart, and bulls must defend it to avoid triggering a bearish reversal. If this support fails, the probability of SOL dropping back below the $100 mark increases significantly, potentially reigniting panic selling. Related Reading: XRP Network Activity Hits All-Time High Despite Market Volatility Bullish Signal? Despite market-wide volatility, SOL has shown resilience, bouncing more than 25% from its recent lows around $95. This upward momentum, however, needs to be sustained with consistent volume and strength above resistance levels. Investors are closely watching for a breakout above $125 as a potential confirmation that the recent bounce is more than just a relief rally. Until then, Solana remains in a tight range, with $112 and $125 defining the immediate battle zone. Featured image from Dall-E, chart from TradingView

Solana Consolidates In A Wide Range  Big Move On The Horizon?

Author: Sebastian Villafuerte
United Kingdom
Mar 09, 2025 12:05

Solana Consolidates In A Wide Range Big Move On The Horizon?

Solana has faced intense selling pressure and price swings, with the asset losing over 57% of its value since January 13. Bulls have struggled to regain momentum, and market sentiment suggests that the crypto market is not in a healthy condition for a strong recovery. As uncertainty continues, investors remain cautious, watching for signals of a potential trend shift. Related Reading: Ethereum Holds Key Support Amid Volatility Can Bulls Break $2.3K To Regain Momentum? However, despite the bearish outlook, some analysts believe that this correction could be nearing its end. Many are now looking for key technical confirmations that could indicate a reversal or breakout in the near future. A top crypto analyst, Ali Martinez, shared a technical analysis on X, revealing that Solana remains in consolidation within a wide range pattern. This type of formation often suggests increasing volatility before a potential breakout to higher prices. If SOL follows the historical behavior of this pattern, it could be positioning for a significant move upward once market conditions stabilize. With Solana hovering near crucial price levels, the coming days will be key in determining whether bulls can reclaim control or if further downside awaits. Traders are now watching for a decisive breakout or another leg down before making their next move. Solana Struggles Around Crucial Demand Solana is struggling to hold the $140 support level after failing to reclaim higher price levels, keeping sentiment bearish as price action continues in a downtrend. Analysts remain cautious, warning that SOL could see further declines unless bulls regain control and establish stronger momentum. The past few weeks have been marked by unpredictable events, adding to the markets uncertainty. The ongoing trade war developments between the United States, Mexico, Canada, and China have put additional pressure on financial markets, including crypto assets like Solana. Meanwhile, President Trumps executive order to establish a Strategic Bitcoin Reserve had an underwhelming effect on the market, failing to generate the bullish reaction many investors had hoped for. Despite these challenges, some technical indicators suggest that Solana may be gearing up for a significant move. Martinez’s analysis highlights that SOL remains in consolidation within a right-angled ascending broadening pattern. Historically, this formation has led to high volatility and a breakout in either direction, hinting that a major price move could be coming soon. If Solana breaks below $140, it could trigger a deeper correction, further reinforcing the bearish trend. However, if bulls manage to push SOL above key resistance levels, it could reverse the downtrend and set the stage for a strong recovery rally. Related Reading: Litecoin Holds Bullish Outlook As the MVRV Ratio Signals Strength Analyst For now, traders are closely monitoring SOLs price action, waiting for a decisive move that could determine its next major trend. The coming days will be crucial in assessing whether Solana can stabilize and rebound or face further downside pressure. Solana Battles To Hold Ground At Lower Levels Solana is currently trading at $139 after failing to reclaim the 200-day Moving Average (MA) and Exponential Moving Average (EMA), which sit around the $184-$186 resistance zone. The inability to break above these critical levels has left bulls in trouble, as SOL struggles to hold the $140 support and now risks setting fresh lows below $125. The bearish momentum has kept SOL under pressure, with price action confirming a continued downtrend. If sellers gain more control and $140 fails to hold, a breakdown below $125 could trigger further downside, forcing SOL into lower demand zones. However, despite the current weakness, theres still a chance for recovery. If bulls can push SOL back above $180, reclaiming this critical level could shift market sentiment and trigger a strong recovery move. A decisive breakout above this zone would invalidate the bearish outlook, signaling a potential push toward higher resistance levels. Related Reading: Bitcoin Could Gain Momentum For A Move To $150,000 If Bulls Reclaim This Level Details For now, traders are watching closely to see whether Solana can hold its key support or if another leg down is inevitable. The next few days will be crucial in determining whether SOL can stabilize or face deeper losses in the short term. Featured image from Dall-E, chart from TradingView

Solana Tags Upper Bollinger Band For First Time Since ATH  Is Momentum Returning?

Author: Sebastian Villafuerte
United Kingdom
Mar 27, 2025 12:05

Solana Tags Upper Bollinger Band For First Time Since ATH Is Momentum Returning?

Solana (SOL) is showing early signs of recovery after enduring several days of selling pressure and heightened volatility. The altcoin is now trading above the $135 mark, a psychological level that bulls have managed to defend in recent sessions. While this move offers some relief to investors, Solana still has work to do before confirming a sustained uptrend. The broader market remains cautious, and SOL must reclaim key technical levels to strengthen the case for a full recovery rally. Related Reading: Ethereum Accumulation Is Almost Over Breakout Above $2,200 Could Trigger Expansion Phase Adding to the optimism, top analyst Big Cheds highlighted a notable technical signal: Solana has tagged the upper Bollinger Band (BB) on the daily chart for the first time since it traded in the $270 range. This rare occurrence suggests that momentum is slowly shifting in favor of the bulls, though confirmation is still pending. The upper BB tag is often seen as an early indicator of building strength, especially when supported by increasing volume and follow-through in price action. For now, investors are watching closely to see if Solana can hold above $135 and push toward resistance levels that could confirm a trend reversal. Until then, the recovery remains tentative but the signal from Big Cheds adds an encouraging twist. Solana Struggles Below $150 Solana (SOL) is now at a critical junction as it pushes to set new local highs just below the $150 level. While this upward move has brought temporary relief, analysts warn that the latest price surge could be nothing more than a bull trap. Related Reading: Dogecoin Breaks Above Bullish Daily Pattern Analyst Sees A Surge To $0.43 Many are calling for a continuation of the broader downtrend, citing weak market sentiment and the possibility of deeper corrections across altcoins. The fear of an incoming bear market is growing among investors, with some choosing to exit positions, while others hold through unrealized losses in hopes of a future recovery. Ched’s analysis highlights that Solana has tagged the upper Bollinger Band on the daily chart a signal not seen since the $270 range. This technical indicator could suggest that bullish momentum is building, possibly marking the start of a recovery rally. While confirmation is still needed, the tag hints at a shift in sentiment as bulls try to regain control. Currently, Solana remains 51% down from its January all-time high, highlighting the steep correction it has suffered in just a few months. Speculation, increased volatility, and heavy sell pressure have defined recent price action, leaving traders unsure about the next direction. However, a key technical development could shift the narrative. Price Action Details: Key Resistance Looms Solana (SOL) is currently trading at $144, with bulls facing strong resistance at the critical $150 level. Despite recent attempts to push higher, momentum remains weak, and buyers have yet to establish a clear breakout. The $150 mark is proving to be a psychological barrier, and failure to break through could signal more downside in the short term. However, the more decisive level to reclaim lies between $170 and $180 a zone that has consistently acted as strong resistance during past rallies. For a true recovery to take shape, SOL must gain traction above this range and turn it into support. Until that happens, the risk of further downside remains elevated. Related Reading: Ondo Finance Eyes Breakout As Price Tests $0.89 Channel Resistance Analyst If SOL continues to face rejection at $150 in the coming days, a drop below $135 becomes increasingly likely. This would reinforce bearish sentiment and potentially open the door to lower support levels, especially if broader market weakness persists. With price action stuck between key levels and uncertainty still dominating the market, Solanas next move could set the tone for the weeks ahead. Bulls must act quickly to reclaim critical ground before selling pressure returns in force. Featured image from Dall-E, chart from TradingView

Solana Holds Bullish Pattern  Expert Sets $140 Target

Author: Sebastian Villafuerte
United Kingdom
Mar 18, 2025 12:10

Solana Holds Bullish Pattern Expert Sets $140 Target

Solana (SOL) has been under intense selling pressure, with the price failing to reclaim key resistance levels after weeks of fear-driven market conditions. Bulls lost control when SOL dropped below $180, a crucial support level that previously held firm. Since then, bearish sentiment has dominated, with speculation rising about a potential bear market for SOL and the broader altcoin sector. Related Reading: 640,000 Chainlink (LINK) Withdrawn From Exchanges In 24 Hours Bullish Accumulation? Despite this negative outlook, there may be a glimmer of hope for Solana bulls. Top analyst Ali Martinez shared a technical analysis on X, revealing that SOL is forming a bullish channel in the short-term time frame. This pattern suggests that if Solana holds within this formation, a surge to higher price levels could follow. For this bullish scenario to play out, SOL must hold the lower trendline of the channel and push toward higher resistances. A breakout from this pattern could signal a strong recovery, potentially reversing the downtrend that has dominated the market for weeks. However, if Solana fails to maintain this structure, the risk of further downside remains high. The next few days will be crucial in determining SOLs short-term direction. Solana Faces Risks Amid Volatility Solana has faced relentless selling pressure since hitting its all-time high of $261 in January, now down 61% from that peak. As hopes for a massive bull run fade, speculation around a potential bear market continues to grow. The broader macroeconomic environment remains unfavorable, with trade war fears and economic uncertainty pushing down not just the crypto market but also the U.S. stock market. Investors are now looking for signs of a reversal, and technical indicators suggest a potential short-term recovery. Martinez’s analysis on X reveals that Solana is forming a bullish channel and is eyeing a climb from the channels base to the upper resistance at $140. If this pattern holds, SOL could push toward $140 and even higher levels, signaling a relief rally. For this bullish outlook to materialize, Solana must maintain its current trendline support and break through key resistance levels. If SOL fails to hold this channel, it could face further downside, reinforcing fears of a prolonged bear market. The next few days will be crucial in determining whether Solana can reclaim momentum or continue its downward trajectory. Related Reading: Whales Accumulate Over 150 Million XRP In Just 48 Hours Is A Rally Incoming? Solana Struggles As Bulls Fight to Regain Momentum Solana (SOL) is currently trading at $129, following days of consolidation between $136 and $111. The price action remains uncertain, with bulls struggling to regain control after weeks of selling pressure. For a potential reversal, SOL must break above the $140 resistance level and push toward $160, a key level that would signal a shift in market structure. If bulls successfully reclaim these price points, a stronger recovery phase could begin, potentially attracting new buyers back into the market. However, if Solana fails to hold the $125 support, it could trigger a wave of selling pressure, sending the price toward lower demand zones. A break below this level could expose SOL to a drop toward $110 or even lower, reinforcing concerns that the current downtrend is far from over. Related Reading: Ethereum Must Reclaim $2,050 To Start A Recovery Rally Insights The next few trading sessions will be crucial in determining whether Solana can reclaim momentum or if further declines are ahead. Featured image from Dall-E, chart from TradingView

Solana Could Target $220 If It Holds Current Levels  Analyst Expects Short-Term Bullish Momentum

Author: Sebastian Villafuerte
United Kingdom
Feb 06, 2025 12:05

Solana Could Target $220 If It Holds Current Levels Analyst Expects Short-Term Bullish Momentum

Solana is trading above the crucial $200 level after enduring days of extreme volatility and heavy selling pressure. Despite the uncertainty, Solana remains one of the strongest assets in the crypto market, sustaining its bullish momentum that has been in place since 2023. Investors and analysts are closely watching this key level, as maintaining support above $200 is essential to confirm further upside potential. Related Reading: Bitcoin Looks Stronger Compared To Altcoins Demand Remains Strong As Price Consolidates In A Range Top analyst Jelle shared a technical analysis on X, highlighting Solanas current position. He noted that SOL is holding the key support level so far and emphasized the importance of a bounce from this region to sustain short-term bullish momentum. According to Jelle, reclaiming $220 is the first mission for bulls, as it would set the stage for another rally toward recent highs. However, failure to hold above $200 could spell trouble, potentially leading to further downside and a more extended consolidation period. With the market experiencing high volatility, this week will be crucial in determining Solanas short-term trajectory. If bulls defend key support levels and reclaim resistance zones, SOL could be on track for another push higher, continuing its impressive run from last year. Solana at a Critical Juncture: Can Bulls Take Control? Solana has retraced 40% from its all-time high, sparking concerns among investors who fear a prolonged correction. While SOL has been one of the strongest assets in this cycle, recent price action has left market participants uncertain about its short-term direction. Related Reading: Ethereum Long-Term Bullish Structure At Risk $2,700 Support Is Key for a $7K Target Despite institutional interest and a pro-crypto U.S. administration, the market remains plagued by doubt, with altseason narratives struggling to gain traction. The level of uncertainty surrounding crypto markets is unprecedented compared to past bull runs, leading to increased hesitation among retail investors. However, some analysts remain bullish on Solanas long-term prospects. Top analyst Jelle shared a technical analysis on X, revealing that Solana is holding the key support level around $200 so far. He emphasized that for SOL to remain short-term bullish, a bounce from this region is necessary. If bulls step in and defend this level, Jelle expects a surge above $220 in the near future, which could pave the way for a broader recovery. If Solana holds above $200 and reclaims key resistance levels, it would signal renewed strength and confirm a potential rally back toward all-time highs. However, if SOL breaks below support, further downside could follow, reinforcing bearish sentiment across the market. The coming days will be crucial in determining the next phase of Solanas price action. SOL Price Holds Key Support At $200 Solana (SOL) is currently trading at $205, maintaining a crucial support level at $200. This price point is critical for short-term momentum, as holding above it strengthens the bullish case for another leg higher. If bulls can sustain this level and push above $220, a strong breakout could follow, potentially taking SOL back into all-time high (ATH) territory. However, if $200 fails to hold, SOL could face a deeper correction, with the next major demand zone around $180. A drop to this level could signal a longer consolidation phase, delaying the anticipated bullish continuation. For now, Solana remains in a decisive phase, where market structure and buying pressure will determine the next major move. If SOL reclaims $220, a rally back toward $250-$260 becomes increasingly likely. On the other hand, losing $200 would shift sentiment bearish, putting downward pressure on price action. Related Reading: Bitcoin Price Must Hold Above $97K To Sustain Momentum Metrics With strong fundamentals and bullish long-term momentum, investors are closely watching Solanas price action. The next few trading sessions will be crucial in determining whether SOL can resume its uptrend or face further downside pressure. Featured image from Dall-E, chart from TradingView

Solana Retraces TRUMP Meme Pump Gains  But Technicals Suggest A $300 Run

Author: Sebastian Villafuerte
United Kingdom
Feb 04, 2025 12:05

Solana Retraces TRUMP Meme Pump Gains But Technicals Suggest A $300 Run

Solana (SOL) faced a brutal selloff yesterday, mirroring the broader market collapse triggered by escalating U.S. trade war fears. The price plummeted over 19% in less than 24 hours, wiping out weeks of gains and sending shockwaves through the crypto market. Investors are now bracing for more volatility, as the bearish momentum could extend into the week ahead. Related Reading: Bitcoin Price Must Hold Above $97K To Sustain Momentum Metrics Top analyst Jelle shared a price chart on X, highlighting that Solana has completely retraced the TRUMP meme coin pump. The rapid decline saw SOL drop as low as $175, marking one of its steepest single-day corrections in recent months. This level is now a critical zone for bulls, as further weakness could expose Solana to deeper losses. With market sentiment shifting drastically from bullish to fearful in just hours, traders wonder if Solana can recover or if another leg down is imminent. The coming days will be crucial as SOL attempts to stabilize and reclaim key support levels to prevent further downside. Solana FacesSelling Pressure But Remains Strong After yesterdays brutal market selloff, Solana (SOL) has become a focal point for investors seeking strong plays amid the chaos. The entire crypto market plummeted as U.S. trade war fears triggered widespread panic selling.  Solana was no exception, dropping over 19% in less than 24 hours. However, despite the negative environment and extreme volatility, long-term price action remains intact, suggesting that Solana could recover faster than most assets once the market stabilizes. Top analyst Jelle shared a technical analysis on X, revealing that Solana has completely retraced the TRUMP meme coin pump, falling as low as $175 before finding support. Jelle remains optimistic about Solanas future, stating that its structure is still sound. He highlights that a close above M&W support would confirm another push higher, setting the stage for a strong recovery. According to his analysis, its only a matter of time before SOL revisits the $300 level, as long as it holds key structural levels. Related Reading: Bitcoin Trades At Discount For The Past Month Signaling Selling Pressure What This Means With the entire market facing heightened volatility due to macroeconomic uncertainty, this week will be crucial for Solanas next move. If SOL can reclaim major support levels and break through immediate resistance, a strong recovery could be on the horizon. However, if selling pressure persists, the market could see further downside before a new accumulation phase begins. SOL Holding Above Key Levels Solana is trading at $199 after a small recovery from the $175 low, surging over 13% in the past few hours. Despite the recent bounce, market sentiment remains fearful, and selling pressure could persist throughout the week. Bulls must reclaim key levels quickly to regain momentum and prevent further downside. If SOL wants to confirm a bullish reversal, it must push above the $220 mark in the coming days. This level acted as strong support before the recent breakdown, and flipping it back into support would signal strength. However, given the current market uncertainty, a recovery may take time, and SOL could see more choppy price action before making its next move. The key level to watch on the downside is $189, where the 200-day exponential moving average (EMA) currently sits. If SOL loses this level, a deeper correction could follow, potentially leading to a retest of lower support zones. Bulls need to hold this mark to prevent a more extended decline. Related Reading: Chainlink Could Target $30 Once It Breaks Bullish Pattern Top Analyst For now, all eyes are on SOLs ability to reclaim critical resistance levels. If the price stabilizes and demand picks up, Solana could be primed for a strong rebound. However, further weakness could extend the correction phase. Featured image from Dall-E, chart from TradingView

Is Solana In A Macro Trend Move? Charts Show Potential Shift

Author: Sebastian Villafuerte
United Kingdom
Mar 01, 2025 12:05

Is Solana In A Macro Trend Move? Charts Show Potential Shift

Solana (SOL) is trading at its lowest price level since September 2024, as the entire crypto market struggles with fear and intense selling pressure. Solana has lost over 55% of its value in less than six weeks, erasing the gains from its post-election rally and raising concerns among investors about a potential prolonged downtrend. Related Reading: Dogecoin Open Interest Declines 67% In Three Months Can Meme Coins Recover? Panic has taken over the market, and traders are growing fearful that Solanas correction may continue into lower price levels. Despite multiple attempts to reclaim momentum, bulls have been unable to defend key demand zones, allowing bears to maintain control. Top analyst Ali Martinez shared a technical analysis on X, stating that Solana appears to be experiencing a macro trend shift from bullish to bearish. If SOL fails to recover key levels soon, it could signal a deeper downtrend and further selling pressure in the coming weeks. For now, investors are closely watching Solanas next move. If SOL can reclaim key resistance levels, it could stabilize and possibly trigger a recovery. However, failure to hold above current prices could lead to an extended bearish phase, increasing the risk of further declines. Solana Facing Serious Selling Pressure Solana is trading below crucial daily support levels, invalidating the bullish structure thesis that many traders were holding onto. The price action has been weak, with Solana now caught in a high time frame range between $120 and $220. If bulls fail to defend the lower end of this range, Solana could face the risk of a prolonged bear market. Related Reading: Litecoin Holds Solid Structure Amid Market Breakdown Analyst Forecasts A Big Move The current price breakdown suggests that bears remain in control as selling pressure continues to mount. Solana has struggled to reclaim momentum, and the once-strong uptrend that started in July 2023 is at risk of collapsing. Analysts are now monitoring whether SOL can hold above the $120 support level, as a failure to do so could trigger a deeper correction. Martinez’s technical analysis states that Solana appears to be experiencing a macro trend shift. Martinez explains that the bullish trend that started in mid-2023 is on the verge of breaking, and if SOL continues to lose key demand levels, it could confirm a long-term bearish phase. Investors are now waiting for a confirmation move. If Solana can reclaim key resistance levels, bullish momentum could be reestablished. However, if the price fails to hold support and breaks below $120, it may indicate the start of a bear market for Solana. Price Testing Long-Term Demand Solana is trading at $130 after experiencing a 33% drop in less than two weeks. The market is in panic mode, with selling pressure overwhelming bullish attempts to reclaim key levels. Bulls have lost control of the price action, and Solana is struggling to find strong support. At this stage, the most crucial level to hold is $120. If SOL falls below this mark, it could trigger a deeper correction and push the price into uncharted bearish territory. However, if buyers step in and defend this level, Solana could stabilize and prepare for a potential recovery rally. For a trend reversal, SOL must reclaim the $160 level as soon as possible. This would help restore bullish momentum and shift market sentiment back toward optimism. However, this process could take time, especially given the current uncertainty and broader market weakness. Related Reading: Long-Term Dogecoin Holders Are In Denial On-Chain Metrics Expose Weakness A consolidation phase around the $120$140 range is possible before any meaningful recovery takes place. If Solana holds above support and demand starts increasing, a strong bounce could follow. However, failure to hold these levels could confirm a bearish trend, extending the correction even further. Featured image from Dall-E, chart from TradingView

Feb 23, 2025 02:40

Solanas Short-Term Outlook: TD Sequential Shows Promise Despite Bearish Signals

Solana ($SOL) has been in the spotlight recently, with significant technical and fundamental developments shaping its market outlook. Crypto expert Ali Martinez recently pointed out that the TD Sequential indicator perfectly predicted SOLs intraday top just before the Bybit hack, showing its potential to forecast key price levels accurately. Now, the same indicator is flashing […]

Your Crypto Gateway

Claim 1,000
Free WCG Coins

World Crypto Global opens the door to digital freedom for everyone.
Manage your free WCG Coins securely—where simplicity meets global accessibility.

11 bn

FREE CRYPTO COINS

8.9 bn

AVAILABLE FOR RESERVATION

2.1 bn+

ALREADY ALLOCATED