Cardano Price Prediction for Today, September 9 ADA Technical Analysis
The Cardano price prediction reveals that ADA is moving bullishly with a gain of 3.37%, as the coin prepares for a bullish cross above the [...]
Loading
Welcome at World Crypto Global. This portal is packed with useful content and resources to built out your own crypto skills. WorldCrypto is a site member of Gabriel Vega Network.

The Cardano price prediction reveals that ADA is moving bullishly with a gain of 3.37%, as the coin prepares for a bullish cross above the [...]
Bitcoin has faced significant price fluctuations marked by a notable crash on August 5 that saw its value dip to $49,000. This was followed by a rebound to approximately $65,000, only to experience another decline to around $52,000 last Friday. Despite these challenges, the largest cryptocurrency by market capitalization is undergoing crucial support retests, reminiscent [...]
The post Bitcoin Support Retests Reflect September 2023 Patterns: Is Another Bull Run Coming? appeared first on Crypto Breaking News.
According to the daily chart, the Gala price prediction shows that GALA is heading toward the resistance level of $0.020 as the price remains within [...]
An inverse-head-and-shoulder pattern is developing on the XRP weekly chart, awaiting a breakout toward $1.
A look at the history of the evolution of Bitcoin wallets.
Ethereum is trading near its yearly low of $2,400 after an 18% drop from local highs. ETH has notably underperformed compared to Bitcoin and other altcoins like Solana this cycle, leading to investor concerns. One of the key reasons for this underperformance is the lack of enthusiasm surrounding Ethereum ETFs. Metrics from these funds show [...]
The post Ethereum (ETH) Triangle Formation Hints At A Double Bottom: Breakout and New ATH? appeared first on Crypto Breaking News.
Technological capability, on its own, is not enough to create Bitcoin privacy. Unless users and society actively defend and demand privacy, it will die. From "The Privacy Issue".
A research report analyzing the different trust models and functioning mechanisms of proposed and existing two-way pegs for Bitcoin layers.
The Sui price prediction shows that SUI could be ready for the uptrend, and it may fundamentally break above $7.0 respectively. Sui Prediction Statistics Data: [...]
Ocean's DATUM is since this weekend putting transaction selection back into the hands of hashers, benefiting Bitcoin's censorship resistance.
Ocean's DATUM is since this weekend putting transaction selection back into the hands of hashers, benefiting Bitcoin's censorship resistance.
Solana is holding gains above the $150 resistance zone. SOL price is consolidating and might aim for a fresh increase above the $162 resistance zone. SOL price started a fresh increase above the $155 zone against the US Dollar. The price is now trading near $155 and the 100-hourly simple moving average. There is a key rising channel forming with support at $155 on the hourly chart of the SOL/USD pair (data source from Kraken). The pair could start another increase if it stays above the $155 support zone. Solana Price Regains Traction Solana price extended its increase above the $155 resistance like Bitcoin and Ethereum. SOL even climbed above $160 before the bears appeared. A high was formed at $162 and the price started a downside correction. There was a move below the $160 and $158 levels. However, the bulls were active near the $155 support zone. A low is formed at $155 and the price is now consolidating losses below the 23.6% Fib retracement level of the recent decline from the $162 swing high to the $155 low. Solana is now trading near $155 and the 100-hourly simple moving average. There is also a key rising channel forming with support at $155 on the hourly chart of the SOL/USD pair. On the upside, the price is facing resistance near the $158 level. The next major resistance is near the $160 level. It is close to the 76.4% Fib retracement level of the recent decline from the $162 swing high to the $155 low. The main resistance could be $162. A successful close above the $160 and $162 resistance levels could set the pace for another steady increase. The next key resistance is near $175. Any more gains might send the price toward the $180 level. More Downsides in SOL? If SOL fails to rise above the $158 resistance, it could start another decline. Initial support on the downside is near the $155 level. The first major support is near the $154 level. A break below the $154 level might send the price toward the $149 zone. If there is a close below the $149 support, the price could decline toward the $142 support in the near term. Technical Indicators Hourly MACD The MACD for SOL/USD is losing pace in the bullish zone. Hourly Hours RSI (Relative Strength Index) The RSI for SOL/USD is below the 50 level. Major Support Levels $155 and $149. Major Resistance Levels $158 and $162.
The Bitcoin Cash price prediction shows that BCH may head toward the channel’s lower boundary which could later settle in consolidation. Bitcoin Cash Prediction Statistics [...]
Aave price prediction shows that AAVE continues its rally as the coin spikes higher to touch the resistance level of $172.49. Aave Price Prediction Statistics [...]
The Filecoin price prediction may lack short-term and medium-term support, but if the price rises above the channel, the coin may face the upside. Filecoin [...]
With Bitcoin (BTC) hitting a near three-month high of $66,000 on Friday, technical analyst InspoCrypto suggests that the BTC futures market is at a critical juncture, with the potential for further short squeezes and the importance of maintaining support around the $64,000 level. Divergence Despite BTC Uptrend The analyst recently noted in his writing that the latest data shows that the BTC/USDT price chart hit a Friday high of $66,106, reflecting bullish sentiment as the cryptocurrency continues to climb. Over the past 24 hours, Bitcoin has seen a steady price increase, indicating optimism among investors. The True Strength Index (TSI) shows a slight divergence, indicating indecision in the market, but the upward trend remains intact. Related Reading: Solana Price (SOL) Pushes Higher: Surge Shows No Signs of Slowing Trading volume also plays a key role in understanding market dynamics, and current figures show a volume delta of $675.457 million, indicating a higher volume of buy orders than sell orders. This suggests buyers are currently dominating the market, supporting the bullish momentum. Notably, there has been a significant amount of short liquidations, totaling $331.24 million. This indicates that as Bitcoin’s price rises, many short positions are forced to close, further driving the price upward. In contrast, long liquidations remain comparatively low, suggesting that those holding long positions are confident in the markets direction. InspoCrypto’s heatmap analysis of Hyblock Capital shows a concentration of short liquidation levels around the $63,000 to $64,000 area. This clustering indicates a likely short squeeze that could push prices even higher. However, the analyst shows that long liquidation levels appear more scattered, presenting a lower risk of cascading liquidations on the long side. Analyst Predicts Further Bitcoin Price Surge InspoCrypto further found that open interest (OI) in Bitcoin futures is rising, indicating increased interest in the market and a potential buildup for significant price movements. The heatmap shows strong concentrations of open interest around the $64,000 to $65,000 range, suggesting that any price movement beyond these levels could trigger volatility as traders adjust their positions. The funding ratio currently stands at 763.8, indicating that the longs are paying off the shorts, adding to the bullish sentiment in the market. However, the analyst warns that a high funding ratio also signals a risk of long liquidation if the market unexpectedly shifts. Related Reading: XRP Struggles Below $0.60 Metrics Reveal Growing Selling Pressure Looking ahead, InspoCrypto anticipates that the next 24 hours could see continued upward momentum as shorts are squeezed. However, the elevated funding rates could lead to long liquidations if the market is downturned. By the end of the week, InspoCrypto believes that if the current buying pressure continues, the Bitcoin price could reach prices around $68,000, inching closer to its all-time high of $73,700 in March this year. At the time of writing, BTC has seen a slight retracement to its current trading price of $65,800. Featured image from DALL-E, chart from TradingView.com
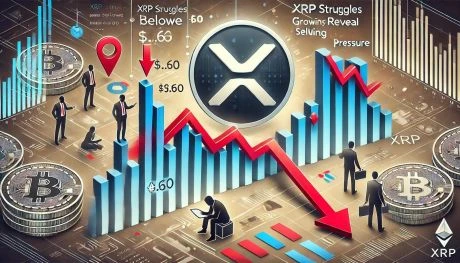
XRP has struggled to keep pace with the broader crypto market rally that began last week following the Federal Reserves interest rate cut. While other cryptocurrencies have seen impressive gains, XRP has only managed a modest 2% increase. Analysts and investors suggest this underperformance is due to growing interest in other projects, diverting attention and capital from the token. Adding to this concern, user participation in the XRP Ledger blockchain has declined, raising questions about the project’s long-term prospects. Related Reading: Cardano (ADA) Eyes 20% Price Surge Funding Rate Suggests Increasing Demand Key data from on-chain analytics firm Santiment reveals a notable drop in user engagement on the Ledger, contributing to a sense of unease among investors. As they watch other altcoins posting double-digit gains, fear and uncertainty are mounting within the XRP community. Investors are now looking for signs of a turnaround, but until the price can reignite user interest and regain momentum, it risks falling further behind in this bullish market cycle. With the market in flux, all eyes are on XRP to see if it can overcome these challenges and join the broader crypto rally. XRP Facing Serious Risk XRP is trading below the critical $0.60 mark, a psychological level that has acted as resistance for the past few months. Despite a recent surge in the crypto market, XRP shows signs of a potential retracement. While the altcoin initially benefited from the broader bullish sentiment, its weakening market signals suggest it may struggle to sustain this momentum soon. One concerning indicator is the decline in user engagement on the XRP Ledger blockchain. Key metrics from Santiment show that XRPs price Daily Active Addresses (DAA) divergence dropped to -74.46% yesterday. The price DAA divergence measures whether user participation is increasing alongside the price. A declining DAA, especially when the price is rising, is a bearish signal because fewer users interact with the network despite the price increase. This divergence suggests that the recent uptrend could be weak and unsustainable. Related Reading: Solana (SOL) Consolidates in Symmetrical Triangle Analyst Reveals $160 Target On Breakout If XRP continues to struggle and fails to close above the $0.60 resistance, it may face a more significant downturn. The altcoin could see a deep correction, potentially falling to lower demand levels around $0.55. Investors are now closely monitoring XRPs price action to see if it can reclaim the $0.60 level and regain momentum or if further declines are on the horizon. Price Levels To Watch XRP trades at $0.589 after two weeks of sideways movement, fluctuating between $0.57 and $0.59. Despite several attempts, the price has failed to break above the crucial $0.60 resistance level, leaving it at risk of a downturn. XRP is now approximately 6% above its daily 200 moving average (MA), which sits at $0.548a critical support that has provided stability in the past. For bullish momentum to build, XRP must break past the $0.60 barrier and aim for higher supply levels around $0.65. This move would signal renewed strength and potentially trigger a more substantial rally. However, the current price action appears weak, with limited upward momentum. If XRP fails to hold above the $0.60 level, a retest of lower demand zones around $0.55 is expected. Related Reading: SUI Price Sits 40% Below All-Time High As TVL Approaches $1 Billion The worst-case scenario for XRP would be an extended period of this sideways range, lacking a decisive breakout in either direction. Such prolonged consolidation could increase selling pressure, driving the price lower. Investors and analysts are watching closely to see if XRP can reclaim the $0.60 level, initiate a new uptrend, or face further declines. Featured image from Dall-E, chart from TradingView
Cardano is trading at a crucial supply level that could spark a significant rally to new highs. After last weeks interest rate cut, optimism has surged among analysts and investors, with many anticipating strong upward momentum for the altcoin. This positive sentiment is reflected in spot trading and the futures market, where key data from [...]
The post Cardano (ADA) Eyes 20% Price Surge Funding Rate Suggests Increasing Demand appeared first on Crypto Breaking News.
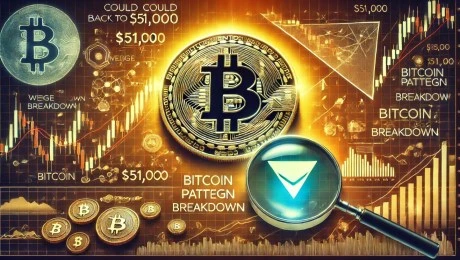
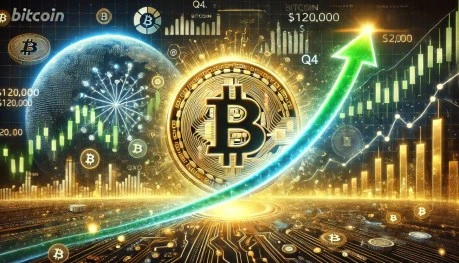
For the past five days, the Bitcoin price has remained locked in a narrow range between $62,000 and $64,000, following a surge of bullish sentiment triggered by the US Federal Reserves (Fed) decision to cut interest rates on September 18. This pivotal move by the Fed has sparked optimism among investors. Yet, Bitcoin has struggled to consolidate above the critical $64,000 level, which, if surpassed, could pave the way for a retest of previously lost resistance levels, potentially targeting $70,000 in the near term. Bitcoin Price Set To Reach New All-Time Highs? Despite this short-term stagnation, several analysts maintain an optimistic outlook for the Bitcoin price as the market approaches the fourth quarter (Q4) of the year. Market expert Lark Davis, for example, recently highlighted the historical trends that suggest the average return for Bitcoin during Q4 is a notable 88%. Davis suggested that if the Bitcoin price were to replicate this performance, it could soar to nearly $120,000. Even a more conservative estimate of a 55% gain – similar to last year’s performance – would take the price to $100,000. Related Reading: Dogecoin Parabolic Rally To Trigger 5,500% Surge To $6, Heres When In addition, the expert points out that this year offers unique catalysts that could drive significant price movements, including the launch of the Bitcoin exchange-traded fund (ETF) market, the upcoming US elections, and the expected $16 billion in cash repayments from the collapsed FTX exchange. However, when analyzing the current state of the Bitcoin market, there are signs that current price movements are being artificially constrained. Analysts Warns Of Final Dip Before Further Price Gains Analyst InspoCrypto has noted that the price action has been persistently hovering around $63,000, with breakout attempts being blocked. A significant institutional options trader has reportedly executed a block trade that appears designed to keep Bitcoins price stable until October 4. InspoCrypto further explains that the Spot Cumulative Volume Delta (CVD) indicates a pattern of distribution even as prices rise, while the Futures CVD shows a divergence, suggesting that recent price increases have been primarily driven by futures trading. The Whales vs. Retail Ratio analysis from Hyblock supports this view, revealing that while whales are accumulating short positions, retail investors are predominantly betting on long positionscreating a potentially unfavorable scenario for the latter group. Yet, InspoCrypto believes that the market will see one final dip before reaching new all-time highs (ATHs) of $80,000 or even $85,000 for the largest cryptocurrency on the market. Related Reading: XRP Remains Bullish: Crypto Experts Unveil Predictions For The Price Adding to the technical analysis, analyst Ali Martinez points out that Bitcoin is currently testing its 200-day Simple Moving Average (SMA) at the $64,000 mark, which is acting as a short-term resistance level. A breakout above this key level could signal a significant bullish trend, according to Martinez. Looking further ahead, if the Bitcoin Long-Term Power Law holds true, Martinez believes the next market top could reach around $400,000, with predictions for this peak to occur by October of next year. Overall, while Bitcoin faces short-term challenges, the consensus among analysts is that the cryptocurrency is poised for new all-time highs in Q4 and into 2025, despite the current state of the market and BTC’s inability to overcome short-term hurdles. At the time of writing, BTC is trading at $63,160, little changed from Monday’s price, and up 0.7% over the past 24 hours. Featured image from DALL-E, chart from TradingView.com
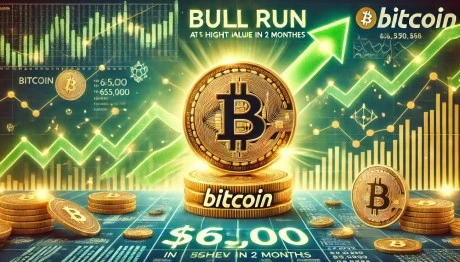
For the first time in nearly two months, Bitcoin (BTC) has surpassed the $65,000 mark, marking a significant recovery following two notable downturns in August and September. During these crashes, Bitcoin experienced a steep decline of 20% on two separate occasions, specifically on August 5 and September 6. However, as October approachesa month often associated with a bullish resurgence for Bitcoinmarket predictions are increasingly optimistic, suggesting that the cryptocurrency might be gearing up for another major uptrend. Could Bitcoin Reach $79,000 In October? On Thursday, Bitcoin recorded a 3% increase within a 24-hour period, reaching a price of $65,500. This upward movement has sparked discussions among analysts about whether this signals the start of a parabolic bull run. Related Reading: BlackRock Continues To Buy Bitcoin: Holdings Now Reach 358,000 BTC Worth $22 Billion Crypto investor Scott Melker expressed this sentiment, emphasizing that Bitcoin is currently attempting to establish its first higher high since peaking at $74,000 in March of this year. Melker noted that closing above $65,000 would confirm a new upward trend, transitioning from the lows of $50,000 observed in August. This patterna low, high, higher low, and higher highsuggests a bullish market structure replacing the previous bearish trends. Historically, October has been a strong month for Bitcoin, with analysts like Lark Davis pointing out that the average return during this month is approximately 22.90%. If Bitcoin were to experience a similar increase this year, it could potentially rise to around $79,000, surpassing its previous all-time high and overcoming key resistance levels. Such a move would set the stage for a powerful rally into November according to Davis analysis. Record-Breaking Performance In September In a further analysis, Rekt Capital provided insights into Bitcoin’s recent performance. He noted that September, often viewed negatively, turned out to be the best September for Bitcoin on record, with a 9% increase. Rekt also highlighted historical patterns related to Bitcoins Halving cycles, indicating that Bitcoin typically breaks out from its re-accumulation range approximately 154 to 163 days post-Halving. Currently, Bitcoin is 159 days past its last Halving that took place in April of this year. Based on previous cycles, Rekt believes that this timing suggests that a breakout could be imminent, reinforcing the idea that Bitcoin is well-positioned for significant gains in the near future. Related Reading: Dogecoin Eyes Bullish 50% Rally To $0.16, But Will A Crash Come First? The current resurgence can be attributed to the US Federal Reserve’s (Fed’s) dovish stance and recent 0.50% basis point (bps) interest rate cut on September 18, which was seen as a notable bullish catalyst not only for BTC but also for the broader market, which has followed Bitcoin’s performance to the upside in recent days. In addition, last week saw a resumption of inflows into the Bitcoin ETF market, following steady outflows throughout August and early September. For instance, US spot Bitcoin ETFs had a total net inflow of $106 million on Wednesday, continuing their net inflows for 5 consecutive days. BlackRock’s IBIT ETF had an inflow of $184 million. Overall, there seems to be a combination of bullish catalysts in place for the market’s largest cryptocurrency to continue its recovery, with massive gains expected in the last half of the year and early 2025. Featured image from DALL-E, chart from TradingView.com
World Crypto Global opens the door to digital freedom for everyone.
Manage your free WCG Coins securely—where simplicity meets global accessibility.
FREE CRYPTO COINS
AVAILABLE FOR RESERVATION
ALREADY ALLOCATED

No fees. No catch. Your crypto journey starts here.