W o r l d . C r y p t o . G l o b a l

Loading

Welcome at World Crypto Global. This portal is packed with useful content and resources to built out your own crypto skills. WorldCrypto is a site member of Gabriel Vega Network.

Contact Info

CATEGORY: xrp bearish


Aug 04, 2024 12:05

XRP, Bitcoin Sentiment Remains Very Positive: Bad Sign For Price?

Data shows the sentiment around XRP and Bitcoin is quite bullish currently, something that can actually be to the detriment of their prices. XRP & Bitcoin Among Coins Observing Positive Sentiment Right Now According to data from the analytics firm Santiment, the top cap cryptocurrencies are mainly observing the investors hold a bullish outlook. The indicator of interest here is the “Weighted Sentiment,” which basically tells us about the net sentiment around an asset that’s currently present on social media platforms. Related Reading: Bitcoin Makes Third Retest Of Historical Support, Analyst Sounds Alarm The “weighted” in its name comes from the fact that it weighs the sentiment present in the market (the Sentiment Balance) against the amount of discussion that’s happening on social media (the Social Volume). Because of this feature, this indicator’s value only registers a spike when not only is the crowd tending heavily towards one side as determined by Santiment’s machine-learning model, but also a large amount of posts/threads/messages exist on social media expressing such sentiment. The advantage of this adjustment is that the indicator is better able to portray what the actual situation in the market is like, as it doesn’t go by the opinion of only a few users (as would be the case in periods where traffic is low). Naturally, positive spikes in the Weighted Sentiment imply investors are bullish right now, while negative ones imply a bearish market. Values around zero suggest either there aren’t enough discussions happening on social media or the users as a whole are simply neutral. Now, here is a chart that shows the trend in this indicator for the five top assets in the sector, Bitcoin (BTC), Ethereum (ETH), BNB (BNB), XRP (XRP), and Solana (SOL), over the past few months: As displayed in the above graph, Bitcoin, XRP, Solana, and Ethereum, all have seen the Weighted Sentiment spike into positive territory recently, and these levels have so far persisted into the latest market downturn. This would imply that social media users hold a bullish sentiment around these coins right now. Bitcoin and XRP particularly stand out in terms of this, as the indicator for them is at the highest levels in 17 months and 14 months, respectively. Related Reading: Ethereum Seeing High Exchange Outflows, But Watch Out For This Bearish Signal BNB is the only cryptocurrency out of these that has the Weighted Sentiment in the negative territory, although the investors currently only hold a slightly fearful sentiment. This negative sentiment may actually play into the favor of BNB, however, as markets have historically been more probable to move in the opposite direction to what the crowd is expecting. Naturally, this means that the highly positive sentiment around Bitcoin and XRP could be bearish for their prices instead. XRP Price XRP has extended its drawdown during the past 24 hours with a drop of 6%, which has taken its price to $0.57. Featured image from Dall-E, Santiment.net, chart from TradingView.com

Jul 17, 2024 05:50

XRP & Litecoin See Social Media FOMO: Bad Sign For Prices?

Data shows that users on social media are overwhelmingly showing FOMO towards XRP and Litecoin, something that could be a bearish sign for their prices. Weighted Sentiment Has Spiked For Both XRP & Litecoin Recently According to data from the analytics firm Santiment, LTC and XRP are among the coins that have seen an improvement [...]

The post XRP & Litecoin See Social Media FOMO: Bad Sign For Prices? appeared first on Crypto Breaking News.

May 04, 2024 05:50

XRP Forms On-Chain Signal That Led To 16% Crash Last Time

On-chain data shows that many old coins have moved on the XRP network recently, a sign that proved to be bearish for the coin last time. XRP Age Consumed Metric Has Registered A Large Spike According to data from the on-chain analytics firm Santiment, XRP has just observed a large movement of dormant coins similar [...]

The post XRP Forms On-Chain Signal That Led To 16% Crash Last Time appeared first on Crypto Breaking News.

XRP Breaks Out Of Head-And-Shoulders Pattern  Eyes Move Toward $1.30

Author: Sebastian Villafuerte
United Kingdom
Apr 09, 2025 12:05

XRP Breaks Out Of Head-And-Shoulders Pattern Eyes Move Toward $1.30

XRP is trading at critical levels after dropping below the $2 mark on Sunday, following a wave of panic selling across the crypto market. The move came as global financial markets reacted sharply to aggressive new U.S. tariffs, escalating trade tensions and sending risk assets tumbling. XRP, like many altcoins, has been hit hard by the volatility, with sentiment turning increasingly bearish. Related Reading: Solana Drops Below $100 For First Time In A Year Is An 80% Correction Underway? Adding to the concern, top analyst Ali Martinez shared technical insights that point to further downside. According to Martinez, XRP is currently breaking out of a head-and-shoulders pattern a classic bearish setup that often signals the beginning of a larger correction once the neckline is broken. If the pattern plays out, XRP could be heading toward the $1.30 level, a key zone of historical demand and potential support. With market conditions already fragile and uncertainty growing, this pattern reinforces the bearish outlook for XRP in the short term. Unless bulls can reclaim $2 and invalidate the breakdown, XRP may continue to bleed alongside the broader market. All eyes are now on how price behaves in the coming sessions, as traders assess the strength of this technical signal. XRP Faces Bearish Outlook As Head-and-Shoulders Pattern Confirms Breakdown XRP has now lost over 50% of its value since reaching its recent all-time high, and the market is showing no clear signs of stability. As fear spreads across both traditional and crypto markets, XRP remains under heavy pressure, with volatility intensifying in recent sessions. The broader landscape clouds with macroeconomic tension, particularly US tariffs that have triggered global trade concerns and sent risk assets into a tailspin. The sentiment surrounding XRP is deeply divided. While some investors still believe that a broader market recovery could help XRP reclaim range highs, others remain skeptical. For now, price action supports the latter. Bulls have failed to defend the $2 mark a critical psychological and technical level and XRP has continued to trend lower. Martinez added to the bearish narrative, sharing a technical breakdown on X that shows XRP is currently breaking out of a head-and-shoulders pattern. This formation is widely regarded as a bearish reversal signal, and Martinez suggests that the confirmed breakdown could send XRP tumbling toward the $1.30 level. That target aligns with historical demand and previous support zones, making it a likely destination if current momentum continues. Unless bulls reclaim $2 quickly and invalidate the pattern, XRP may struggle to recover in the near term. With the broader market still unstable and high-risk assets under pressure, the bearish outlook for XRP appears to be gaining traction. The coming days will be critical as traders watch whether XRP stabilizes or slips further into its current downtrend. Related Reading: Ethereum Capitulation May Be Nearing End Will A Fed Pivot Spark A Recovery? Bulls Struggle At $1.86 And Fight To Avoid Deeper Correction XRP is trading at $1.86 after several days of struggling to reclaim higher levels, with selling pressure dominating price action. Bulls lost momentum once the price broke below the key $2 support, which had previously served as a psychological and technical floor. Since then, XRP has continued to slide, failing to generate enough buying volume to spark a meaningful recovery. The current level around $1.86 is now acting as a short-term support zone, but it remains vulnerable. If XRP doesn’t hold above this area, sellers will likely push it toward the $1.50 region. This level marks a significant demand zone from previous market cycles and could act as the next stop in the event of continued bearish pressure. Related Reading: Ethereum Lags Behind Bitcoin In Q1 Performance Amid Market Downturn Details On the flip side, if bulls can manage a swift rebound and push the price back above $2, it may trigger a short-term relief rally. Reclaiming that level would invalidate some of the recent bearish momentum and potentially set the stage for XRP to target higher resistance around $2.20 and beyond. For now, XRP remains caught in a delicate spot and what happens next will depend largely on whether buyers step in to defend the current support zone. Featured image from Dall-E, chart from TradingView

XRP MVRV Ratio Dips Below The 200-Day MA  Trend Shift Underway?

Author: Sebastian Villafuerte
United Kingdom
Apr 02, 2025 12:05

XRP MVRV Ratio Dips Below The 200-Day MA Trend Shift Underway?

XRP has been navigating a volatile consolidation phase since late January, shedding over 40% of its value from its most recent all-time high. While the broader crypto market has struggled under the weight of macroeconomic uncertainty, XRP has managed to outperform many altcoins during this downturn. Several major altcoins have lost more than 60% of their value during the same period, highlighting XRP’s relative strength despite the ongoing correction. Related Reading: Chainlink Weekly Indicator Flashes Buy Signal Can Bulls Hold $13.20 Support? Global financial markets remain under pressure, with inflation concerns, geopolitical tensions, and interest rate uncertainty fueling a risk-off environment. These macro factors continue to ripple through the crypto space, dragging down sentiment and slowing momentum across most digital assets. However, on-chain data from Santiment has revealed an interesting development for XRP. The MVRV (Market Value to Realized Value) Ratio has just dipped below its 200-day moving average a crossover that historically signals a potential macro trend shift. This could be an early indication of a possible accumulation phase or a deeper correction, depending on how price reacts in the coming weeks. With volatility high and sentiment mixed, XRPs ability to hold its ground and respond to key on-chain signals will be crucial in determining its next move. XRP Holds Above $2 as Market Tension Builds XRP is currently facing a crucial test as it hovers just above the $2 mark a key psychological and structural support level. Analysts warn that if this level fails to hold, it could trigger a steep correction and send XRP into a deeper downtrend. The market is on edge, with sentiment growing increasingly split and volatile. Some investors remain optimistic, arguing that XRP is positioned to reclaim its range highs once macro conditions stabilize and market confidence returns. They point to XRPs relative strength in recent months compared to other altcoins, believing that any recovery across crypto could quickly lift XRP back into its previous trading range. However, others are more cautious, pointing to weakening momentum and uncertain price structure. A growing number of analysts believe XRP may be entering a new bearish phase, particularly if the $2 support fails. Adding to this tension, top analyst Ali Martinez shared insights on X highlighting a key on-chain development: the XRP MVRV (Market Value to Realized Value) Ratio has dipped below its 200-day moving average. Historically, this crossover has signaled a potential macro trend shift in price action. While not inherently bearish, it often precedes major directional moves up or down. As XRP teeters on the edge, this MVRV signal may prove crucial in determining the next leg. If bulls can hold $2 and reclaim momentum, XRP could recover swiftly. If not, a bearish outlook could materialize quickly. The coming days may define the trajectory of XRP for the rest of the quarter. XRP Bulls Fight to Hold Key Support XRP is trading at $2.13 after several days of sustained selling pressure, marking a decline of over 21% since March 19. The recent downturn has put bulls on the defensive, with the $2 level now acting as a critical support zone. If XRP fails to hold above this mark, it could confirm a shift toward a bearish trend and open the door to further downside in the short term. For bulls to regain momentum, defending $2 is essential but holding support alone wont be enough. XRP must also reclaim the $2.40 resistance level, which has acted as a ceiling during recent attempts to break higher. A successful move above $2.40 could reignite bullish sentiment and potentially push XRP toward new all-time highs. However, the broader market remains fragile, and investor confidence is shaky amid macroeconomic uncertainty. A breakdown below $2 would likely trigger increased selling pressure and confirm that the recent upswing was only a temporary bounce within a larger corrective structure. Related Reading: Dogecoin Holds Key Support: A Demand Spike Could Trigger A Rally The coming days are critical for XRP. Whether bulls can defend $2 and begin a recovery, or if bears take control, will determine the next direction of the trend. Featured image from Dall-E, chart from TradingView

Mar 10, 2025 12:05

XRP Price Chart Signals Trouble Is A Drop To $1.20 Possible?

The price of XRP has recorded a significant downtrend in the last 24 hours, declining by almost 5% according to data from CoinMarketCap. Amidst this price fall, renowned market analyst Ali Martinez has stated there is a strong bearish pattern forming on the XRP price chart signaling further price drops ahead. Related Reading: XRP Could Start An Explosive Move To $33 Within 28 Days, Says Analyst XRP Faces Bearish Breakdown As Head-And-Shoulders Pattern Emerges Over the last week,  XRP investors have witnessed both sides of the crypto market volatility after a spontaneous 30% surge to $3.00 was followed by a bearish price action of almost equal strength. Currently, XRP trades at around $2.30 in a downtrend signaling a dominant selling pressure. Commenting on the current state of the market,  Ali Martinez stated that XRP’s price action on its daily chart is forming a head-and-shoulders pattern suggesting an incoming heavy price fall. For context, the head-and-shoulders pattern is a common reversal signal, that appears at the peak of an uptrend before a significant downtrend begins. This bearish formation starts with the left shoulder which is an initial price peak followed by a moderate pullback. This can be seen with XRP’s price action in late 2024 after it surged to around $2.70 in early December before the general market correction. Thereafter, there is the head component which represents a higher price peak i.e. the current local market top at $3.40, followed by another decline. Finally, the head and shoulders pattern is completed by the right shoulder formed by XRP’s choppy price action in the last week. The altcoin is now on a downtrend putting many traders on alert for a potential substantial price crash. However, despite the head-and-shoulders pattern, a bearish signal can only be confirmed when XRP breaks decisively below the neckline at $2.20. In this case, Martinez warns the crypto asset could fall as low as $1.20, representing a potential 50% fall from XRP’s local highs seen in February. In neutralizing this bearish projection, XRP bulls must provide enough market demand to push the coin past the right shoulder peak of $3.00, signaling momentum for a prolonged price uptrend. XRP Market Overview At press time, XRP trades at $2.34 following a 4.56% decline in the last 24 hours. However, its weekly chart reflects gains of 9.44% pushing the asset into minor monthly gains of 0.34%.  The fourth largest cryptocurrency has recently dipped below its 100-day Simple Moving Average correlating with fears of a sustained price fall. However, the XRP community remains largely bullish according to CoinMarketCap data. Related Reading: Bitcoin Price Forecast: LTF Head And Shoulders Pattern Predicts Crash Heres The Target Featured image from Bitcoin Sistemi, chart on Tradingview

Apr 01, 2025 12:05

XRP & These Altcoins Share The Same TA FateWhats Coming?

An analyst has pointed out how XRP and three other altcoins look like they share a similar technical analysis (TA) fate. Here’s what could be in store for these assets. TA Patterns Are Pointing At Same Outcome For Four Altcoins In a new post on X, analyst Ali Martinez has pointed out a commonality that may be present among XRP (XRP), Ethereum Classic (ETC), Bitcoin Cash (BCH), and yearn.finance (YFI). Related Reading: Bitcoin Weekly Preview: Tariffs, Whales, And Volatility Ahead The similarity lies in the signal that TA is giving on the price charts of each of these altcoins. Here are the graphs the analyst shared, showing the patterns: The first chart (top left) highlights the trend in the 1-day price of XRP, the fourth largest cryptocurrency by market cap. It would appear that the asset has possibly been forming what’s known as a head-and-shoulders pattern. This pattern forms when an asset’s price shows three peaks following a sharp surge, with the inner and outer peaks being similar in scale (the shoulders), and the middle one the largest (the head). The formation also involves one other feature: a support trendline that facilitates the formation of the different peaks. From the graph, it’s apparent that XRP is currently retesting this support line, after forming its third peak (the right shoulder). The head-and-shoulders generally signal a reversal of trend, so it’s possible that the coin may end up failing this retest and a sharp plunge would follow next. Bitcoin Cash, the bottom right chart, is also making a retest of what could be an important support line. In this case, the trendline is the lower one of a symmetrical triangle. The symmetrical triangle occurs when an asset finds itself consolidating between two trendlines that converge at a roughly equal and opposite slope. This means that as the price travels inside the channel, the distance between its tops and bottoms progressively becomes narrower. The upper channel provides resistance and the lower one provides support, but as the consolidation gets very narrow (that is, the price approaches the apex of the triangle), a breakout can become likely. Recently, Bitcoin Cash has come quite close to the triangle’s end, so it’s possible that an escape may be happening soon. As BCH is retesting the lower trendline right now, it’s possible that this break could happen towards the downside. Such a breakout, if one happens, could be a bearish signal for the coin, just like the one for XRP. Related Reading: Could XRP Actually Reach $10,000? Expert Weighs In The other two altcoins, Ethereum Classic (top right) and yearn.finance (bottom left), are both near the bottom line of a parallel channel. In this pattern, consolidation occurs between two parallel trendlines. It’s possible that support might end up holding for these coins, just like it has in the past, but given the fact that they have been trading inside the channel for a couple of years now and that a shift toward a bearish mood has taken place in the sector, a breakout to the downside may be coming. It now remains to be seen if XRP and the other altcoins will end up following in the trajectory that TA has been hinting at or not. XRP Price At the time of writing, XRP is trading around $2.06, down over 16% in the last seven days. Featured image from Dall-E, charts from TradingView.com

XRP Must Break Above $3 To Invalidate Bearish Pattern And Flip Bullish  Analyst

Author: Sebastian Villafuerte
United Kingdom
Mar 29, 2025 12:05

XRP Must Break Above $3 To Invalidate Bearish Pattern And Flip Bullish Analyst

XRP is facing a pivotal moment after failing to test the $2.60 resistance level, with price action now leaning toward critical demand. The token continues to trade sideways in a wide range, reflecting growing uncertainty as the broader crypto market faces renewed selling pressure. Despite a strong performance in recent weeks, bulls are struggling to maintain momentum, and the inability to push higher has left XRP vulnerable to further consolidation or downside. Related Reading: XRP Open Interest Has Surged 36% In Two Weeks Is Momentum Building? The market’s overall risk-off sentiment is making it difficult for altcoins like XRP to establish a clear direction. Investors remain cautious, and bulls must now defend key support zones to avoid triggering a deeper correction. XRP is approaching a critical demand area that could determine its short-term trajectory. Crypto analyst, Ali Martinez, shared insights on X, pointing to a potential bullish scenario if XRP can break above the $3 mark. According to Martinez, such a move would invalidate the current head-and-shoulders pattern forming on the chart, effectively flipping the outlook in favor of the bulls. XRP Faces Key Breakout Test Amid Market Uncertainty XRP is approaching a critical point in its price structure, where a breakout above key levels could trigger a major uptrend. However, investors remain cautious, with many worried that the current setup may be a bull trap especially given the unstable macro environment. Since late January, financial markets have faced growing turbulence, fueled by trade war fears and erratic policy behavior from U.S. President Donald Trump. This uncertainty has weighed heavily on risk assets, including cryptocurrencies, and continues to prevent clear trend formation across the board. XRPs price action reflects this broader market indecision. While the token has shown resilience, it remains locked in a wide range, unable to build sustained bullish momentum. The recent failure to break above the $2.60 resistance level has added to investor concern, as selling pressure appears to be creeping back into the market. Martinez weighed in on the situation, highlighting a technical level that could define XRPs short-term trajectory. According to Martinez, if XRP can break above the $3 mark, it would invalidate the current head-and-shoulders pattern forming on the chart a pattern typically associated with trend reversals. Such a move would flip the market outlook bullish and open the door for a major rally. Until that breakout occurs, however, the head-and-shoulders structure remains in play, and downside risks cannot be ignored. Investors are watching closely as XRP trades near critical support and resistance levels, knowing that the next breakout or breakdown could shape its direction for weeks to come. For now, XRP remains caught in a tight battle between bearish pressure and bullish potential. Related Reading: Avalanche 12-Hour TD Sequential Flashes Sell Signal After Nailing 50% Rally Details Bulls Defend Key Support at $2.20 XRP is currently trading at $2.22 after losing the critical $2.40 level, which aligns with both the 4-hour 200 moving average (MA) and the exponential moving average (EMA). This breakdown has weakened short-term momentum, placing bulls in a defensive position as selling pressure begins to build. The $2.20 level now stands as a key support zone that must be defended to avoid a deeper correction. To regain strength and shift momentum back in favor of the bulls, XRP must reclaim the $2.35 level in the coming sessions. A move above this resistance zone would indicate renewed buying interest and potentially trigger a push back toward the $2.60 range. Until then, price action remains fragile, with investors watching closely for confirmation. Related Reading: Solana Tags Upper Bollinger Band For First Time Since ATH Is Momentum Returning? However, if XRP fails to hold above $2.20, the market could see a sharp drop toward the $2.00 mark a psychological and structural support level that has held in previous corrections. Such a move would likely confirm bearish dominance in the short term and further delay any potential breakout. As volatility continues to build, the next few hours could be crucial for XRPs short-term trend direction. Featured image from Dall-E, chart from TradingView

Feb 07, 2024 12:05

XRP, SOL Among Coins With Red Sentiment, Time To Buy Against Crowd?

Data shows various cryptocurrencies like XRP and Solana are currently witnessing bearish majority sentiment on social media platforms. XRP, SOL, And Other Assets Are Sharing A Red Mentality Currently According to data from the analytics firm Santiment, a notable bearish sentiment has emerged among cryptocurrency traders during the past week. The relevant indicator is the “Weighted Sentiment,” based on two other metrics: the Sentiment Balance and Social Volume. The Sentiment Balance keeps track of the net sentiment present among users on the major social media platforms. The metric calculates this score by reviewing social media posts and applying a machine-learning model to filter for positive and negative sentiments. Related Reading: Dogecoin Trounced: Chainlinks 34% Jump Kicks DOGE Out Of Top 10 List Once the indicator has found the scores for these bullish and bearish sentiments, it takes their difference to give the average or net sentiment present among the traders. The other relevance metric here, the Social Volume, tells us about the amount of discussion related to any topic or term on social media platforms. The Weighted Sentiment takes the Sentiment Balance and then weighs it against this Social Volume. This means that the indicator’s value only spikes (in either direction) when not only is there some notable imbalance present in the market (that is, the net sentiment has a significant value), but the volume of social media discussion about these sentiments is also high. This fact makes the Weighted Sentiment more reliable than the Sentiment Balance, as it can provide a better picture of the trend among the traders as a whole (since the Social Volume would only spike when there are many users involved in discussions). Now, here is a chart that shows the trend in the Weighted Sentiment for six different cryptocurrencies: Bitcoin (BTC), Ethereum (ETH), BNB (BNB), XRP (XRP), Cardano (ADA), and Solana (SOL). The value of the metric appears to be negative for all of these assets right now | Source: Santiment on X As displayed in the above graph, these assets have had a negative Weighted Sentiment recently, suggesting that bearish sentiment has dominated social media users. More specifically, the indicator is around -0.36 for XRP, while it’s about -0.64 for Solana. Historically, cryptocurrency markets have been more likely to move in the direction opposite to what the crowd is expecting. As such, price rebounds become more probable the more negative the sentiment gets, while tops can occur when the traders share a highly bullish mentality. Followers of contrarian investing exploit this to time their buying and selling moves. Warren Buffet’s famous quote sums up this idea, “be fearful when others are greedy, and greedy when others are fearful.” Related Reading: Bitcoin CDD Shows Bullish Breakout, Rally Returning In Full Flow? Given the red sentiment XRP and others are witnessing, a contrarian trader might think it is the right time to buy into these cryptocurrencies. XRP Price XRP had attempted recovery earlier, but the move appears to have failed as the asset has returned under the $0.50 level. Looks like the price of XRP hasn't moved much recently | Source: XRPUSD on TradingView Featured image from Shutterstock.com, charts from TradingView.com, Santiment.net

Nov 22, 2024 12:05

XRP Binance Inflows Spike: What It Means For Price

On-chain data shows the XRP Binance Netflow has spiked to positive levels recently. Here’s what this could mean for the asset’s price. XRP Investors Have Been Depositing To Binance Recently As explained by an analyst in a CryptoQuant Quicktake post, a large amount of XRP deposit transactions have headed to Binance recently. The on-chain metric of relevance here is the “Exchange Netflow,” which keeps track of the net transfers going in or out of a given centralized exchange. The traditional form of this metric measures the difference between the inflow and outflow volume for the platform, but in the context of the current topic, a different version of the indicator is of interest: one that counts the net number of deposit/withdrawal transactions. When the value of the metric is positive, it means there are more inflow transfers happening for the exchange than outflow ones. As one of the main reasons why investors deposit to these platforms is for selling-related purposes, this kind of trend can be bearish for XRP. Related Reading: Cardano Outperforms Market With 50% Surge: Heres Why On the other hand, the indicator being negative implies withdrawals are dominant on the exchange. Such a trend can be a sign that holders are interested in HODLing into the long term, which can naturally have bullish effects on the price. Now, here is a chart that shows the trend in the 30-day moving average (MA) of the XRP Exchange Netflow for Binance over the last couple of years: As is visible in the above graph, the XRP Exchange Netflow for Binance has mostly stayed inside the positive territory during the last two years, which suggests investors have constantly been making withdrawal transactions. Recently, however, the metric appears to have diverged from the norm, as its value has registered a sharp positive spike. The asset has seen a sharp rally of over 54% in the past week, so it’s possible that the traders making the deposits are looking to sell and realize their profits. Now, the main question is, is this selling a potential threat to XRP’s value? The indicator is sitting at 470 right now, which suggests significantly more inflows than outflows. Considering that this is also just the 30-day MA, the peak value is bound to be even higher. Related Reading: Bitcoin Is About To See A Historically-Profitable Crossover In This Metric While this high number of inflow transactions may look like a danger at first glance, it may actually not be so, since it corresponds to activity that’s mostly from the retail investors. Whales don’t tend to leave behind too many transactions, as they prefer to move large amounts with a single transaction. Thus, whenever this version of the Exchange Netflow spikes, it’s a sign that the small holders are depositing. Naturally, there could still be a few whale transfers among these inflows, which can indeed end up having a negative effect on the XRP price. It only remains to be seen, though, which of the scenarios holds true. XRP Price XRP has pulled ahead of the rest of the market with a sharp rally during the past week, which has taken its price to $1.09. Featured image from Dall-E, CryptoQuant.com, chart from TradingView.com
Oct 05, 2024 12:05

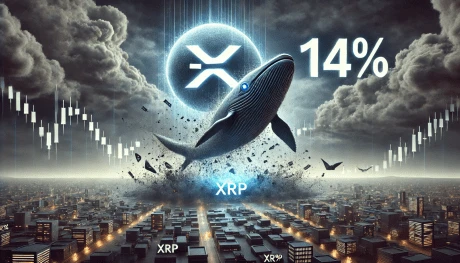
XRP Crashes 14% As Whales Send Deposits To Exchanges

The XRP price has registered a notable drop during the past day as on-chain data shows the whales have been making transactions to exchanges. XRP Has Witnessed A Sharp Drop Over The Last 24 Hours The cryptocurrency sector has been observing bearish winds recently, with the drawdown deepening across the market during the past day. Most of the top coins, though, have managed to limit their losses, except for XRP, which has notably underperformed. Related Reading: Dogecoin Crossover That Led To 90% & 180% Rallies Could Soon Form Again The below chart shows how the coin’s recent trajectory has looked like. Following the 14% drop in the last 24 hours, XRP has come down to the $0.52 level. This plunge has also put the asset more than 21% down compared to the $0.66 top that it had seen a few days back. As for why the cryptocurrency has performed this poorly during the past day, perhaps on-chain data can provide some hints. Whales Have Been Active On The Network Recently According to data from the cryptocurrency transaction tracker service Whale Alert, several large transactions have been spotted on the XRP network in the last 24 hours. All of these transactions happen to be of a scale that’s generally associated with the whales, who are large entities that can carry a degree of influence in the market. Naturally, one whale can’t move the market on their own, but some number of them together can, which may be exactly what has happened today. Generally, it can be hard to say for certain what the whales’ intentions are when they make moves, but address details can sometimes carry a hint or two. Here are the details of the first of the whale transfers from the past day: As is visible above, the whale moved 17,940,000 XRP, worth around $10.3 million at the time the transfer was executed, from an unknown wallet to an address connected to the cryptocurrency exchange Bitstamp. An “unknown wallet” is one that’s not affiliated to any known centralized platform and is likely to be an investor’s personal address. Thus, it would appear that the whale moved coins from their self-custodial wallet to an exchange with this transaction. Related Reading: Shiba Inu Leads Whale Frenzy: Large SHIB Transfers See Massive 360% Spike Transfers of this type are called exchange inflows. Since one of the main reasons why investors deposit their coins to these platforms is for selling-related purposes, large exchange inflows can lead to a bearish outcome. The three other XRP whale transactions from the past day were also of the same type, with whales shifting a combined $37.9 million to different platforms. It’s possible that these transfers weren’t for selling at all, but for using a different service that exchanges typically provide. Given the corresponding price trend, though, it’s indeed likely that these moves provided a net selling pressure to the cryptocurrency. Featured image from Dall-E, whale-alert.io, chart from TradingView.com
Your Crypto Gateway

Claim 1,000
Free WCG Coins

World Crypto Global opens the door to digital freedom for everyone.
Manage your free WCG Coins securely—where simplicity meets global accessibility.

11 bn

FREE CRYPTO COINS

8.9 bn

AVAILABLE FOR RESERVATION

2.1 bn+

ALREADY ALLOCATED

× WCG Coin

🎉 Get 1,000 WCG Coins

No fees. No catch. Your crypto journey starts here.