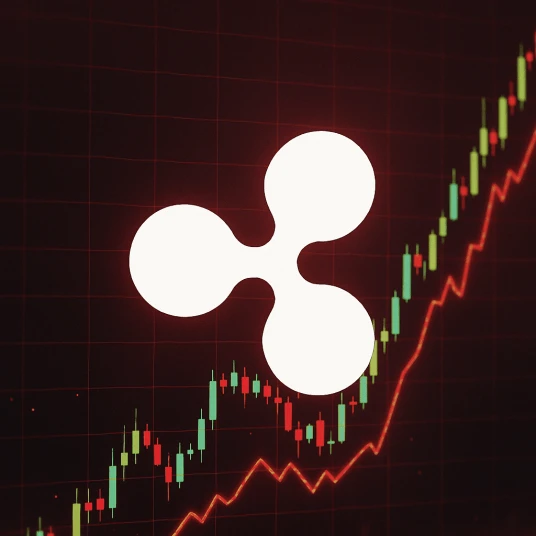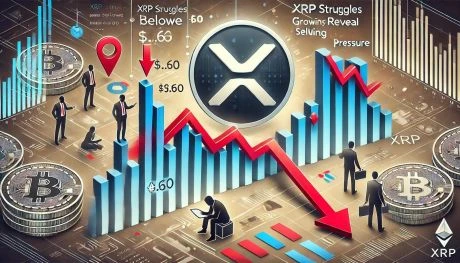
XRP Struggles Below $0.60 Metrics Reveal Growing Selling Pressure
XRP has struggled to keep pace with the broader crypto market rally that began last week following the Federal Reserves interest rate cut. While other cryptocurrencies have seen impressive gains, XRP has only managed a modest 2% increase. Analysts and investors suggest this underperformance is due to growing interest in other projects, diverting attention and capital from the token. Adding to this concern, user participation in the XRP Ledger blockchain has declined, raising questions about the project’s long-term prospects. Related Reading: Cardano (ADA) Eyes 20% Price Surge Funding Rate Suggests Increasing Demand Key data from on-chain analytics firm Santiment reveals a notable drop in user engagement on the Ledger, contributing to a sense of unease among investors. As they watch other altcoins posting double-digit gains, fear and uncertainty are mounting within the XRP community. Investors are now looking for signs of a turnaround, but until the price can reignite user interest and regain momentum, it risks falling further behind in this bullish market cycle. With the market in flux, all eyes are on XRP to see if it can overcome these challenges and join the broader crypto rally. XRP Facing Serious Risk XRP is trading below the critical $0.60 mark, a psychological level that has acted as resistance for the past few months. Despite a recent surge in the crypto market, XRP shows signs of a potential retracement. While the altcoin initially benefited from the broader bullish sentiment, its weakening market signals suggest it may struggle to sustain this momentum soon. One concerning indicator is the decline in user engagement on the XRP Ledger blockchain. Key metrics from Santiment show that XRPs price Daily Active Addresses (DAA) divergence dropped to -74.46% yesterday. The price DAA divergence measures whether user participation is increasing alongside the price. A declining DAA, especially when the price is rising, is a bearish signal because fewer users interact with the network despite the price increase. This divergence suggests that the recent uptrend could be weak and unsustainable. Related Reading: Solana (SOL) Consolidates in Symmetrical Triangle Analyst Reveals $160 Target On Breakout If XRP continues to struggle and fails to close above the $0.60 resistance, it may face a more significant downturn. The altcoin could see a deep correction, potentially falling to lower demand levels around $0.55. Investors are now closely monitoring XRPs price action to see if it can reclaim the $0.60 level and regain momentum or if further declines are on the horizon. Price Levels To Watch XRP trades at $0.589 after two weeks of sideways movement, fluctuating between $0.57 and $0.59. Despite several attempts, the price has failed to break above the crucial $0.60 resistance level, leaving it at risk of a downturn. XRP is now approximately 6% above its daily 200 moving average (MA), which sits at $0.548a critical support that has provided stability in the past. For bullish momentum to build, XRP must break past the $0.60 barrier and aim for higher supply levels around $0.65. This move would signal renewed strength and potentially trigger a more substantial rally. However, the current price action appears weak, with limited upward momentum. If XRP fails to hold above the $0.60 level, a retest of lower demand zones around $0.55 is expected. Related Reading: SUI Price Sits 40% Below All-Time High As TVL Approaches $1 Billion The worst-case scenario for XRP would be an extended period of this sideways range, lacking a decisive breakout in either direction. Such prolonged consolidation could increase selling pressure, driving the price lower. Investors and analysts are watching closely to see if XRP can reclaim the $0.60 level, initiate a new uptrend, or face further declines. Featured image from Dall-E, chart from TradingView