Alarming Similarities With Previous ETH Patterns Emerge: Will $2.3K Hold? (Ethereum Price Analysis)
Ethereums price has been rapidly declining recently following a rejection from the $2,750 resistance level. While a further drop is probable in the short term, the overall bullish trend might not be over.
Technical Analysis
By TradingRage
The Daily Chart
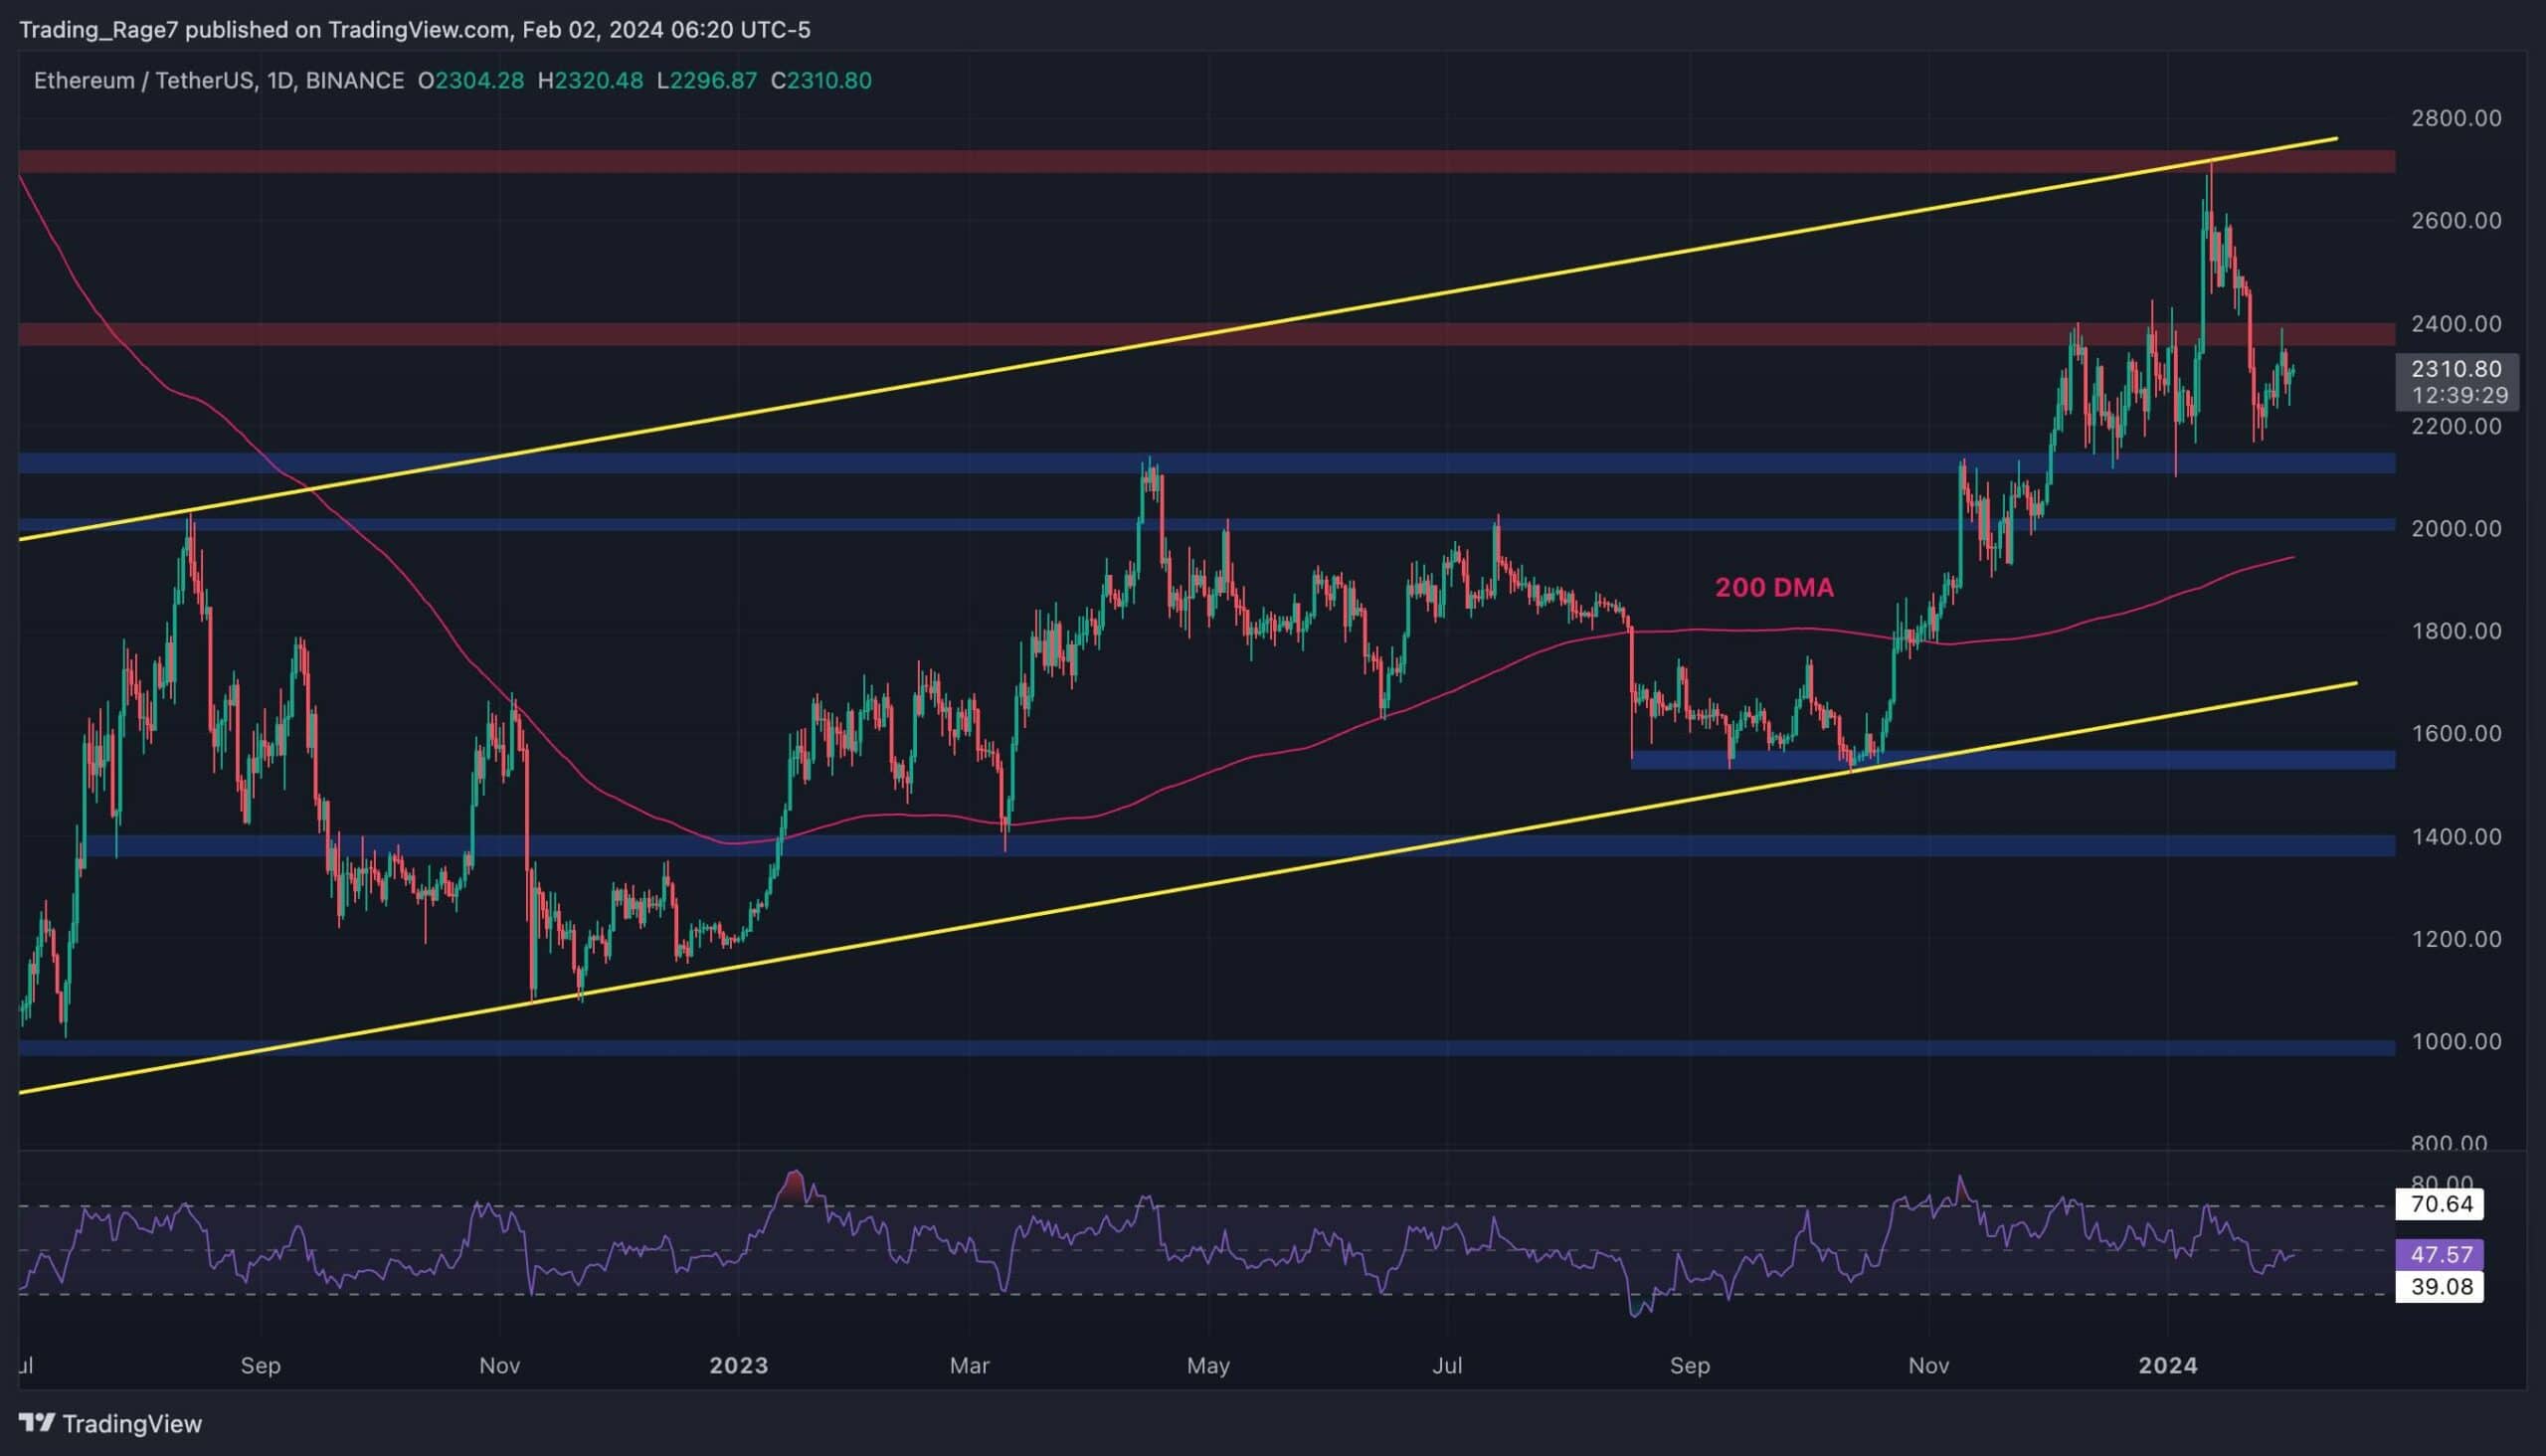
On the daily chart, the Ethereum price has been oscillating inside a large ascending channel. The higher boundary of the pattern, paired with the $2,750 resistance level, has rejected the price to the downside.
The market has since dropped below the $2,400 level and is currently retesting it. In case the price fails to climb back above, the likelihood of a further drop toward the 200-day moving average located around the $2,000 level will be significant.
The 4-Hour Chart
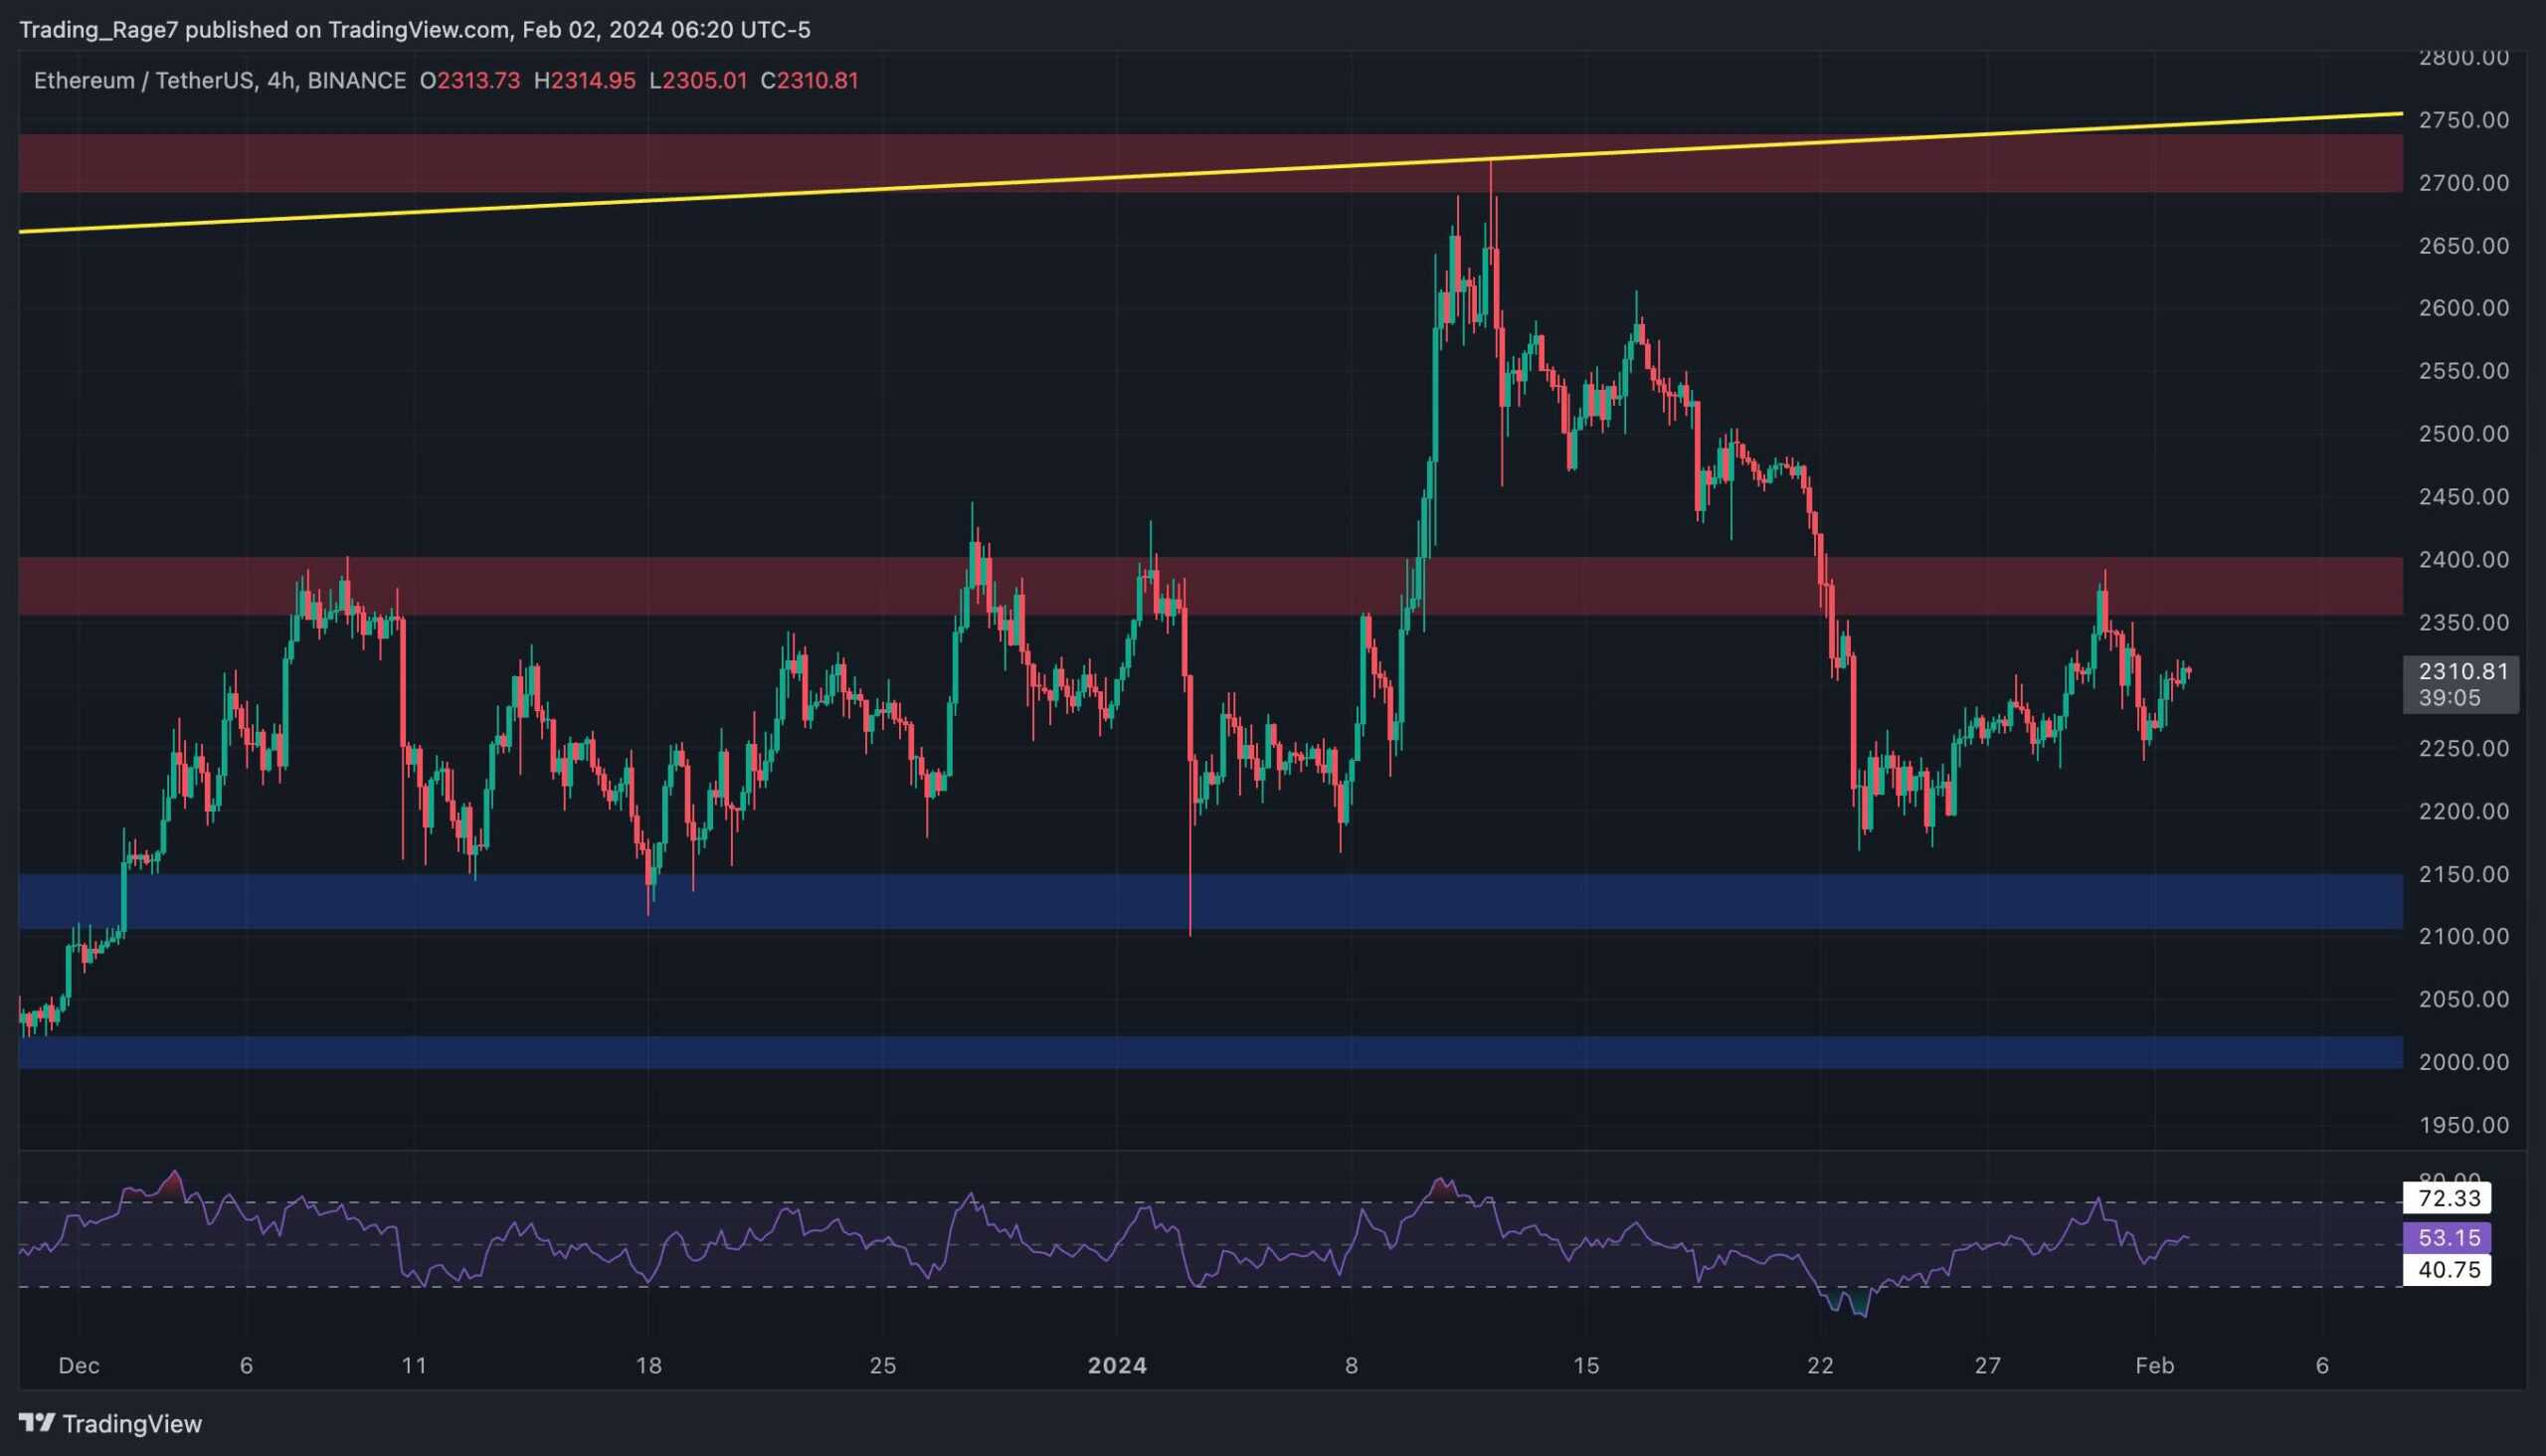
The 4-hour chart shows the recent price fluctuations more clearly. The market has gone through a massive drop since the rejection from the $2,750 level.
ETH is currently consolidating between the $2,400 and $2,150 levels, with the mid-term fate of the market depending on the direction of the potential breakout from either side. The Relative Strength Index has also been hovering around the 50% level, offering little clue about where the market is likely to go next.
Sentiment Analysis
By TradingRage
Ethereum Funding Rates
Amid Ethereums recent price decline, market participants have been wondering whether the bullish trend is over or not. In this situation, analyzing sentiment might be beneficial in determining the future price direction.
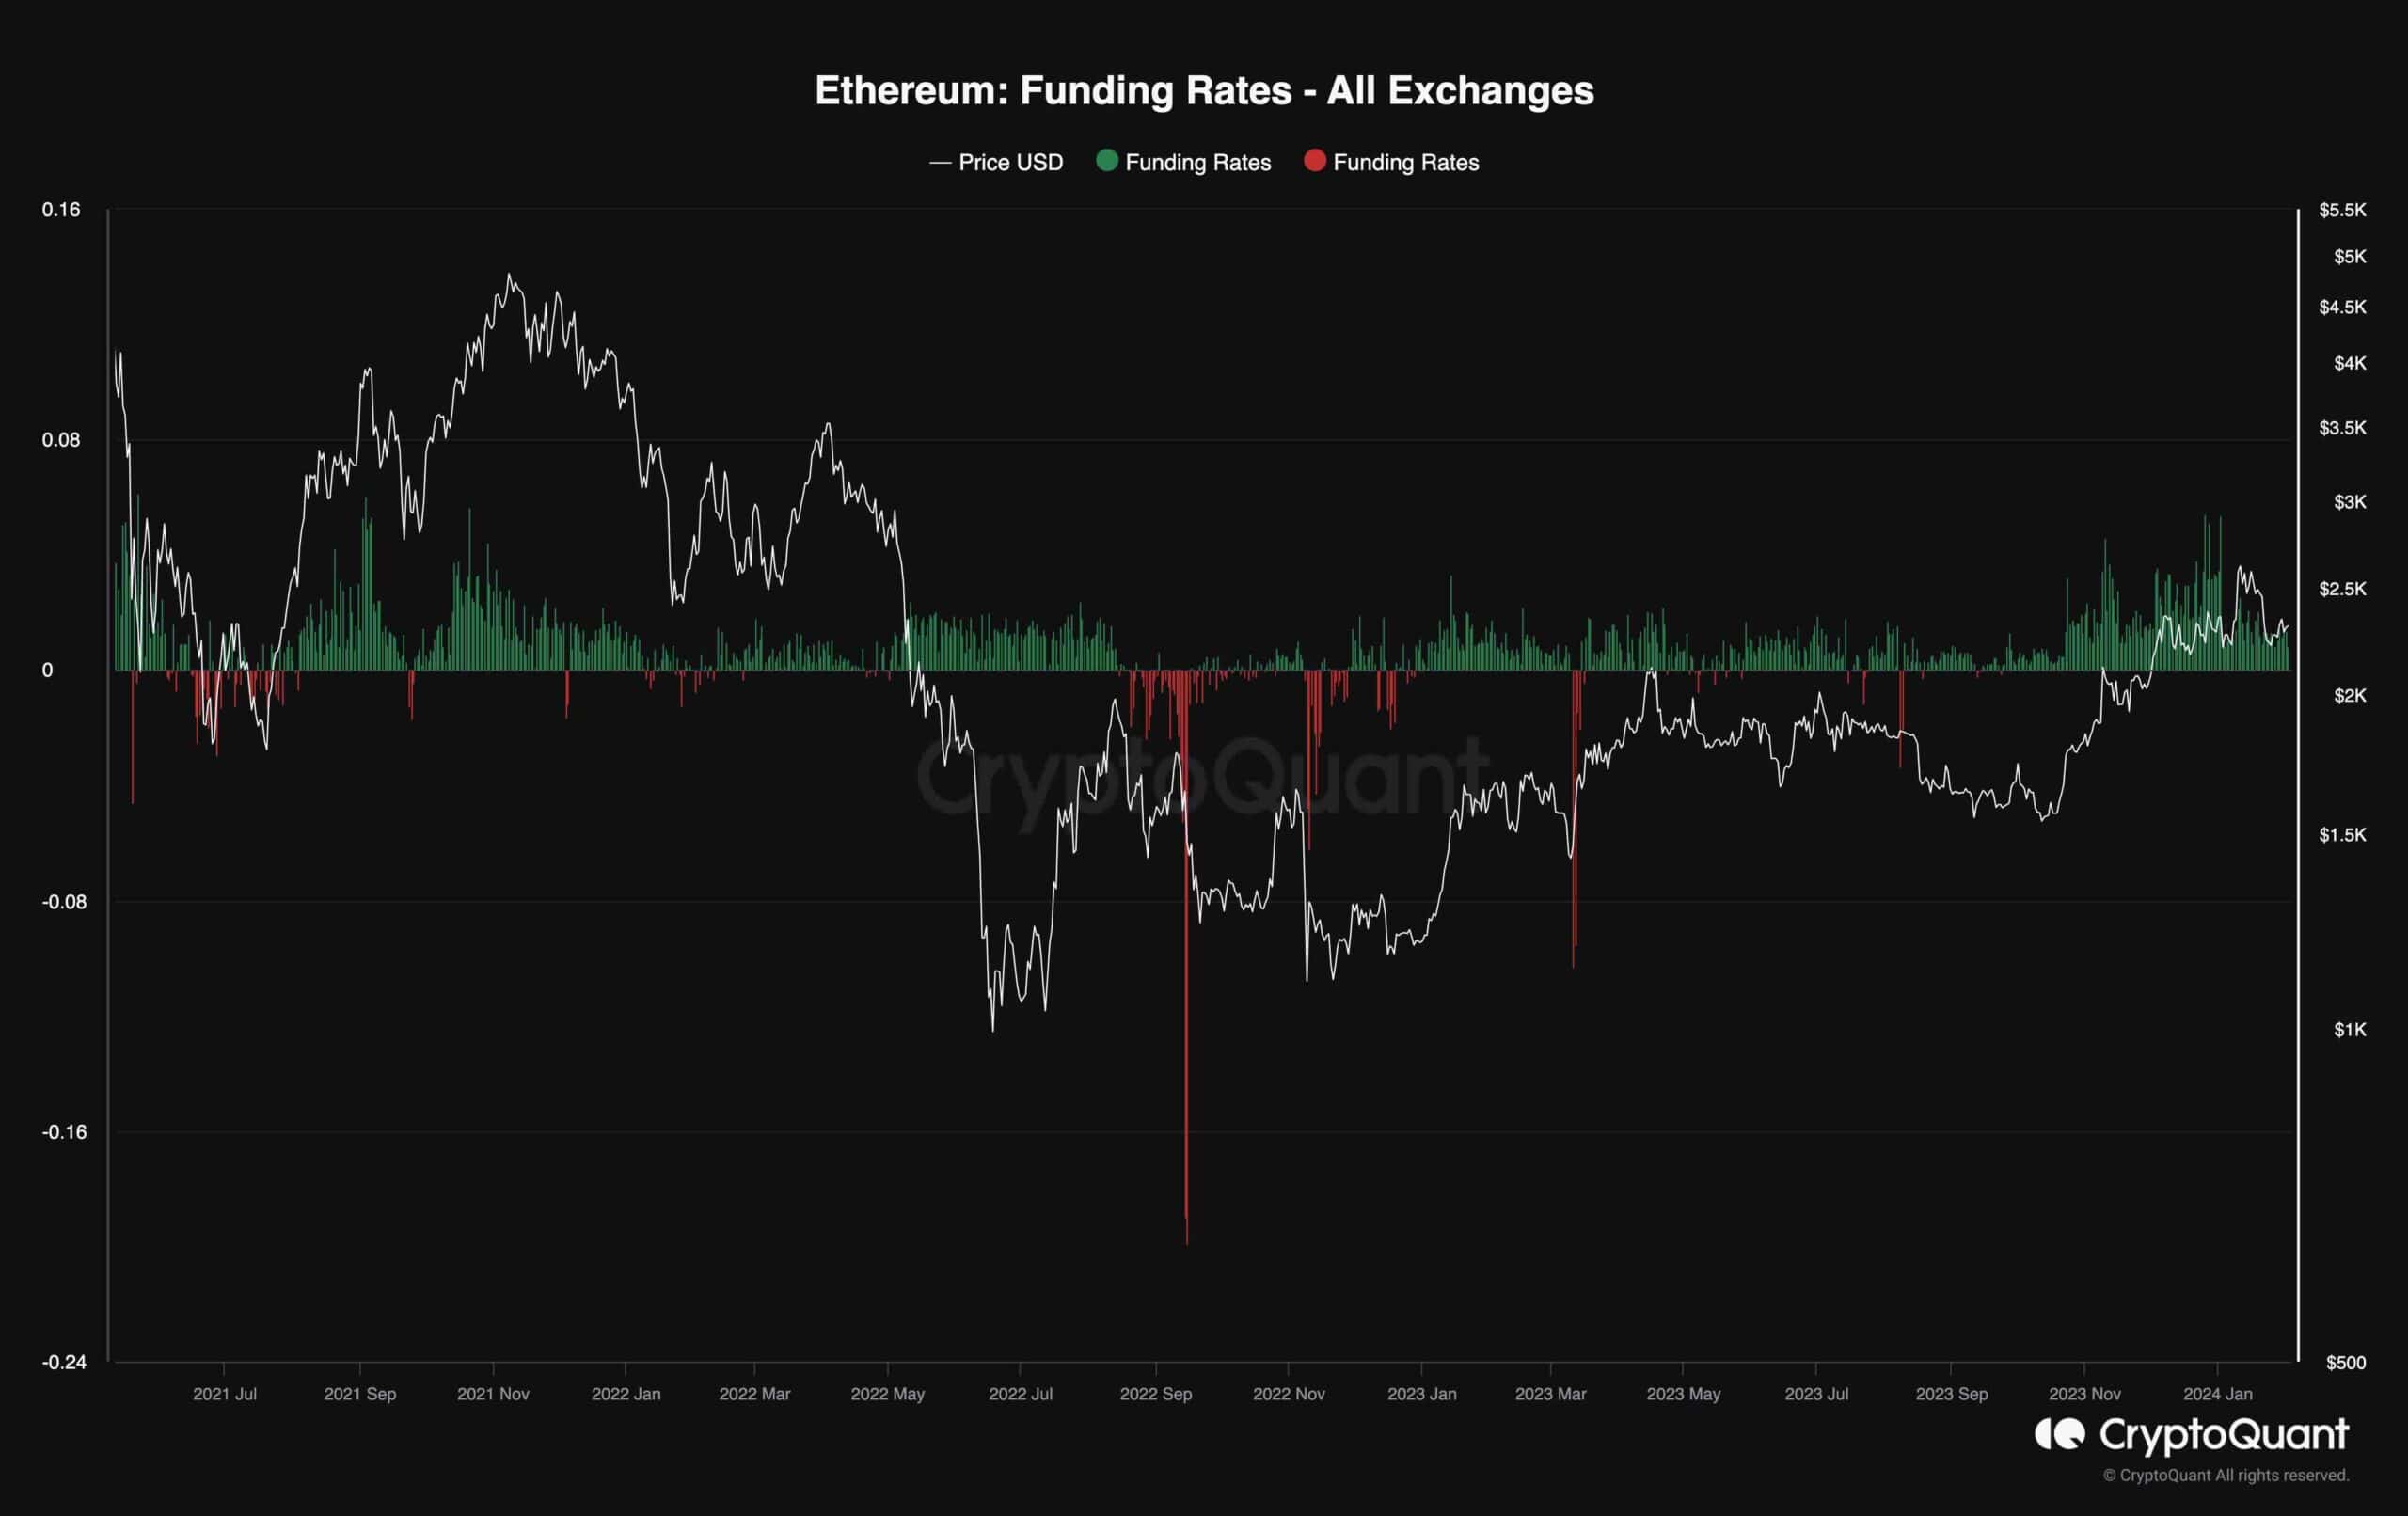
This chart represents the funding rates metric, which is one of the most valuable indicators when it comes to futures market sentiment evaluation. The funding rates demonstrate whether buyers or sellers are more aggressive in executing their orders. Positive values are associated with aggressive buying pressure, while negative values indicate aggressive selling pressure.
Currently, the funding rates are still showing positive values. While not necessarily a bad thing, this is a very similar pattern compared to when the prices crashed from the previous all-time high in 2021. That is because there is still potential for long liquidations on the horizon, which can push the price even lower. So, while things are looking stable at the moment, there is still the possibility of a deeper decline.
The post Alarming Similarities With Previous ETH Patterns Emerge: Will $2.3K Hold? (Ethereum Price Analysis) appeared first on CryptoPotato.
Text source: CryptoPotato


