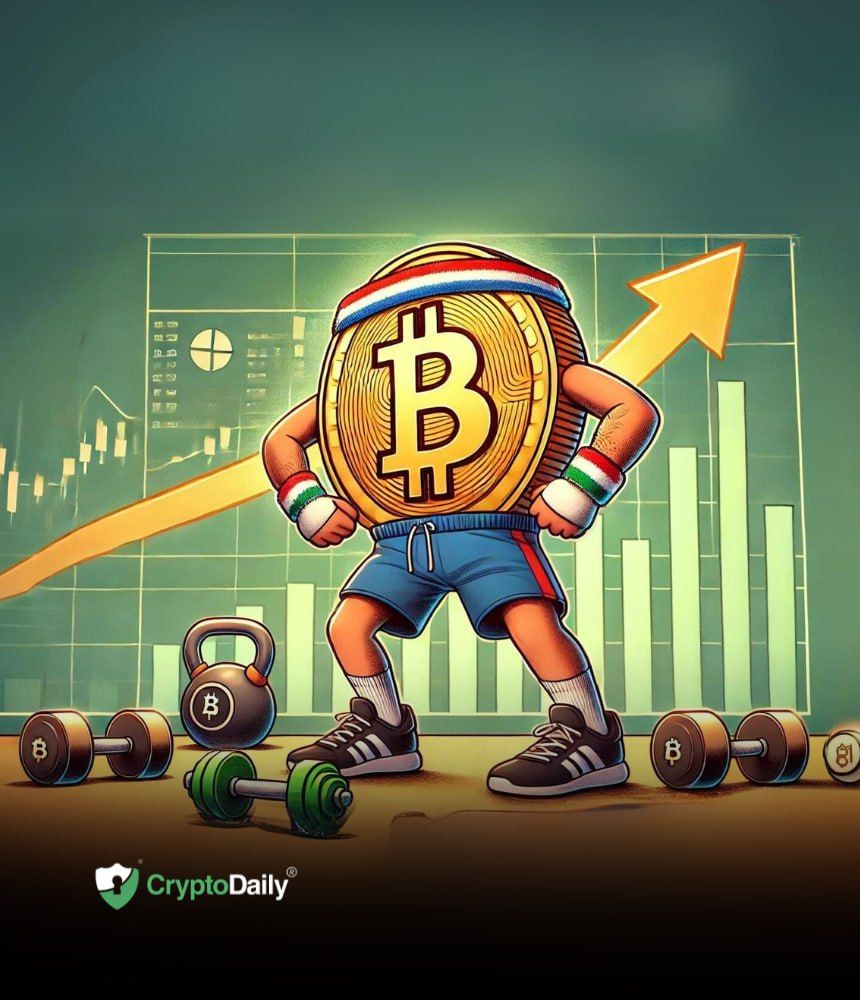
Bitcoin (BTC) shaping up for big price move
Bitcoin (BTC) has been on the verge of blowing through the top of its bull flag on several occasions. However, the price was rejected every time. Will this time be different?
Bitcoin biggest benefactor from global liquidity
According to renowned analyst Lyn Alden, during any 12-month period, Bitcoin has the highest correlation with global liquidity than any other asset. With global liquidity on the rise, as world central banks start to cut interest rates, Bitcoin is very likely to be a big beneficiary.
Alden also sees Bitcoin as one of the best assets for growth over the next few years, and thinks that its market capitalization should eventually surpass that of gold.
First rate cut to be announced later today
Obviously, these are macro predictions, and they may take a while to come to fruition. Meanwhile, in the here and now, Bitcoin has been reacting to the upcoming first rate cut by the U.S. Federal Reserve since early 2020.
The $BTC price has been volatile recently, but this has generally been to the upside. The important horizontal resistance at $58,000 has been reclaimed, and is now support, and macro indicators are pointing to a continuation of this new uptrend.
$BTC battles $61,000 horizontal resistance
Source: TradingView
The short term time frame for $BTC shows that the price is still battling with the $61,000 resistance. In the last small correction, the price did fall below the ascending trend line, but has since managed to regain it.
If $BTC can overcome this resistance, and flip it into support, the next target would be to pass the extremely important $65,000 horizontal level, and make a higher high. If this can take place, the downtrend would be officially broken.
Macro indicators shaping to signal upside momentum
Source: TradingView
As $BTC battles with its resistance, in a bid to break it and rise to the top of the bull flag, two macro indicators are showing early signs that they could signal the momentum that will be needed by the $BTC price, in order to help it do this, and eventually break through the top of the flag and head to $100,000.
The Relative Strength Index (RSI), the uppermost indicator at the bottom of the chart, is displaying that the indicator is just starting to peek through the descending trend line.
At the same time, the Stochastic RSI is showing that both indicator lines are shaping to cross up through the 20 level. If both of these indicators can confirm this bullish activity at close of play this coming Sunday, this could supply all the upside momentum for $BTC for the next few weeks.
Disclaimer: This article is provided for informational purposes only. It is not offered or intended to be used as legal, tax, investment, financial, or other advice.
Read more: https://cryptodaily.co.uk/2024/09/bitcoin-btc-shaping-up-for-big-price-move
Text source: Crypto Daily™


