ETH Slips Toward $1.5K But How Much Lower Can it Go? (Ethereum Price Analysis)
The price of Ethereum has been declining in recent days after being rejected from a significant zone of resistance a couple of weeks ago.
Therefore, it would be useful to analyze the available support levels that could potentially halt the downturn.
Technical Analysis
By: Edris
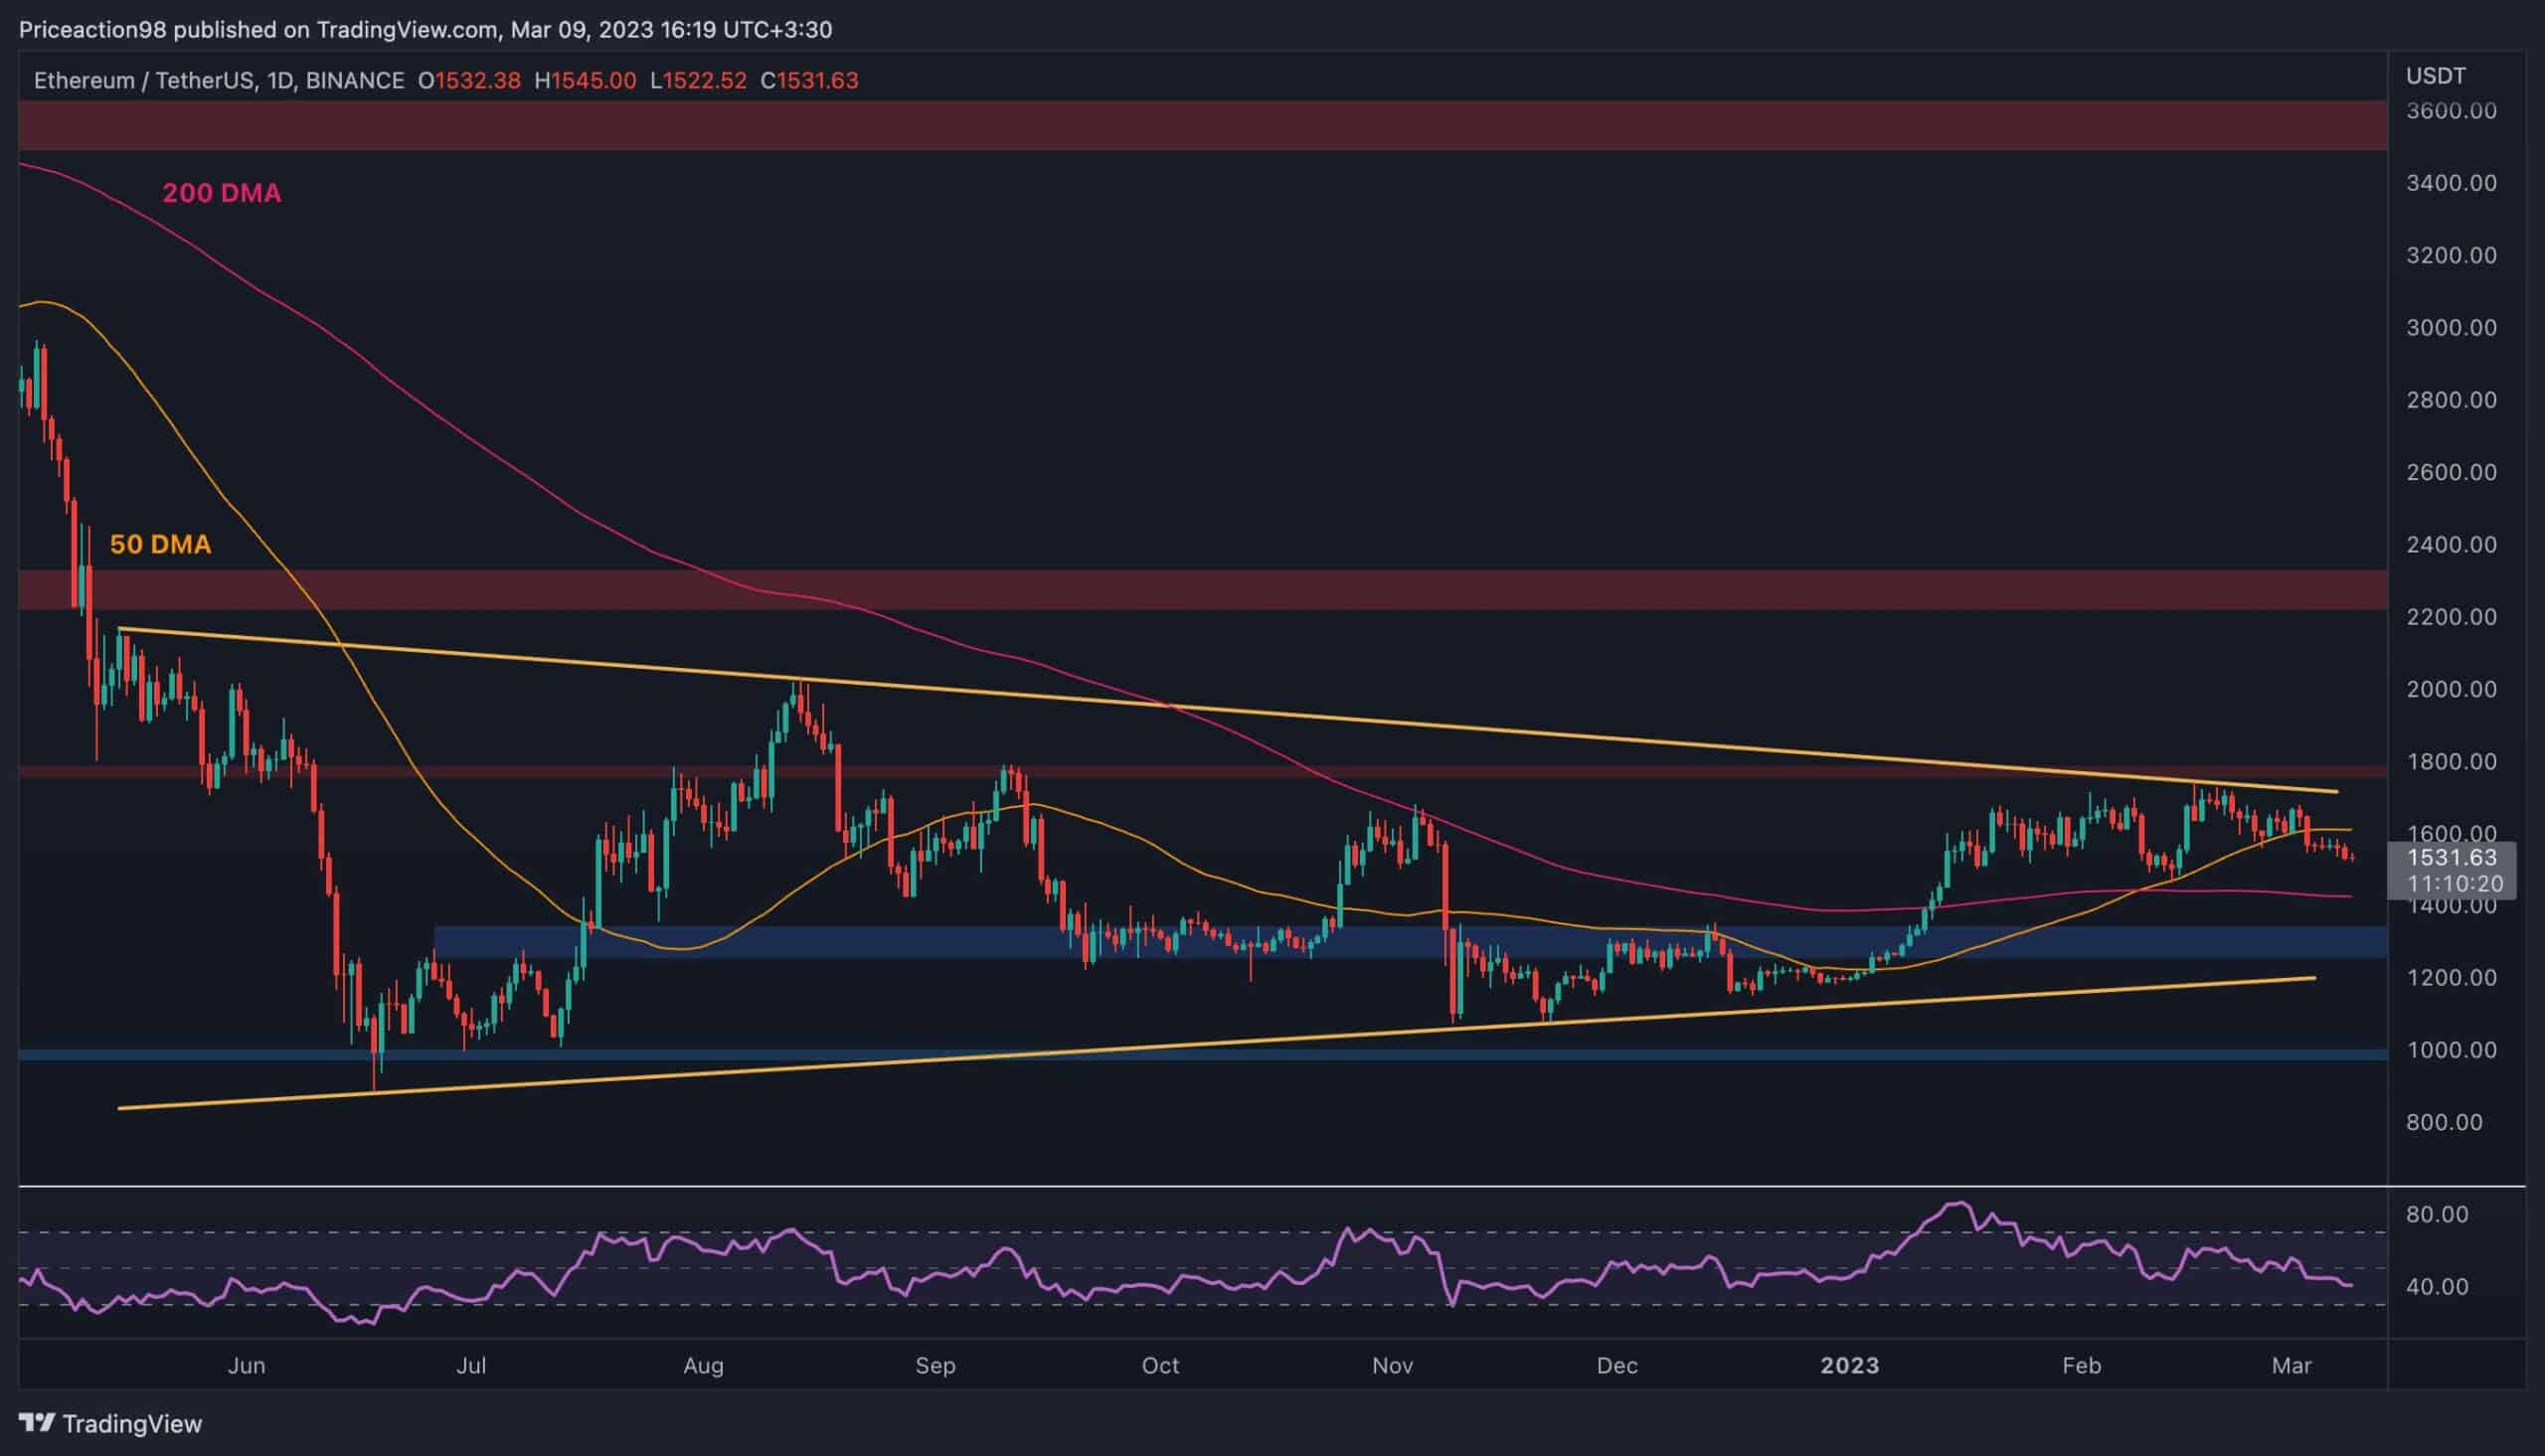
The Daily Chart:
On the daily chart, the price has broken below the 50-day moving average, which is located around the $1600 mark. This took place after a rejection from the key $1800 level and the higher boundary of the large symmetrical triangle pattern.
Currently, the market seems to be targeting the 200-day moving average, which is located around the $1400 price level. If this significant moving average is broken, the price is likely to drop toward the $1300 support level in the short term.
Alternatively, if the price rebounds from the mentioned 200-day ??, the 50-day ?? would now function as a resistance level. This would be followed by the higher boundary of the triangle.
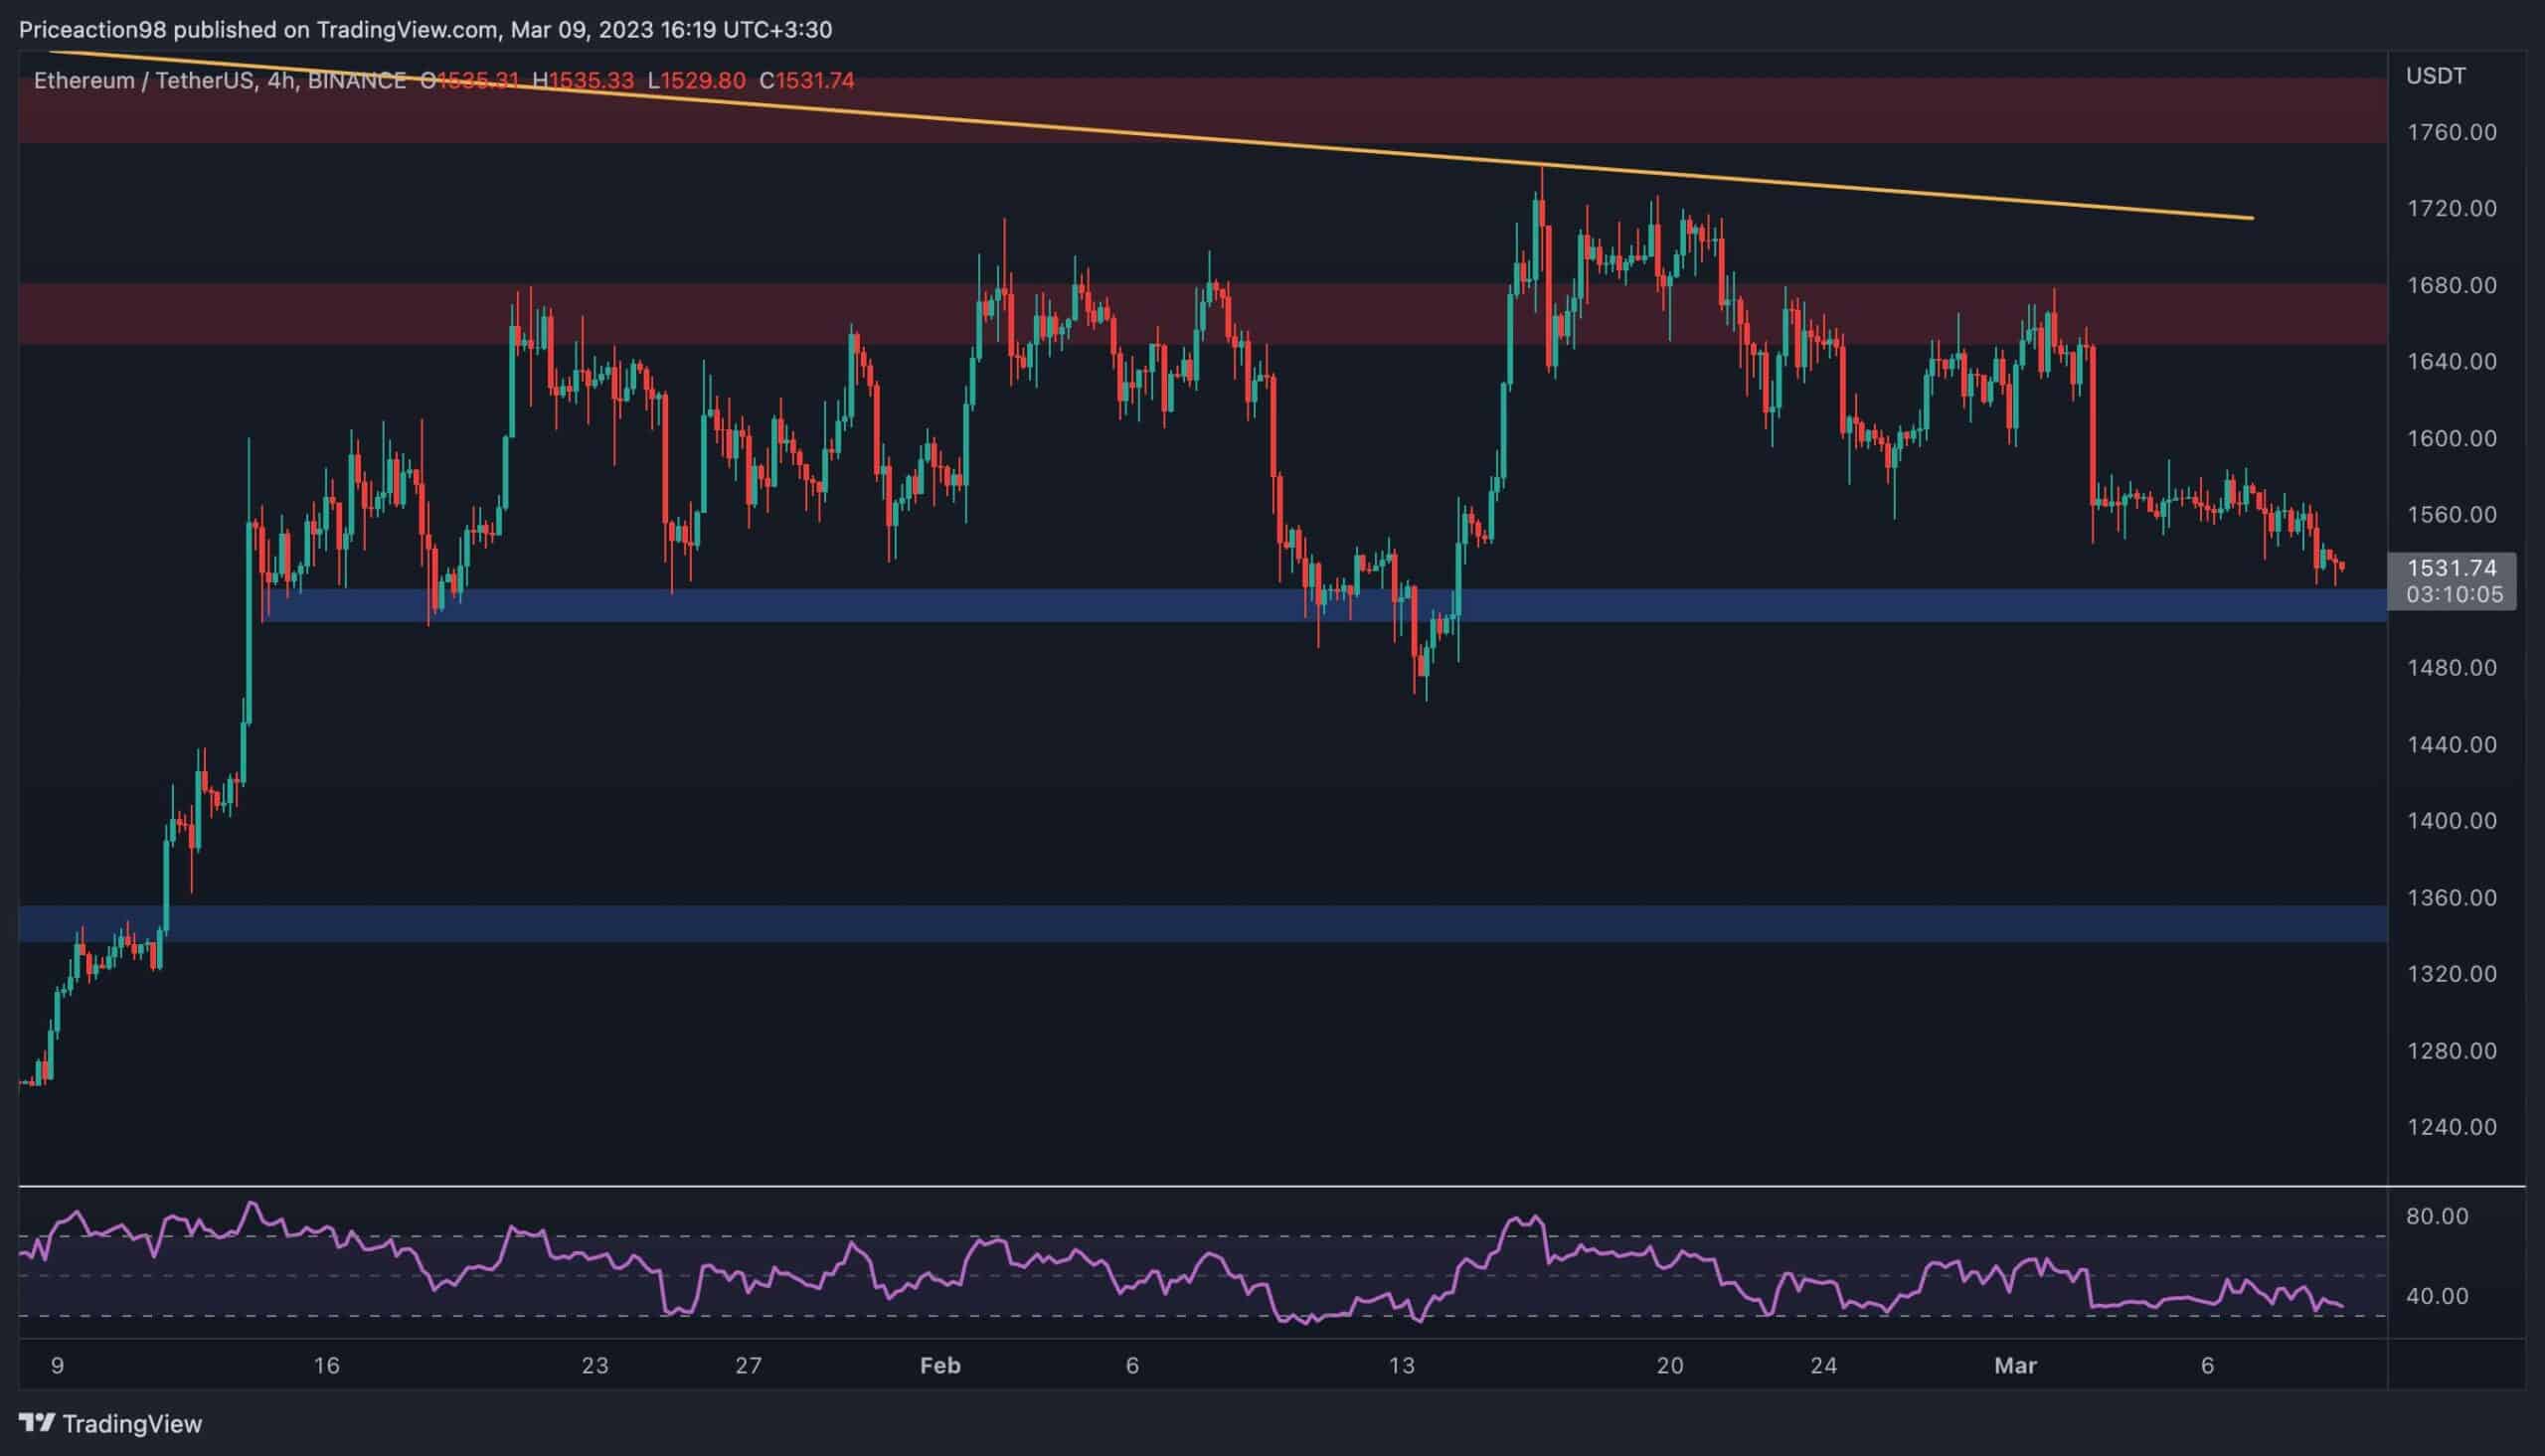
The 4-Hour Chart:
Looking at the 4-hour chart, it’s clear that the price of ETH has been consolidating between the $1680 level and the $1500 area. The $1500 support level will soon be tested, and the short-term future of ETH’s price action will depend on how the price performs there.
If it holds, a rebound and rally toward the $1680 resistance zone will become more likely.
However, if the price breaks below the $1500 level, a further drop toward the $1350 area would be the most probable outcome in the coming days. Additionally, the RSI indicator is currently showing values below 50%, indicating that the bears are in control of the market.
Onchain Analysis
By Shayan
The Active Addresses metric provides an outlook of Ethereum’s demand side, presenting the total number of unique active addresses, including senders and receivers. The metric has been in a downtrend during the bearish cycle of the market, indicating a decreasing demand.
However, a downtrend in Active addresses is typical during the capitulation stages of the market. The metric has recently dropped to a new yearly low, showing that the demand is not enough to call the bear market over. Hence, the market requires more activity to start a healthy bullish cycle.
The post ETH Slips Toward $1.5K But How Much Lower Can it Go? (Ethereum Price Analysis) appeared first on CryptoPotato.
Read more: https://cryptopotato.com/eth-slips-toward-1-5k-but-how-much-lower-can-it-go-ethereum-price-analysis/
Text source: CryptoPotato


