Ethereum Poised to Retest $3.5K as Bullish Sign Reappear (ETH Price Analysis)
After experiencing a rapid downturn, Ethereum has found itself supported by a substantial zone, comprising the 100-day moving average and a critical price range between the 0.5 and 0.618 Fibonacci levels. Consequently, a bullish rebound is anticipated in the medium term.
Technical Analysis
By Shayan
The Daily Chart
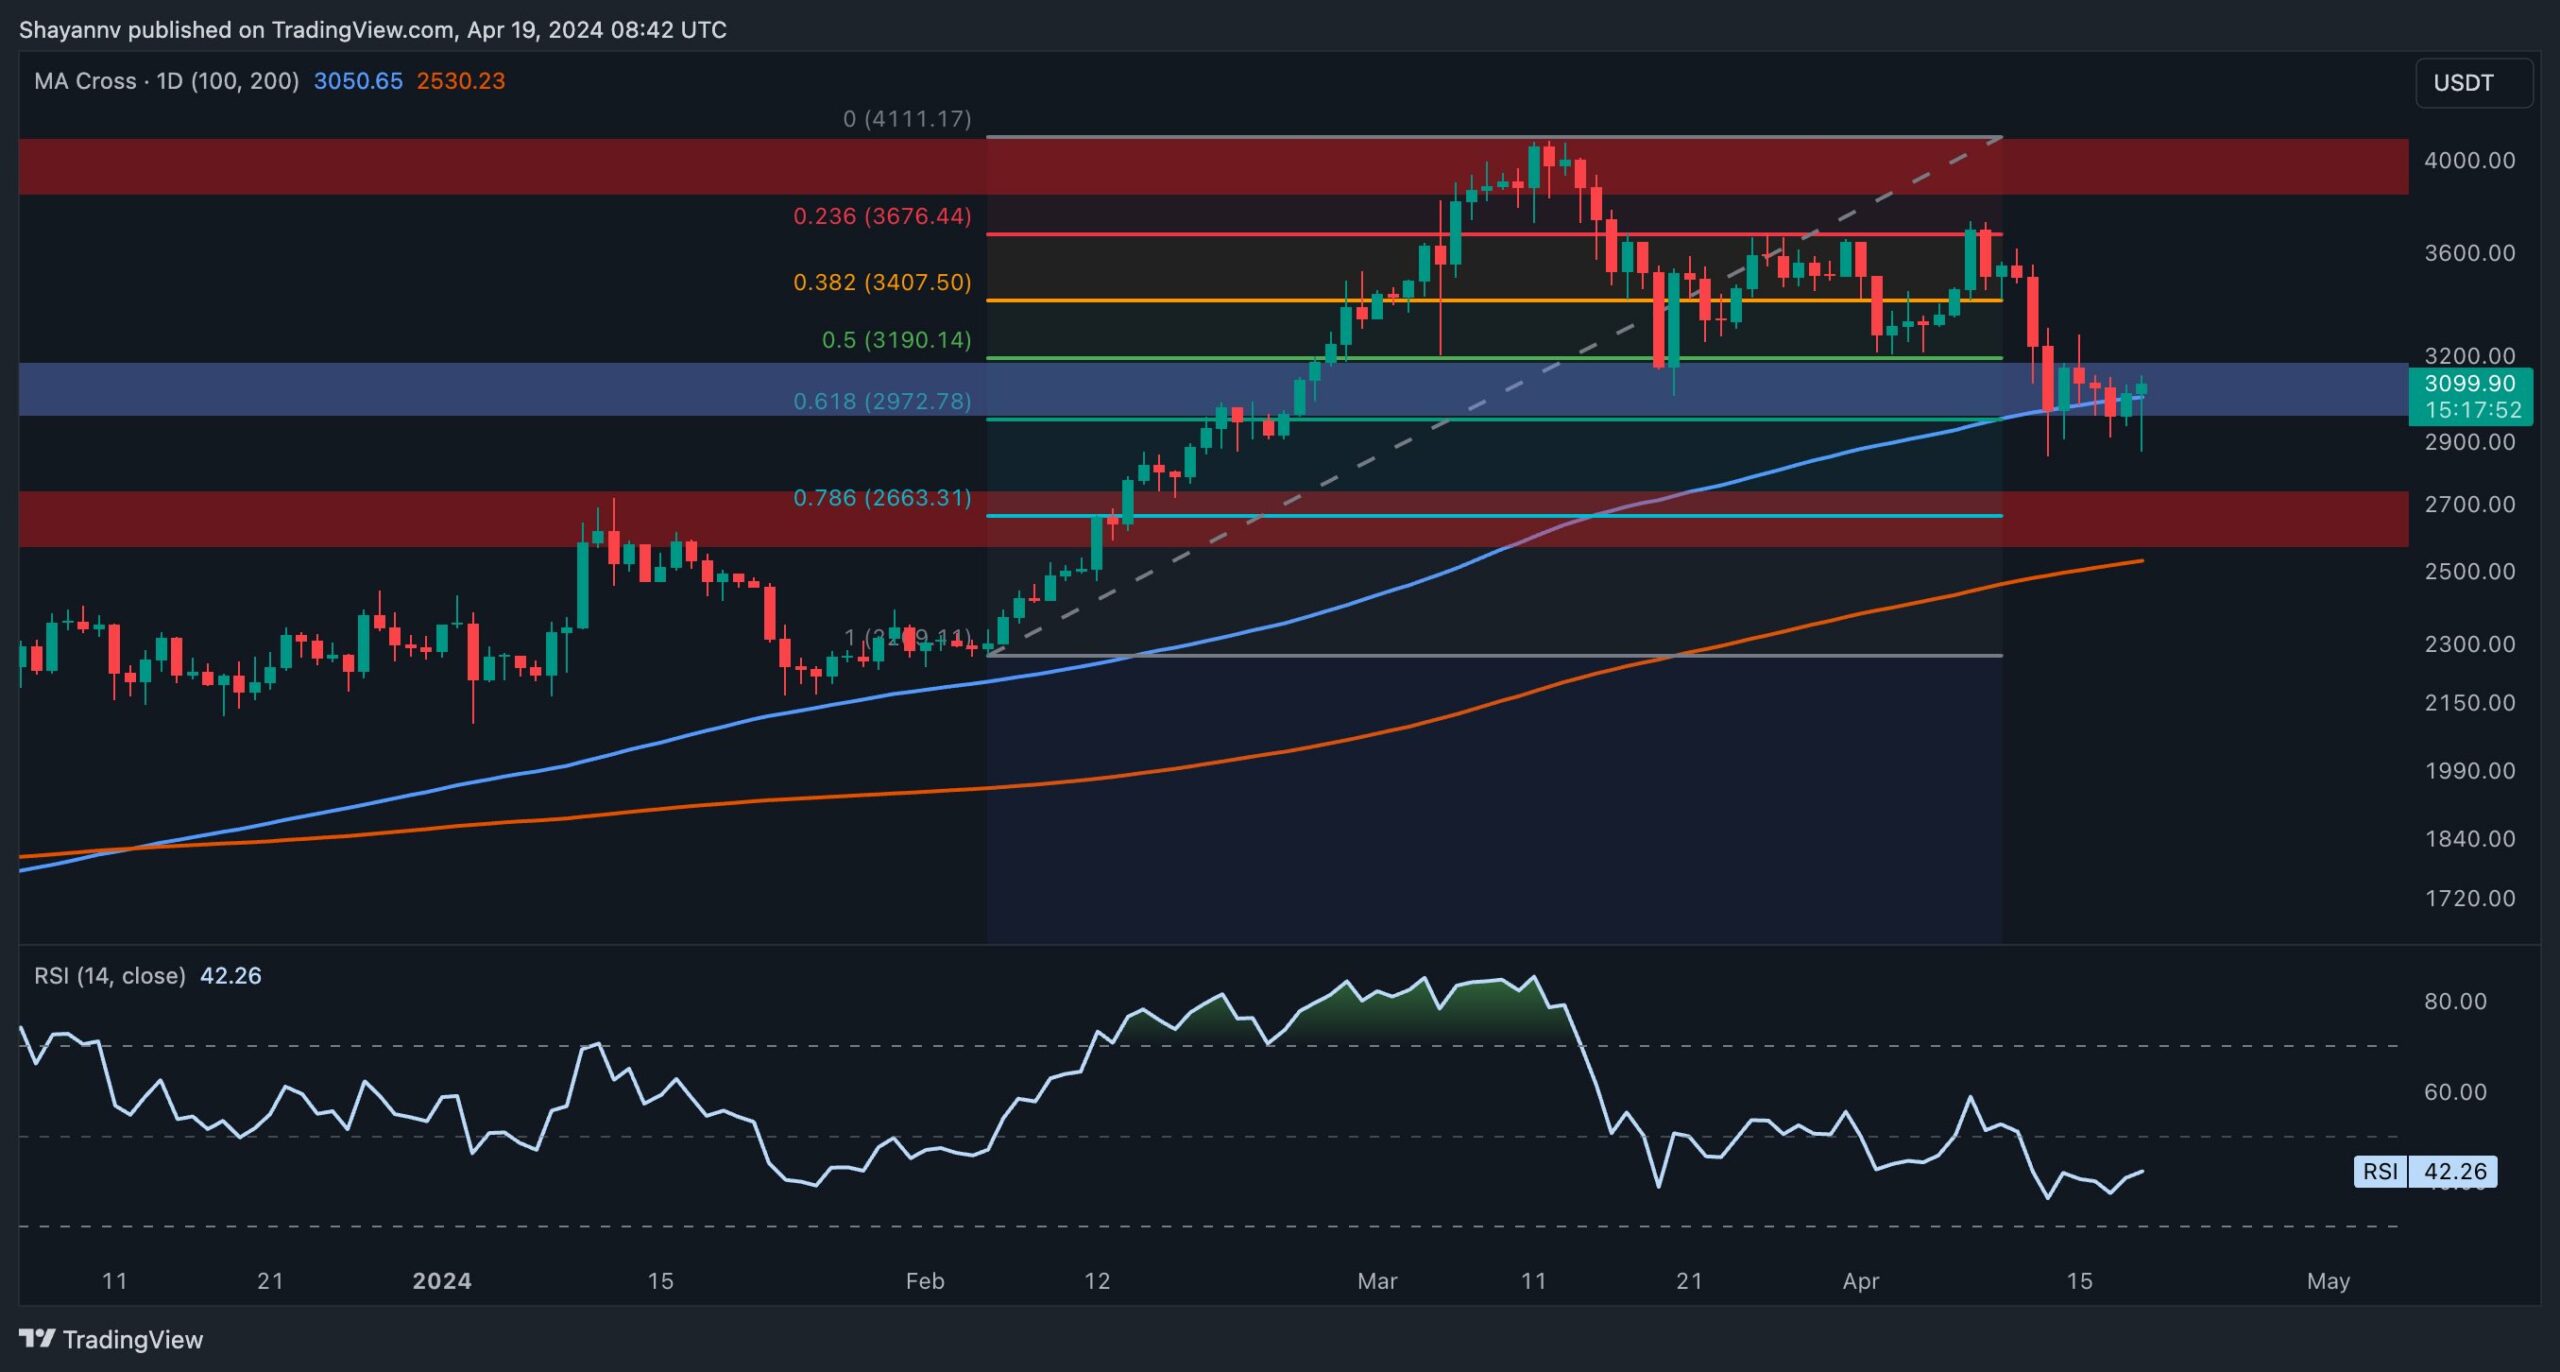
A thorough examination of the daily chart reveals an extended period of corrective retracements, culminating in the price finding support within a pivotal zone.
This zone encompasses the 100-day moving average at $3050 and the significant price range between the 0.5 ($3190) and 0.618 ($2972) Fibonacci levels.
This range carries significance as it attracts considerable demand, potentially hindering further downward pressure from market sellers. Additionally, a minor bullish divergence between the price and the RSI indicator suggests the potential for a bullish resurgence, targeting a reclaim of the $3.5K threshold. However, despite the bullish indications, an unexpected breach below this critical support zone could trigger a cascade effect toward the 200-day moving average at $2.5K.
The 4-Hour Chart
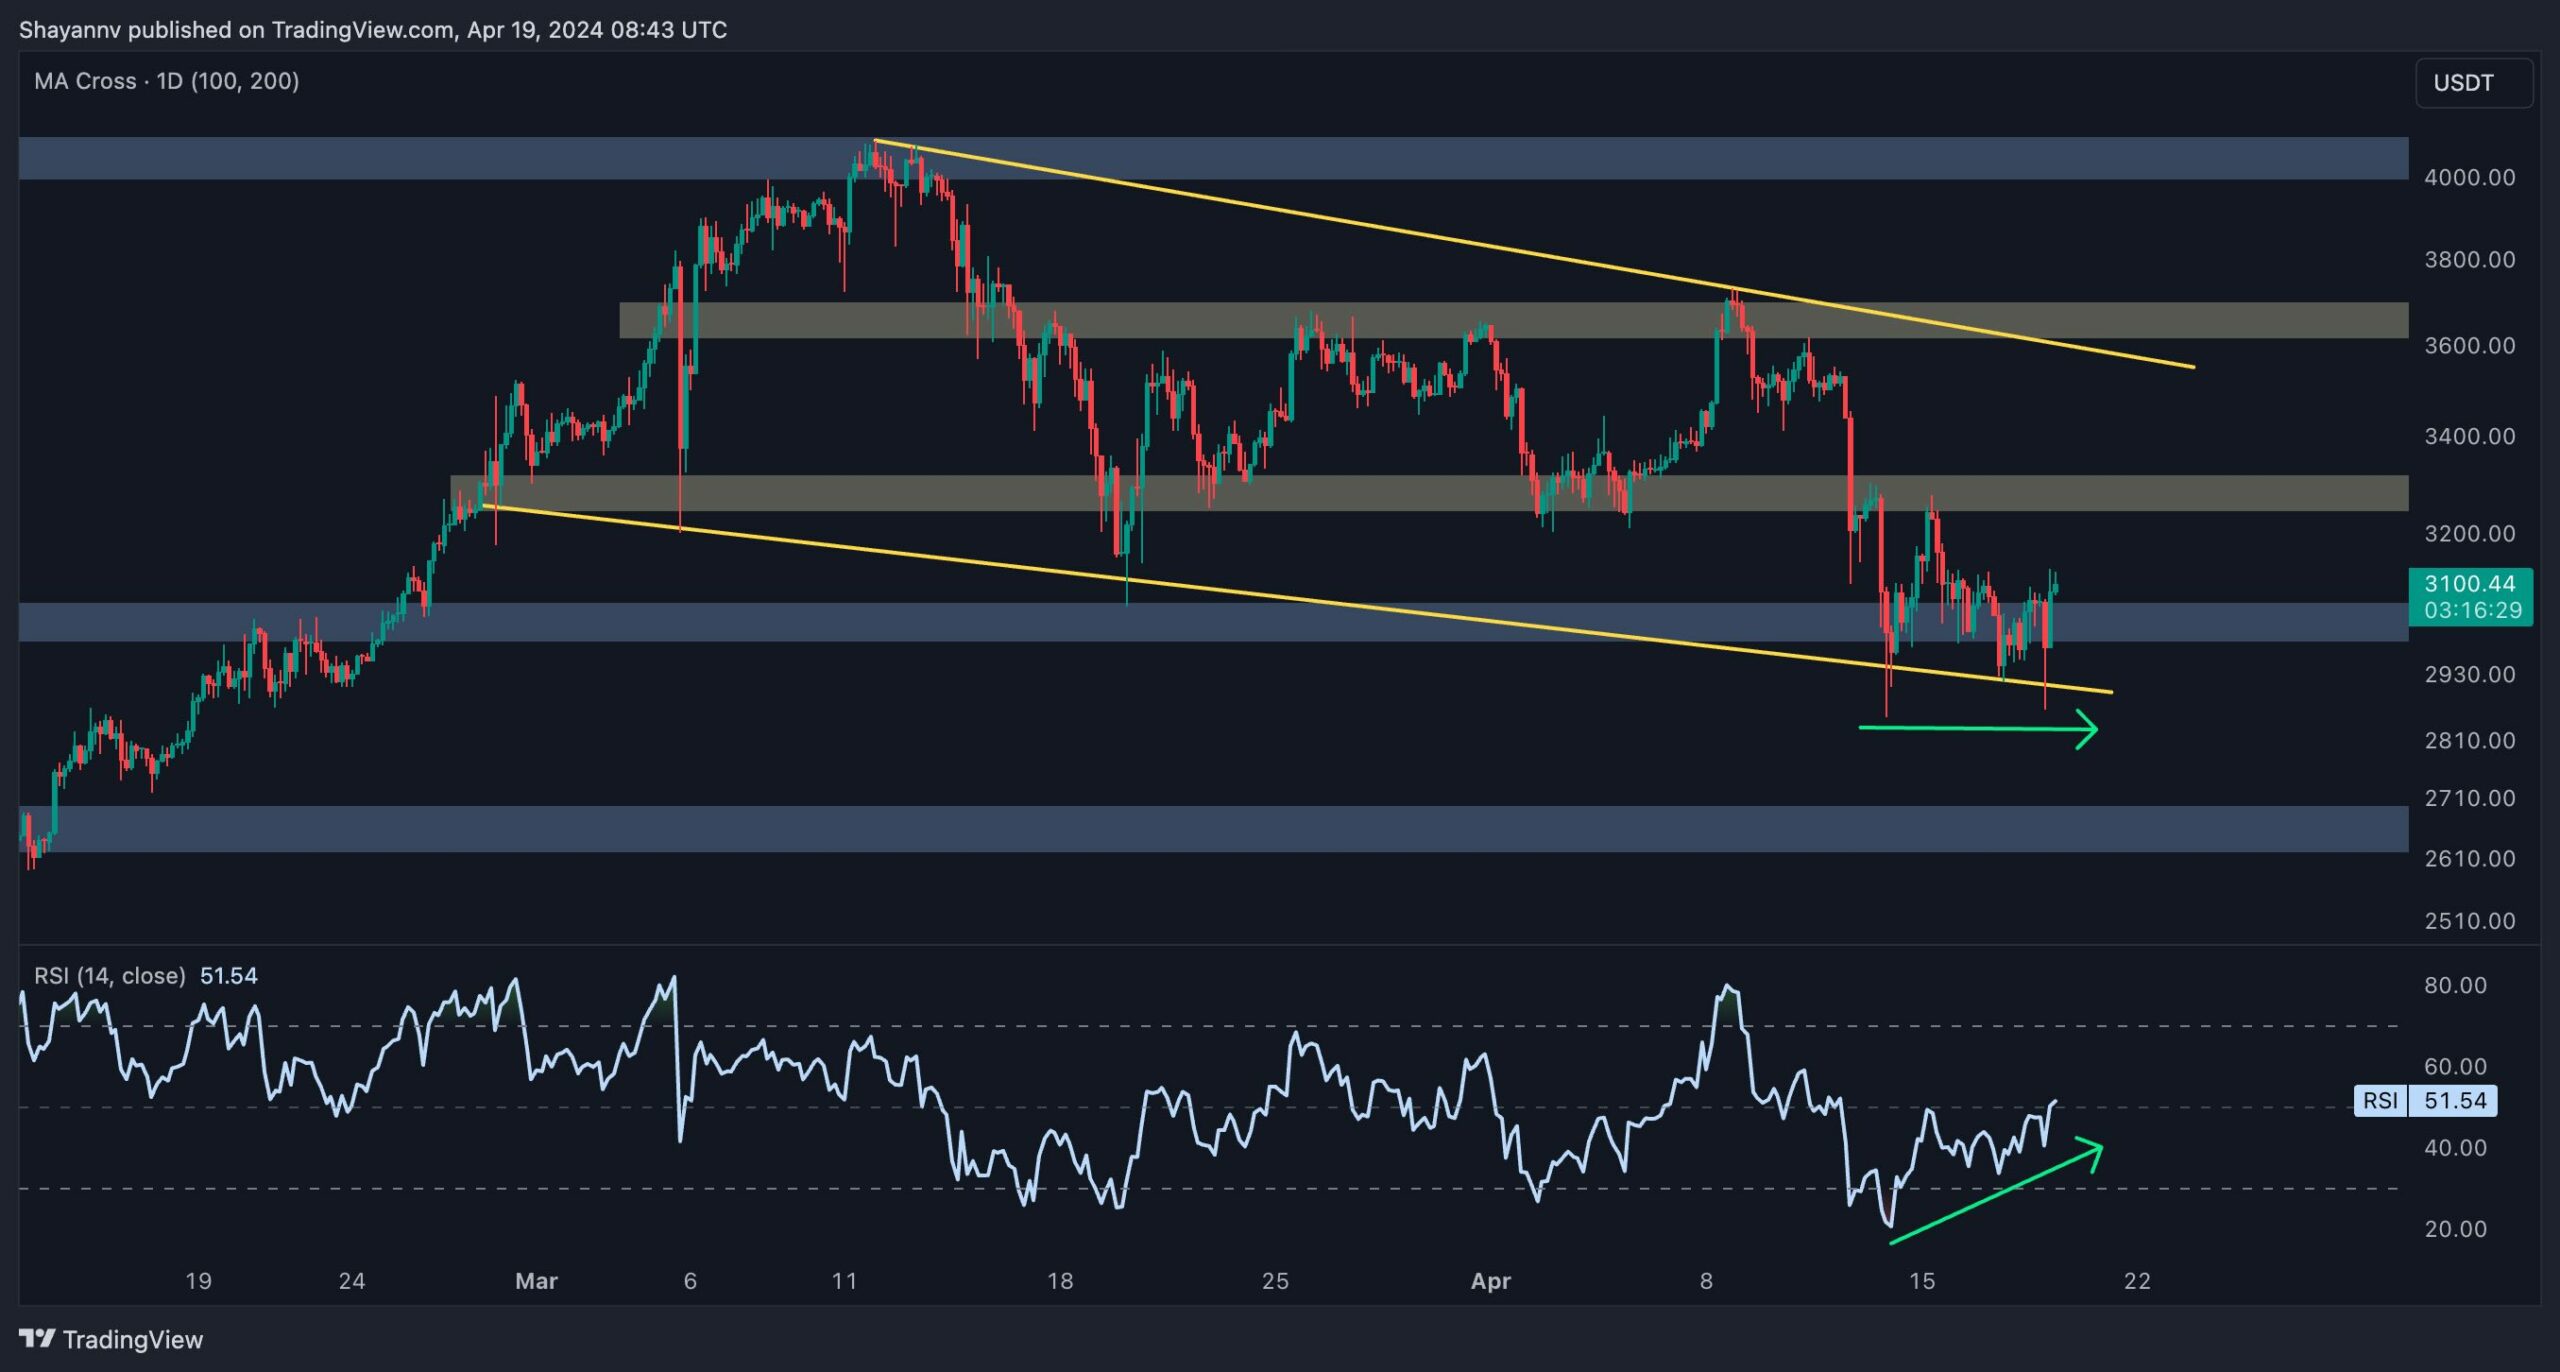
A closer inspection of the 4-hour chart reveals the formation of a descending wedge pattern during a multi-month consolidation correction. Following a significant decline, the price has reached the lower boundary of the wedge and the support region around $3K.
Nonetheless, given the potential buying pressure within this crucial range, the price has entered a consolidation phase characterized by minimal volatility.
This price action highlights a tug-of-war between buyers and sellers. Nevertheless, a noticeable divergence between the price and the RSI indicator on the 4-hour timeframe suggests the strength of buyers, increasing the likelihood of a bullish upswing in the medium term. In such a scenario, the next target for the price would be the critical resistance level at $3.5K. Conversely, should a break below this support occur, a descent toward the $2.7K support becomes increasingly probable.
Sentiment Analysis
By Shayan
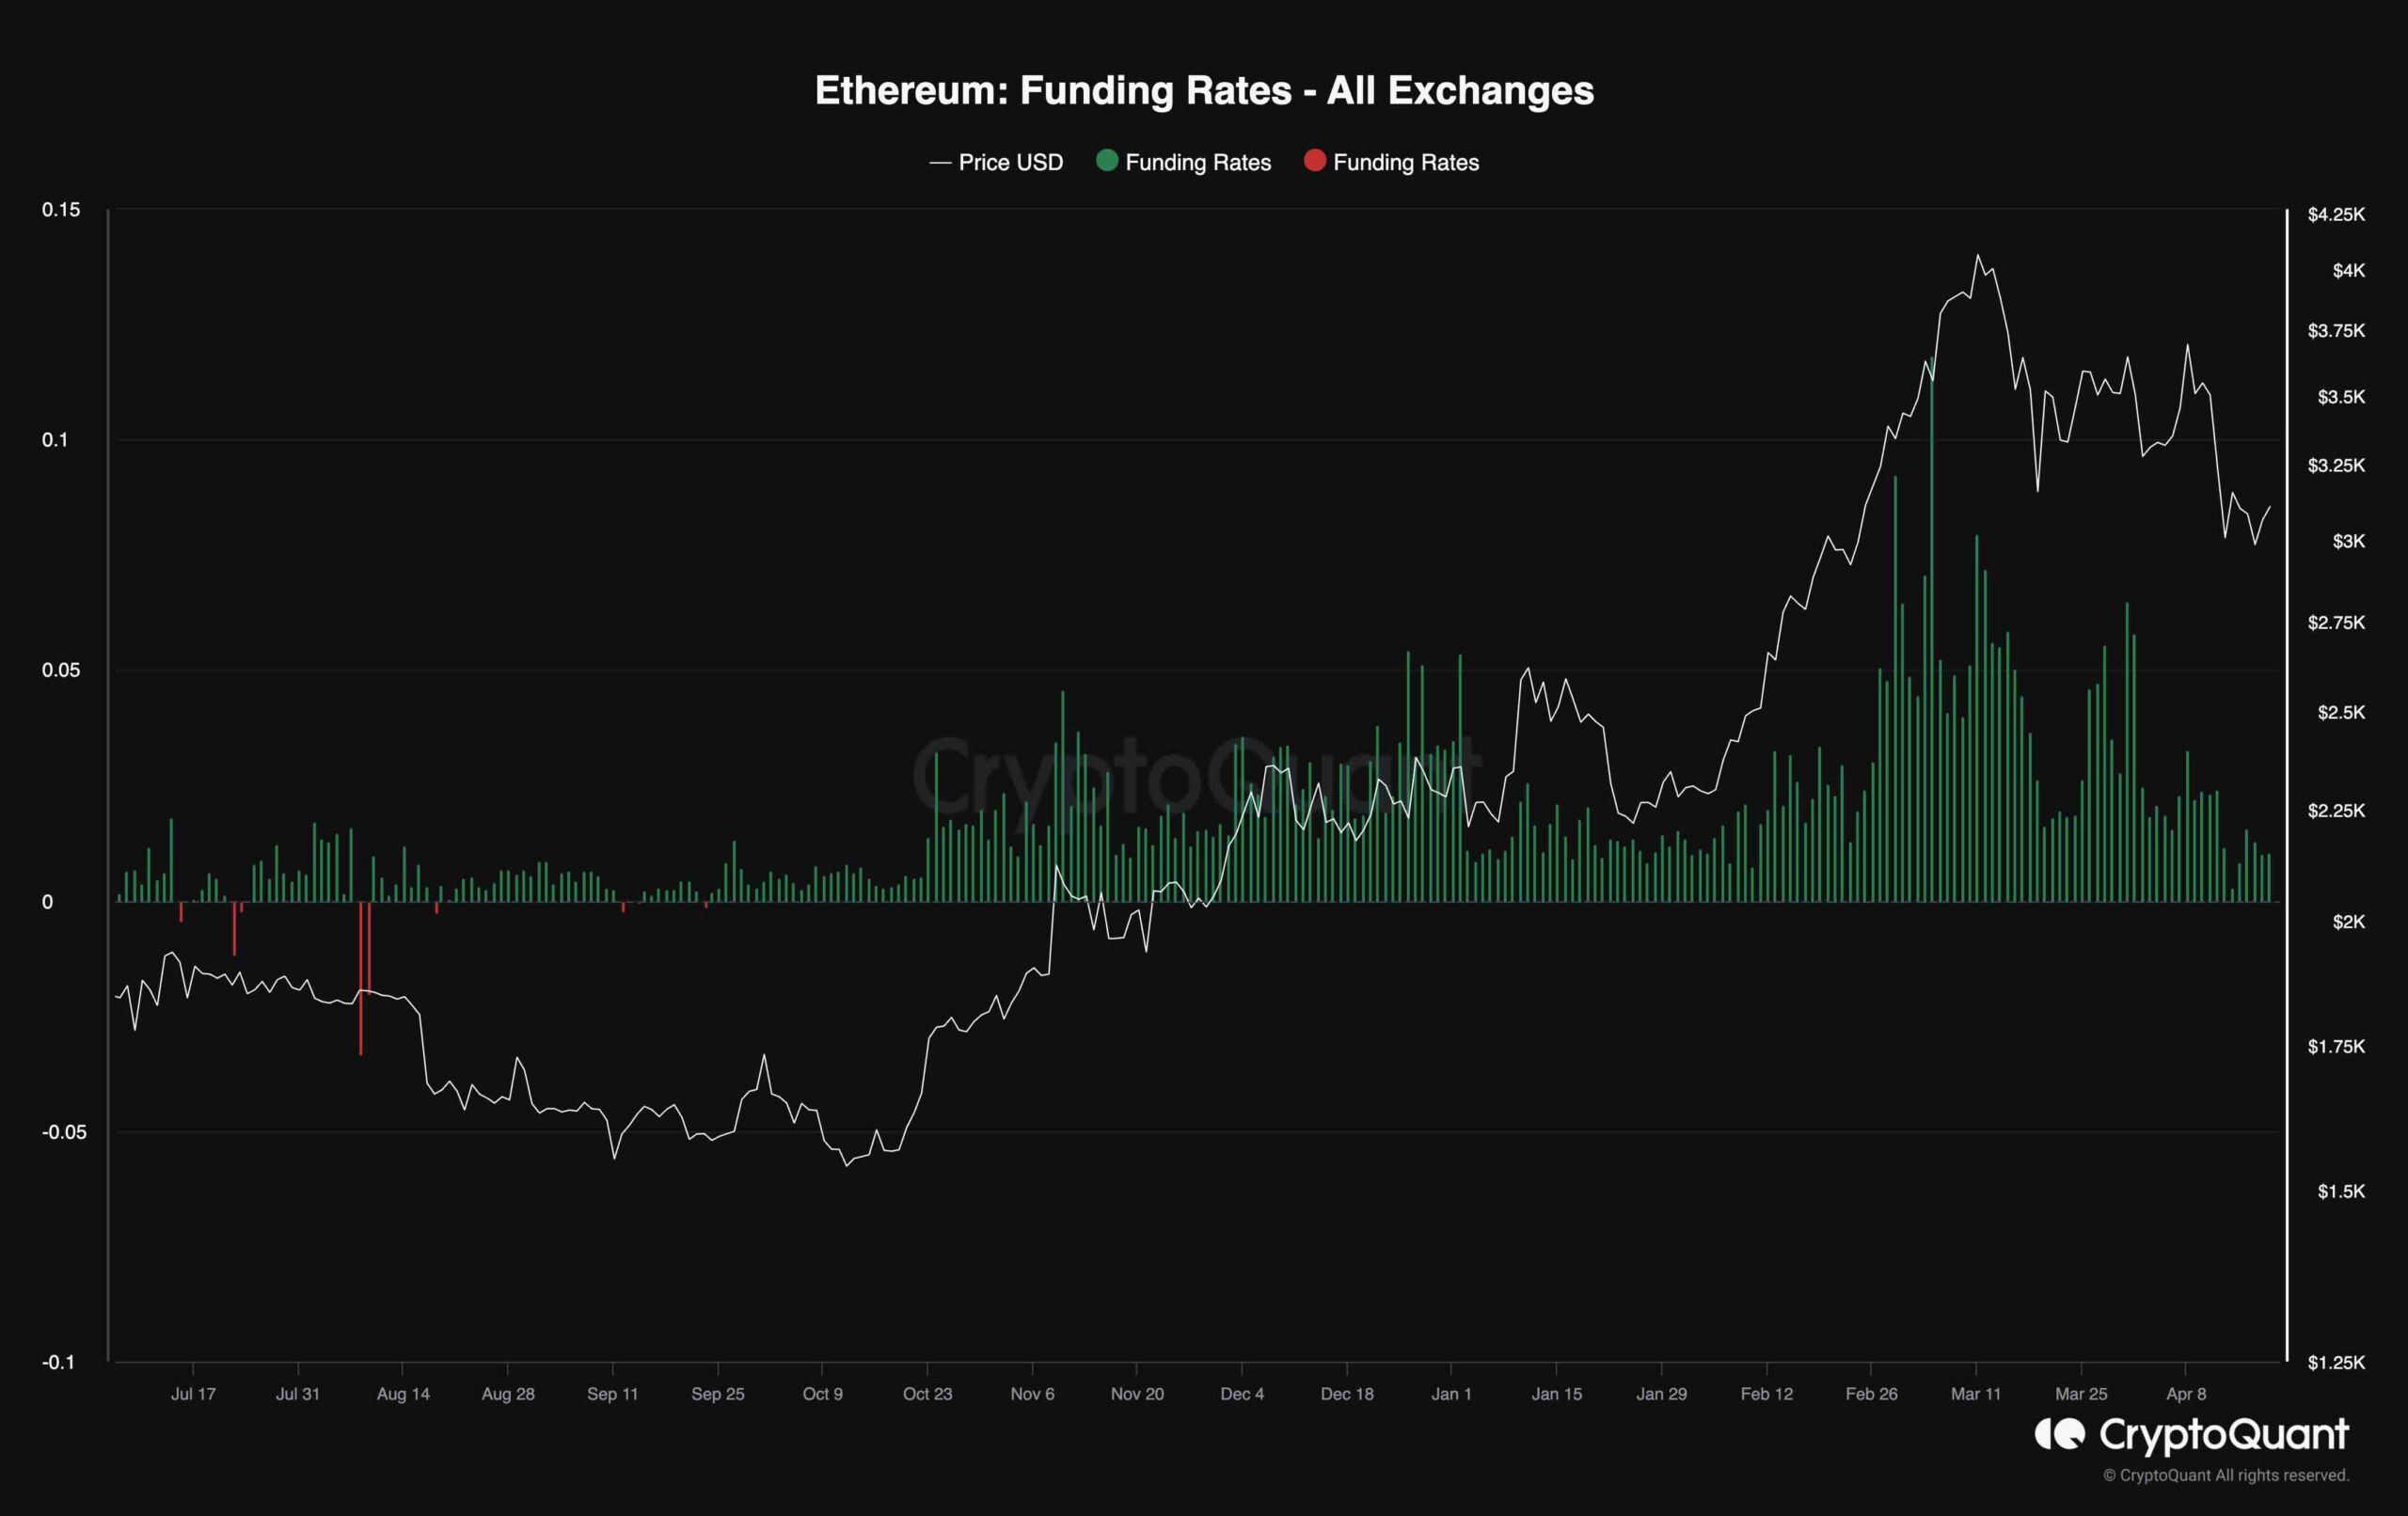
As Ethereums price exhibits signs of recovery, its crucial to determine whether this resurgence stems from spot buying or leveraged futures activity. A key metric for this analysis is the funding rates, where positive values signify bullish sentiment and negative values indicate fear in the market.
Observing the recent downtrend in Ethereums price, its notable that the funding rate metric has mirrored this trajectory, steadily declining until reaching near-zero levels. This alignment suggests that the recent price drop has led to the liquidation of a significant number of positions in the perpetual market, resulting in a cooling effect on the futures market. Consequently, the market appears primed for the re-emergence of long positions, with the potential for a fresh upward surge.
The post Ethereum Poised to Retest $3.5K as Bullish Sign Reappear (ETH Price Analysis) appeared first on CryptoPotato.
Read more: https://cryptopotato.com/ethereum-poised-to-retest-3-5k-as-bullish-sign-reappear-eth-price-analysis/
Text source: CryptoPotato


