Ethereum Price Analysis: Has ETH Hit the Bottom or Is More Downside Ahead?

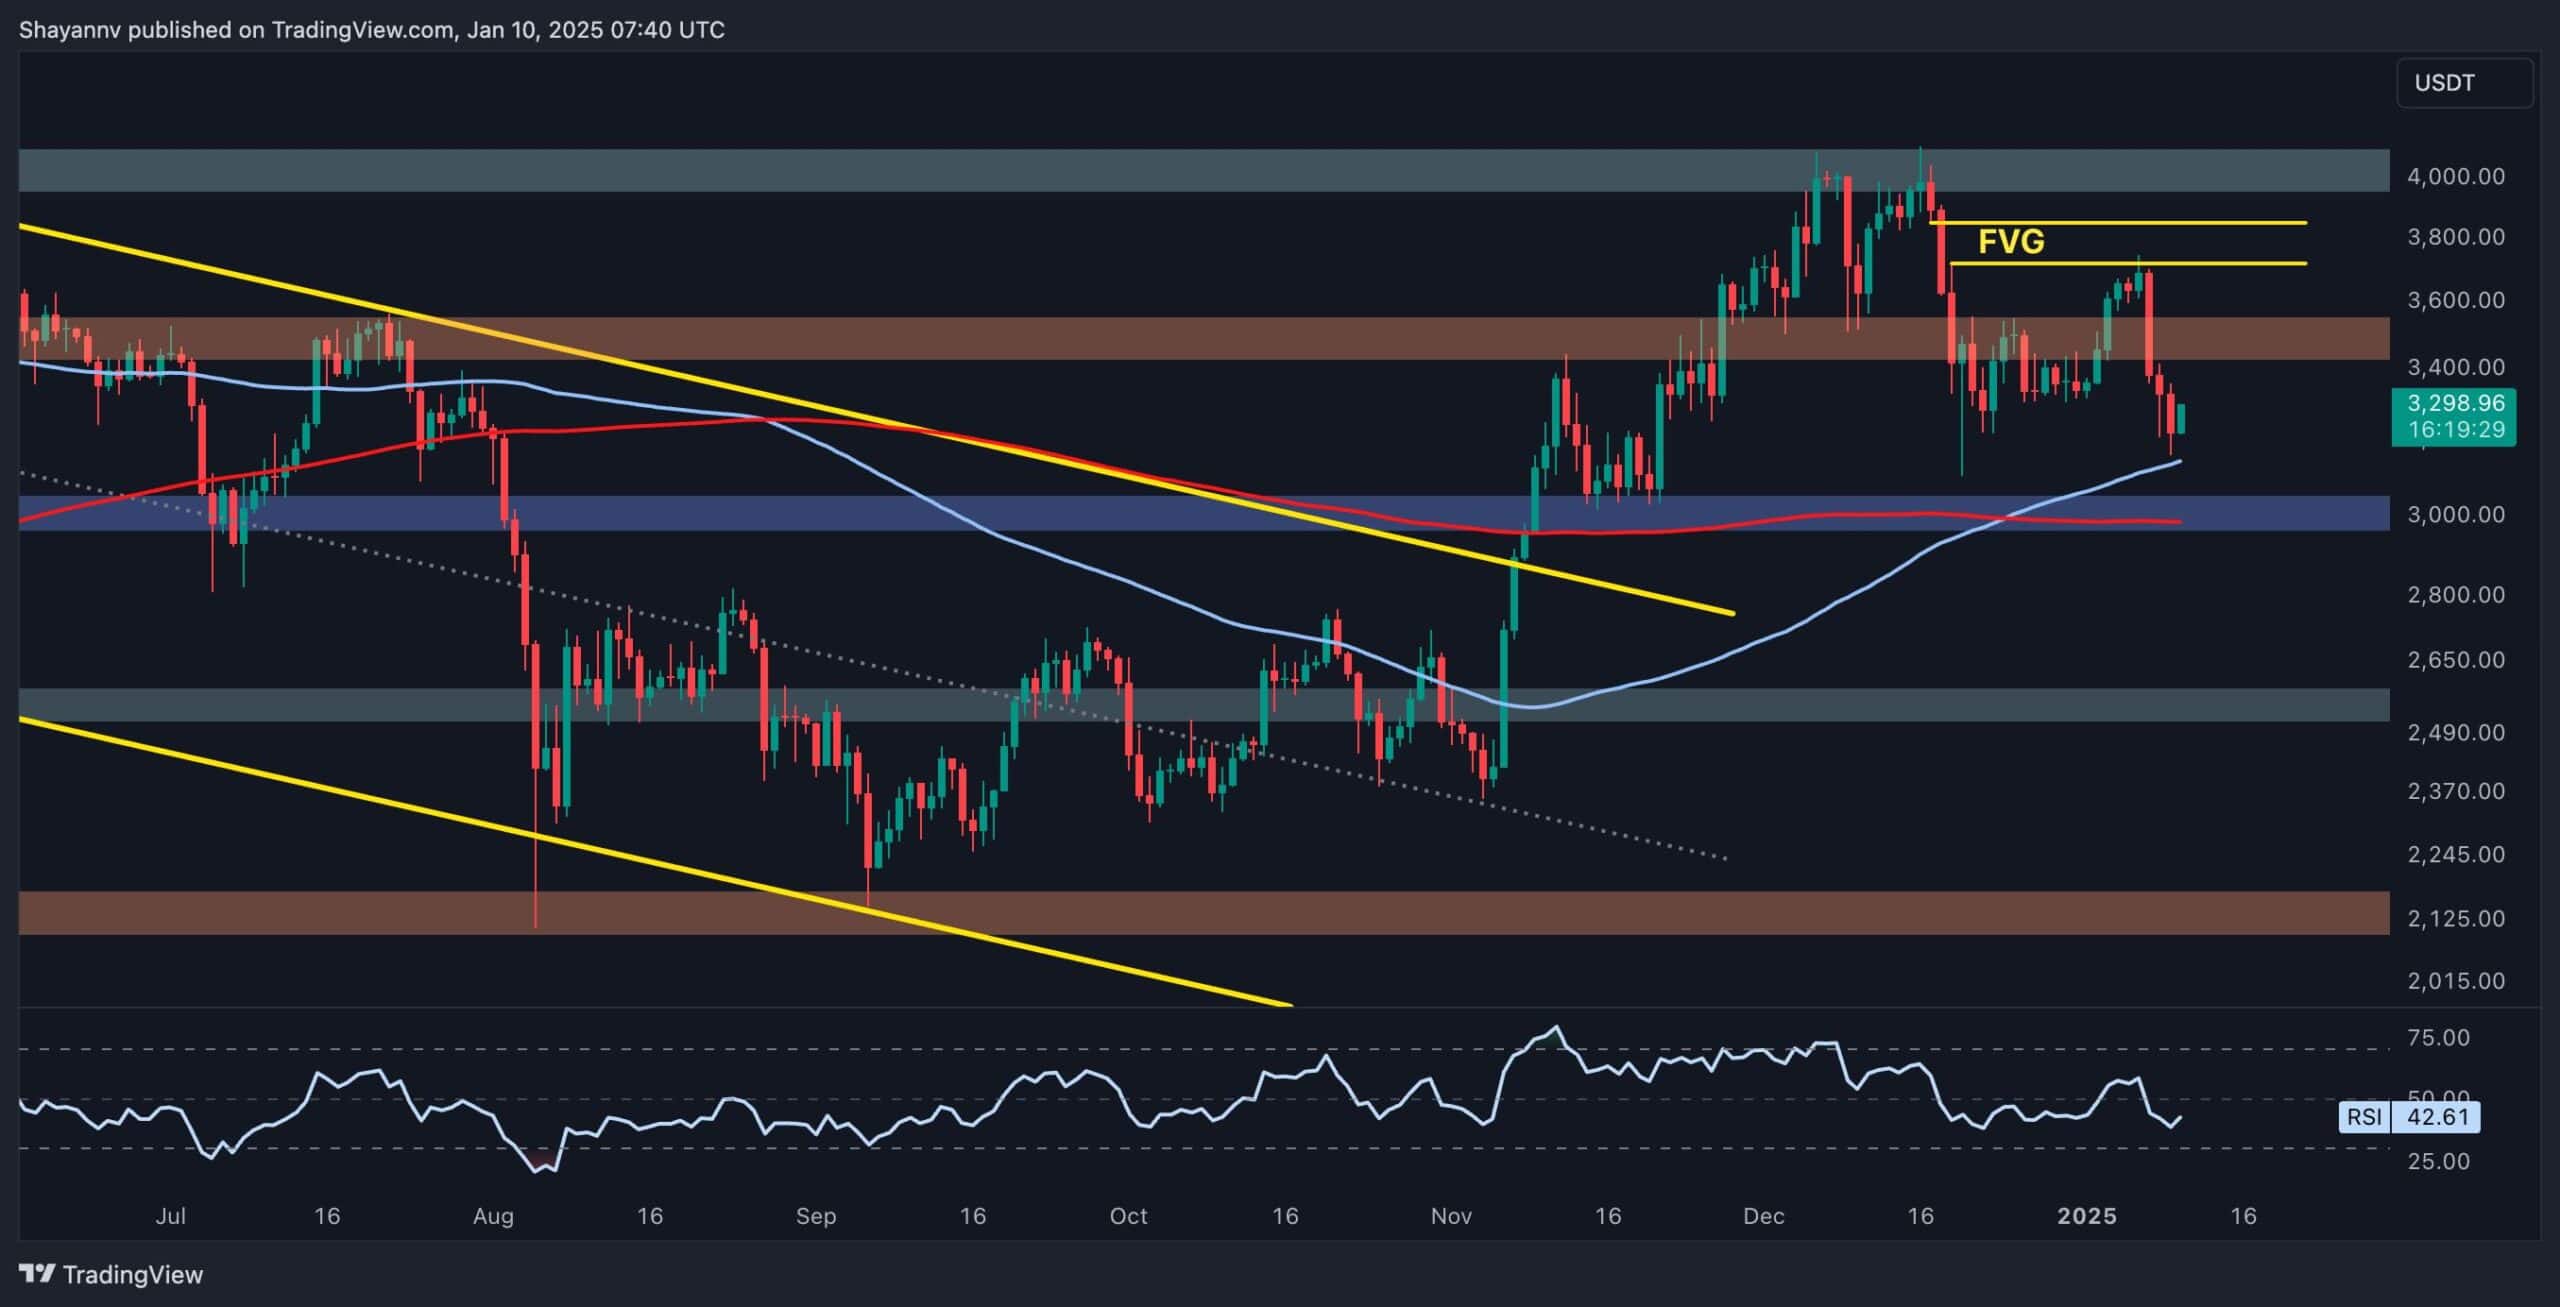
Ethereums price has experienced a sharp decline following increased selling activity, reaching the decisive 100-day moving average at $3.1K.
This level represents a crucial support zone and a potential inflection point for the cryptocurrencys next move.
Technical Analysis
By Shayan
The Daily Chart
Ethereums bearish momentum has driven its price to the 100-day moving average at $3.1K, a significant and psychological support region. This level is anticipated to provide notable demand as it coincides with key technical indicators. However, the selling pressure has underscored the dominance of bearish sentiment, leaving the market in a precarious position.
If Ethereum manages to hold above this support, it could prompt a bullish rebound, easing concerns of further declines. Conversely, a break below the $3.1K support and subsequent breach of the 200-day MA would likely trigger a cascading sell-off, with the price potentially targeting the $2.5K level as the next significant support zone.
The 4-Hour Chart
On the 4-hour timeframe, ETHs price action reveals the consequences of breaking down from an ascending wedge pattern, a bearish technical structure that often precedes declines. This breakdown has led to a quick sell-off, with the asset now hovering near a support range defined by the 0.5-0.618 Fibonacci retracement levels.
This support range is expected to temporarily stabilize the price, potentially initiating a short-term bullish rebound. However, the market remains on edge, as continued bearish pressure could lead to a breakdown below this support region. In such a scenario, the bearish retracement is likely to extend, further solidifying sellers control in the near term.
Onchain Analysis
By Shayan
Ethereums overall bullish trend is at risk as Funding Rates, a key indicator of derivatives market demand, show mixed signals. While rates spiked midway through the rally, their sharp decline after rejection at the $4K resistance highlights waning trader commitment.
Initially delayed, the Funding Rates rise indicated cautious optimism. However, their subsequent notable drop signals reduced demand, weakening ETHs bullish momentum. Without renewed trader confidence, sustaining the rally becomes challenging. The $3K support level is vital, and holding it above it could stabilize the market and reignite bullish momentum. A breach, however, may lead to intensified selling and a deeper correction.
Overall, Ethereums outlook depends on reclaiming higher Funding Rates and defending $3K. These factors determine whether the market resumes its uptrend or faces further corrections.
The post Ethereum Price Analysis: Has ETH Hit the Bottom or Is More Downside Ahead? appeared first on CryptoPotato.
Read more: https://cryptopotato.com/ethereum-price-analysis-has-eth-hit-the-bottom-or-is-more-downside-ahead/
Text source: CryptoPotato


