Here Are ETHs Most Probable Next Targets: Ethereum Price Analysis
Ethereums recent attempt to break above the multi-month descending channels middle threshold of $2.6K has turned out to be a false breakout, leading to a notable rejection and sharp decline.
This pattern suggests a potential mid-term continuation of the downtrend toward the $2.1K support level.
Technical Analysis
By Shayan
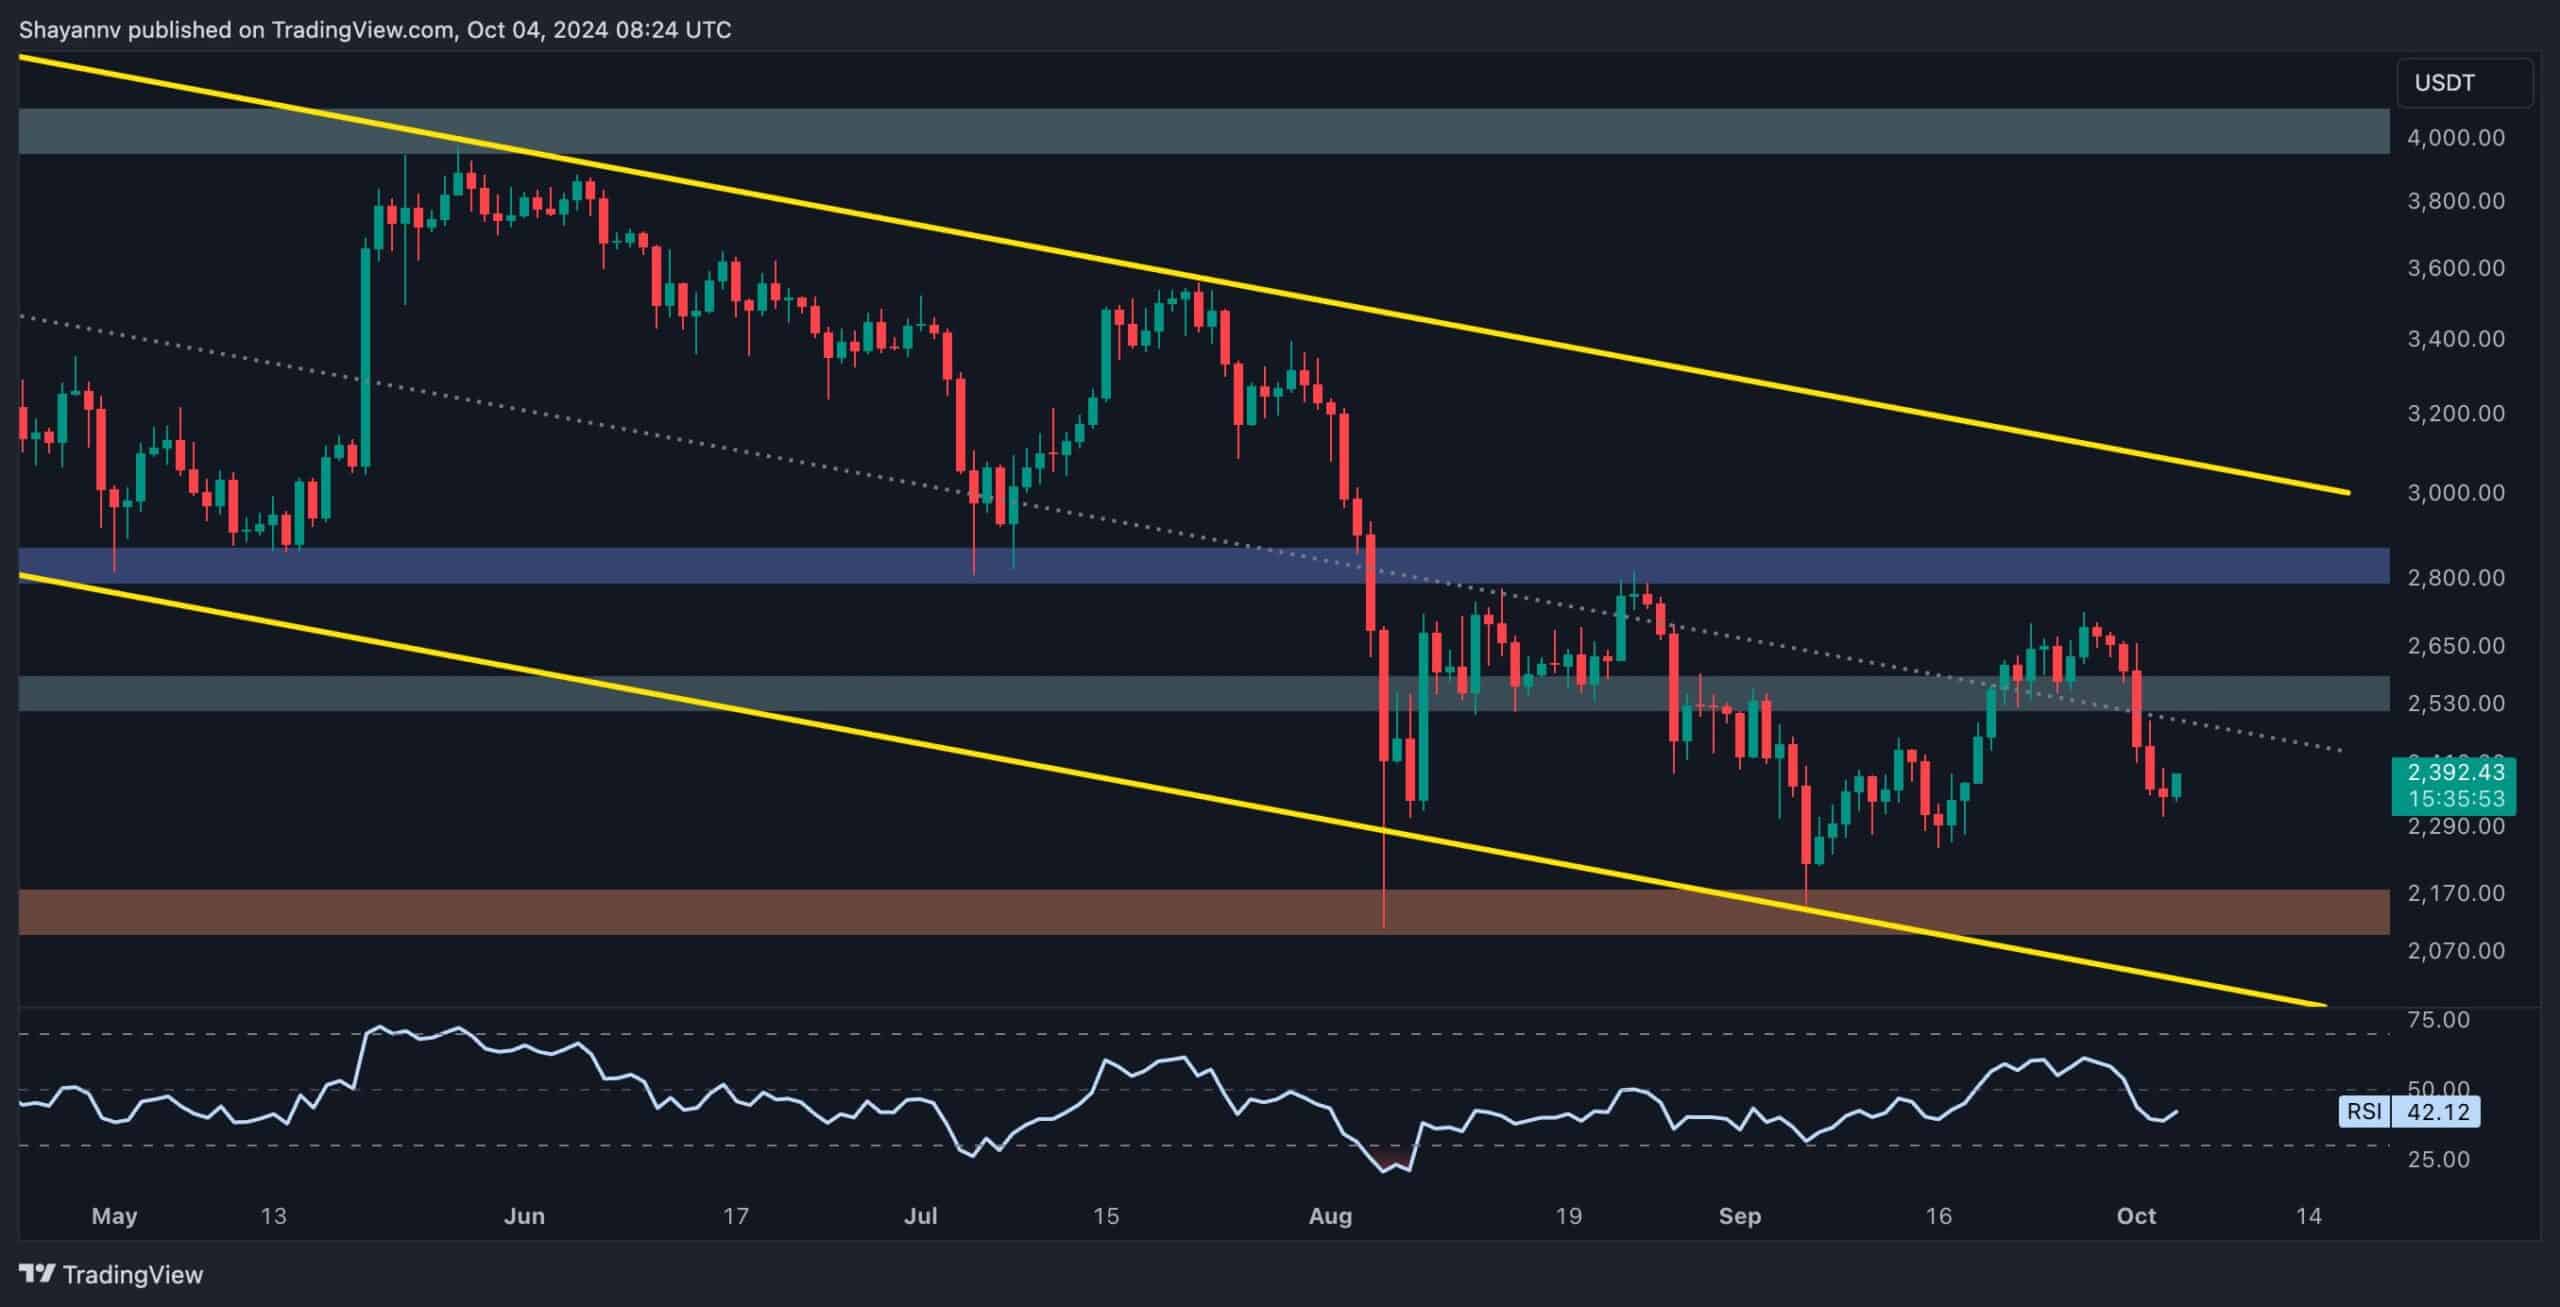
The Daily Chart
Ethereums price action on the daily chart has highlighted a bull trap. Much like in late August, when ETH broke above the descending channels middle threshold only to be swiftly rejected, a similar pattern has unfolded recently.
After the price briefly surpassed the $2.6K resistance, it failed to maintain momentum and faced considerable selling pressure, resulting in a 15% drop. This failure to establish a higher high indicates sellers dominance in the market.
Now, the cryptocurrency is approaching a crucial support zone of around $2.1K, which aligns with a previous major swing low. It seems likely to enter a descending consolidation phase for the mid-term, gradually declining toward this key level.
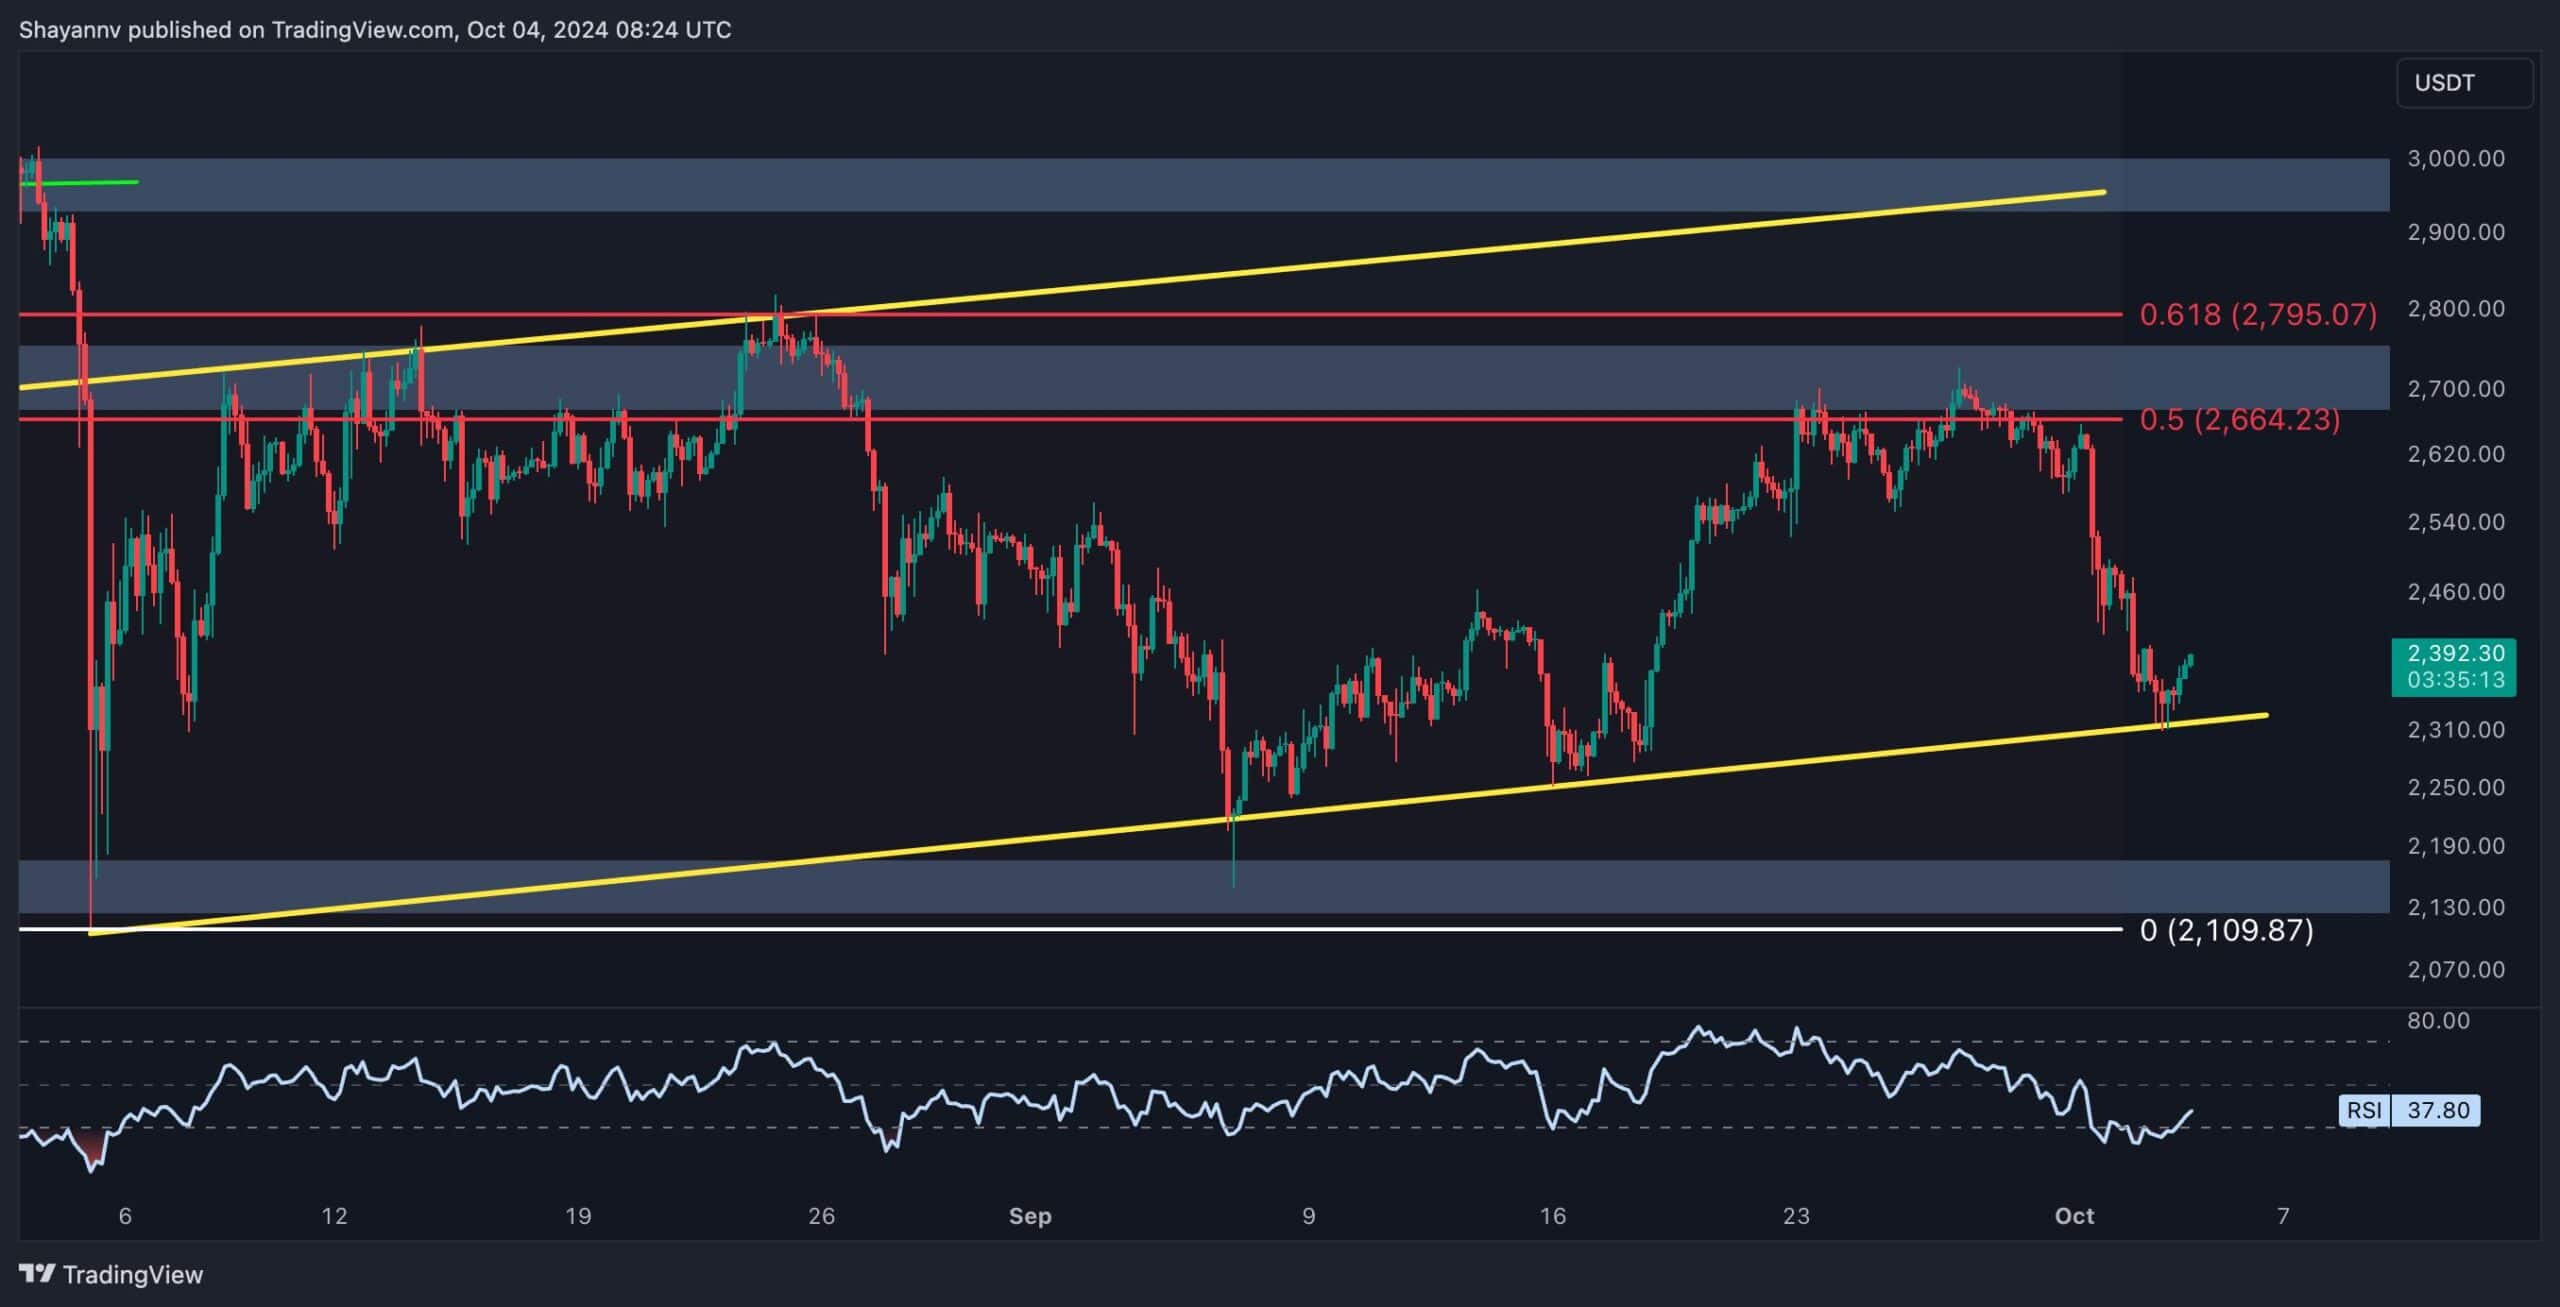
The 4-Hour Chart
On the 4-hour chart, Ethereums inability to maintain upward momentum near the 0.5 ($2.6K) 0.618 ($2.8K) Fibonacci levels triggered a bearish three-drive pattern.
This well-known reversal pattern and a bearish divergence between the price and the RSI indicator suggested that sellers were regaining control over the market. Consequently, Ethereum experienced a sharp decline, falling back toward the ascending flags lower boundary of $2.3K.
Currently, sellers aim to push Ethereums price below the flags lower boundary, which would likely begin a fresh bearish trend. If this breakout to the downside occurs, ETHs next primary target would be the $2K psychological support. However, the $2.1K threshold remains buyers first line of defense.
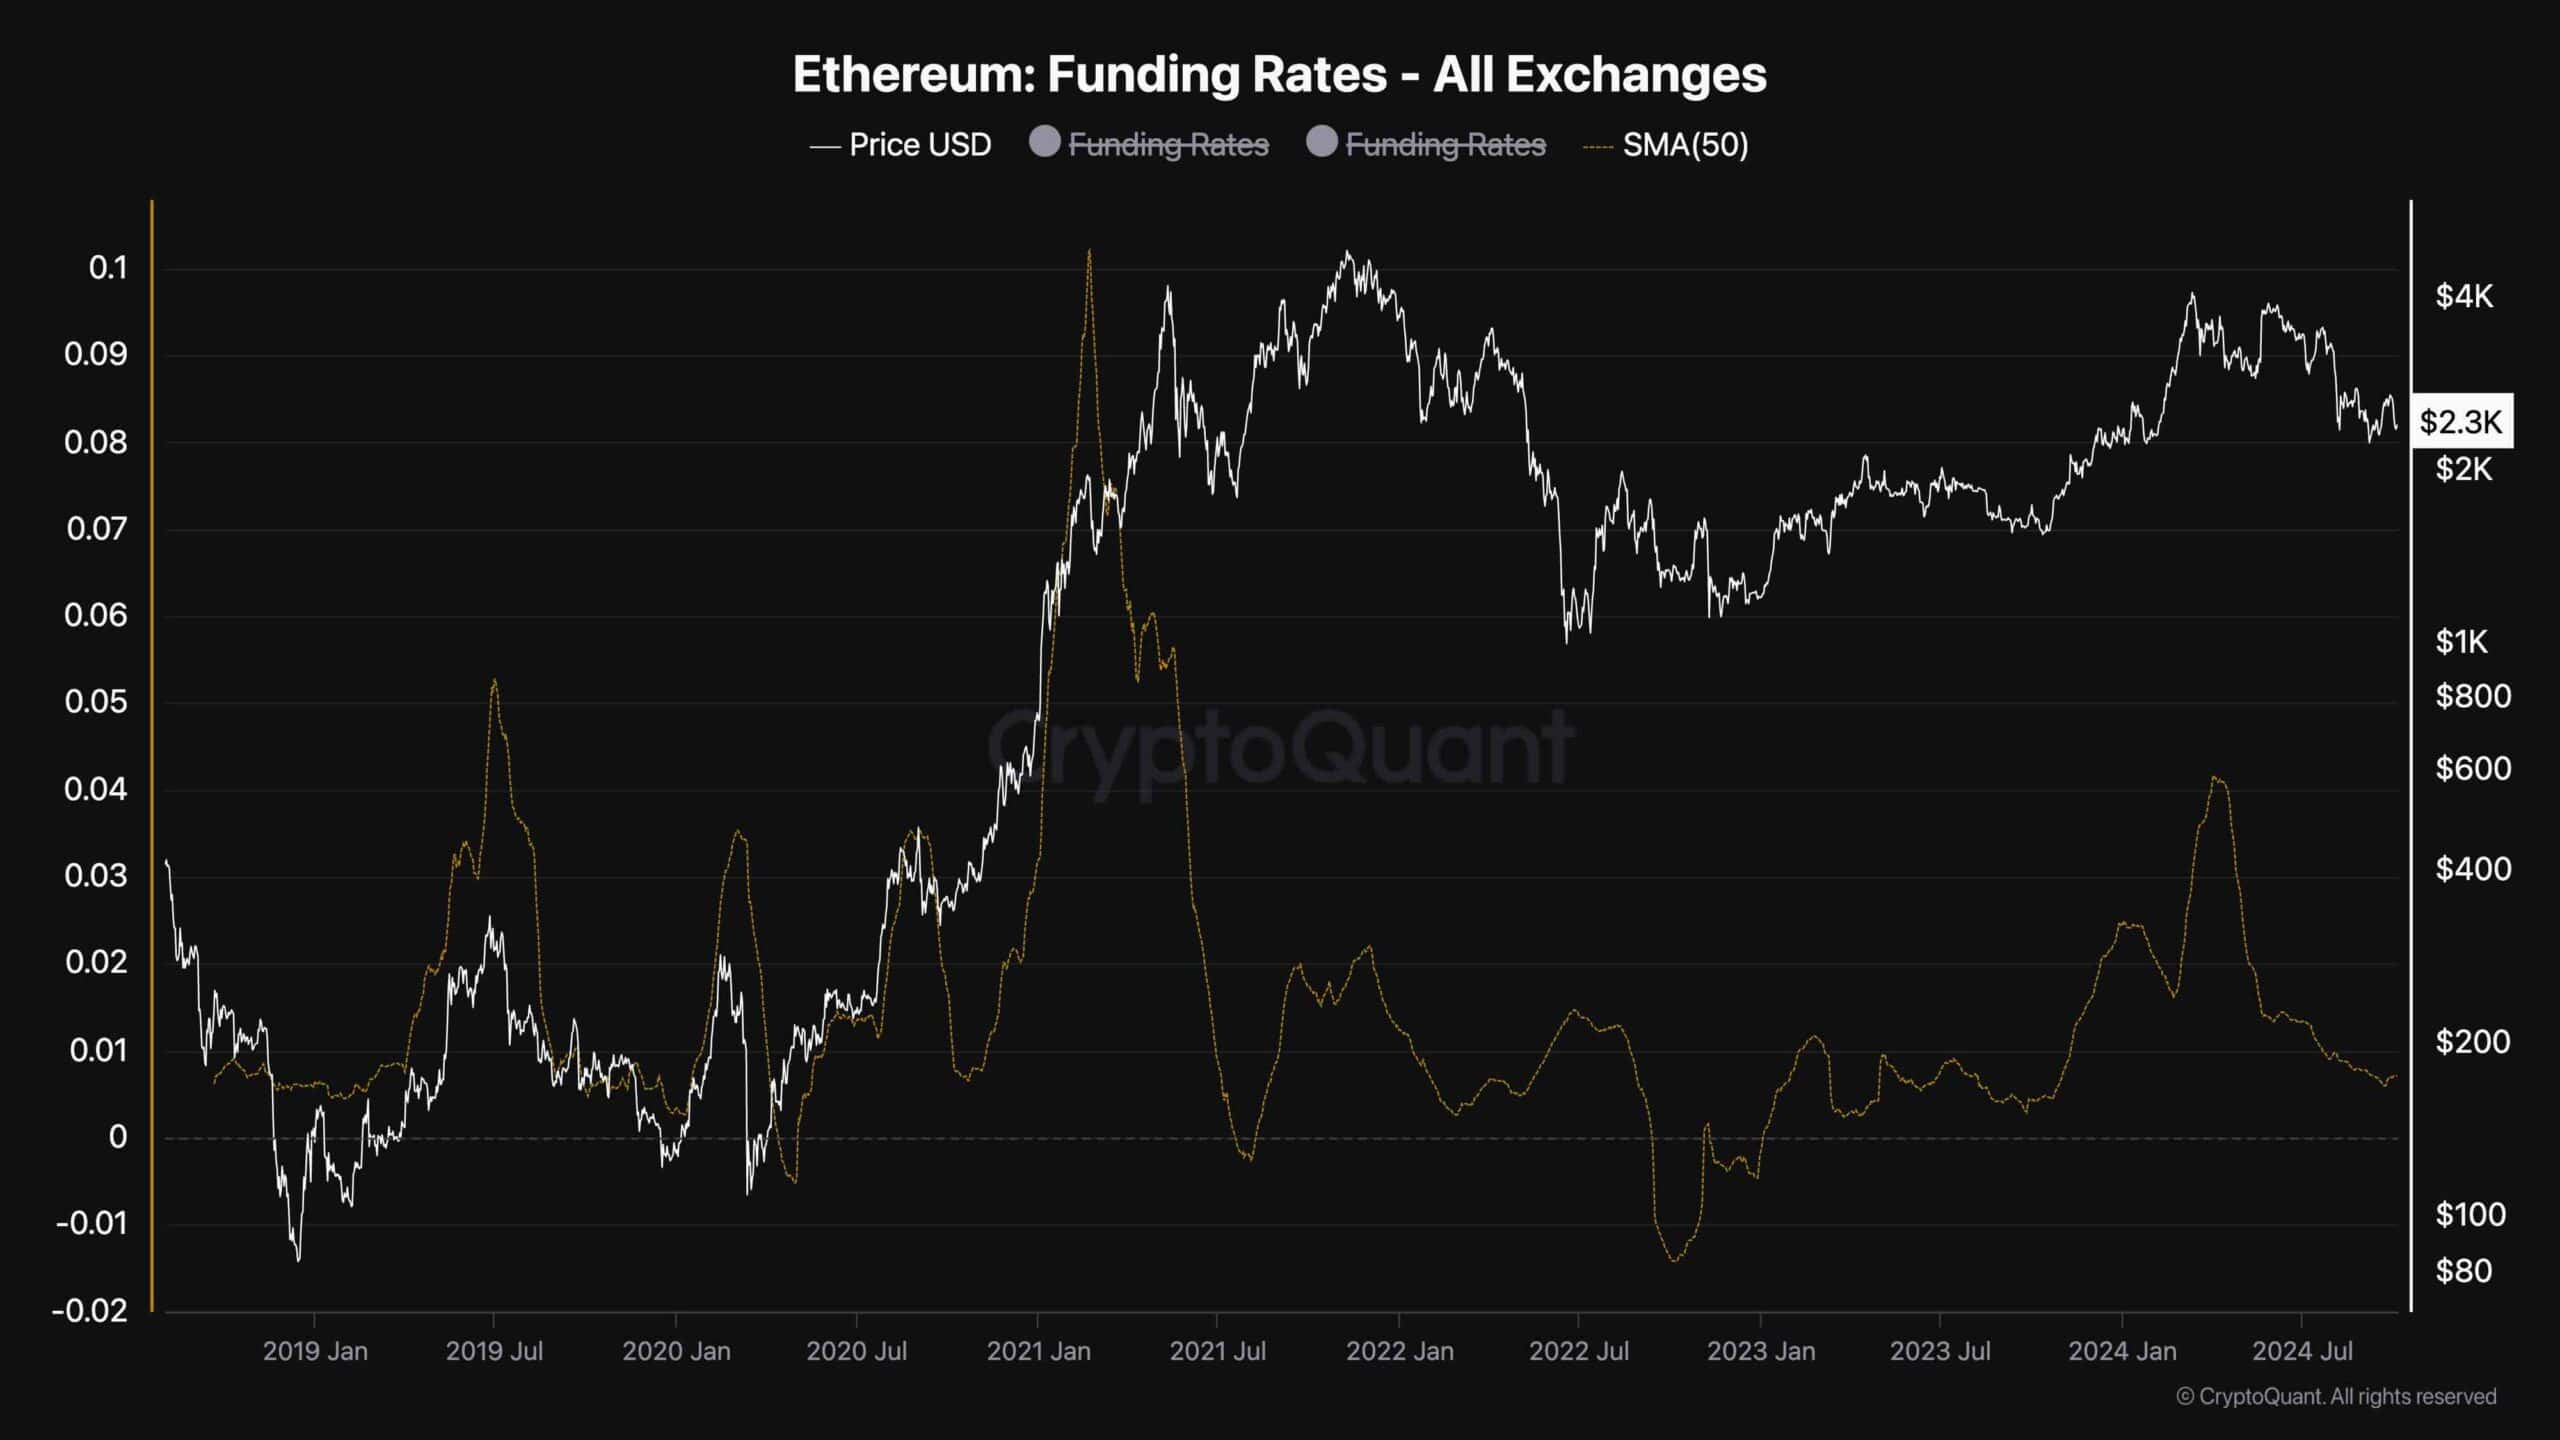
Onchain Analysis
By Shayan
This analysis focuses on the 50-day moving average of Ethereums funding rates, which provides a clearer picture of the broader sentiment within the futures market.
Recently, ETHs 50-day moving average funding rate has been steadily declining, reaching its lowest level in 2024. This persistent downtrend highlights bearish sentiment among futures traders, indicating an overall lack of buying interest in the market. Such conditions are often linked to declining prices, as short-sellers dominate the market.
For Ethereum to recover and rise to higher price levels, demand from the perpetual futures market must increase. The continuous drop in funding rates suggests that the selling pressure is more aggressive than buying interest, reflecting bearish expectations for ETH in the mid-term.
Although negative funding rates are generally associated with bearish conditions, they can sometimes signal a potential market reversal.
This happens through short liquidation cascades, where aggressive short positions get liquidated, triggering a rapid surge in price. For this to occur, however, substantial buying pressure from the spot market needs to support a rebound.
The post Here Are ETHs Most Probable Next Targets: Ethereum Price Analysis appeared first on CryptoPotato.
Read more: https://cryptopotato.com/here-are-eths-most-probable-next-targets-ethereum-price-analysis/
Text source: CryptoPotato


