Is BTC Heading Toward $65K After Surging 10% Weekly? (Bitcoin Price Analysis)
Bitcoin has recently experienced a strong bullish reversal from a critical support zone, defined by the 0.5 and 0.618 Fibonacci levels.
BTC is now approaching the 100-day moving average at $61.6K, where it may encounter significant selling pressure, suggesting a potential short-term consolidation.
Technical Analysis
By Shayan
The Daily Chart
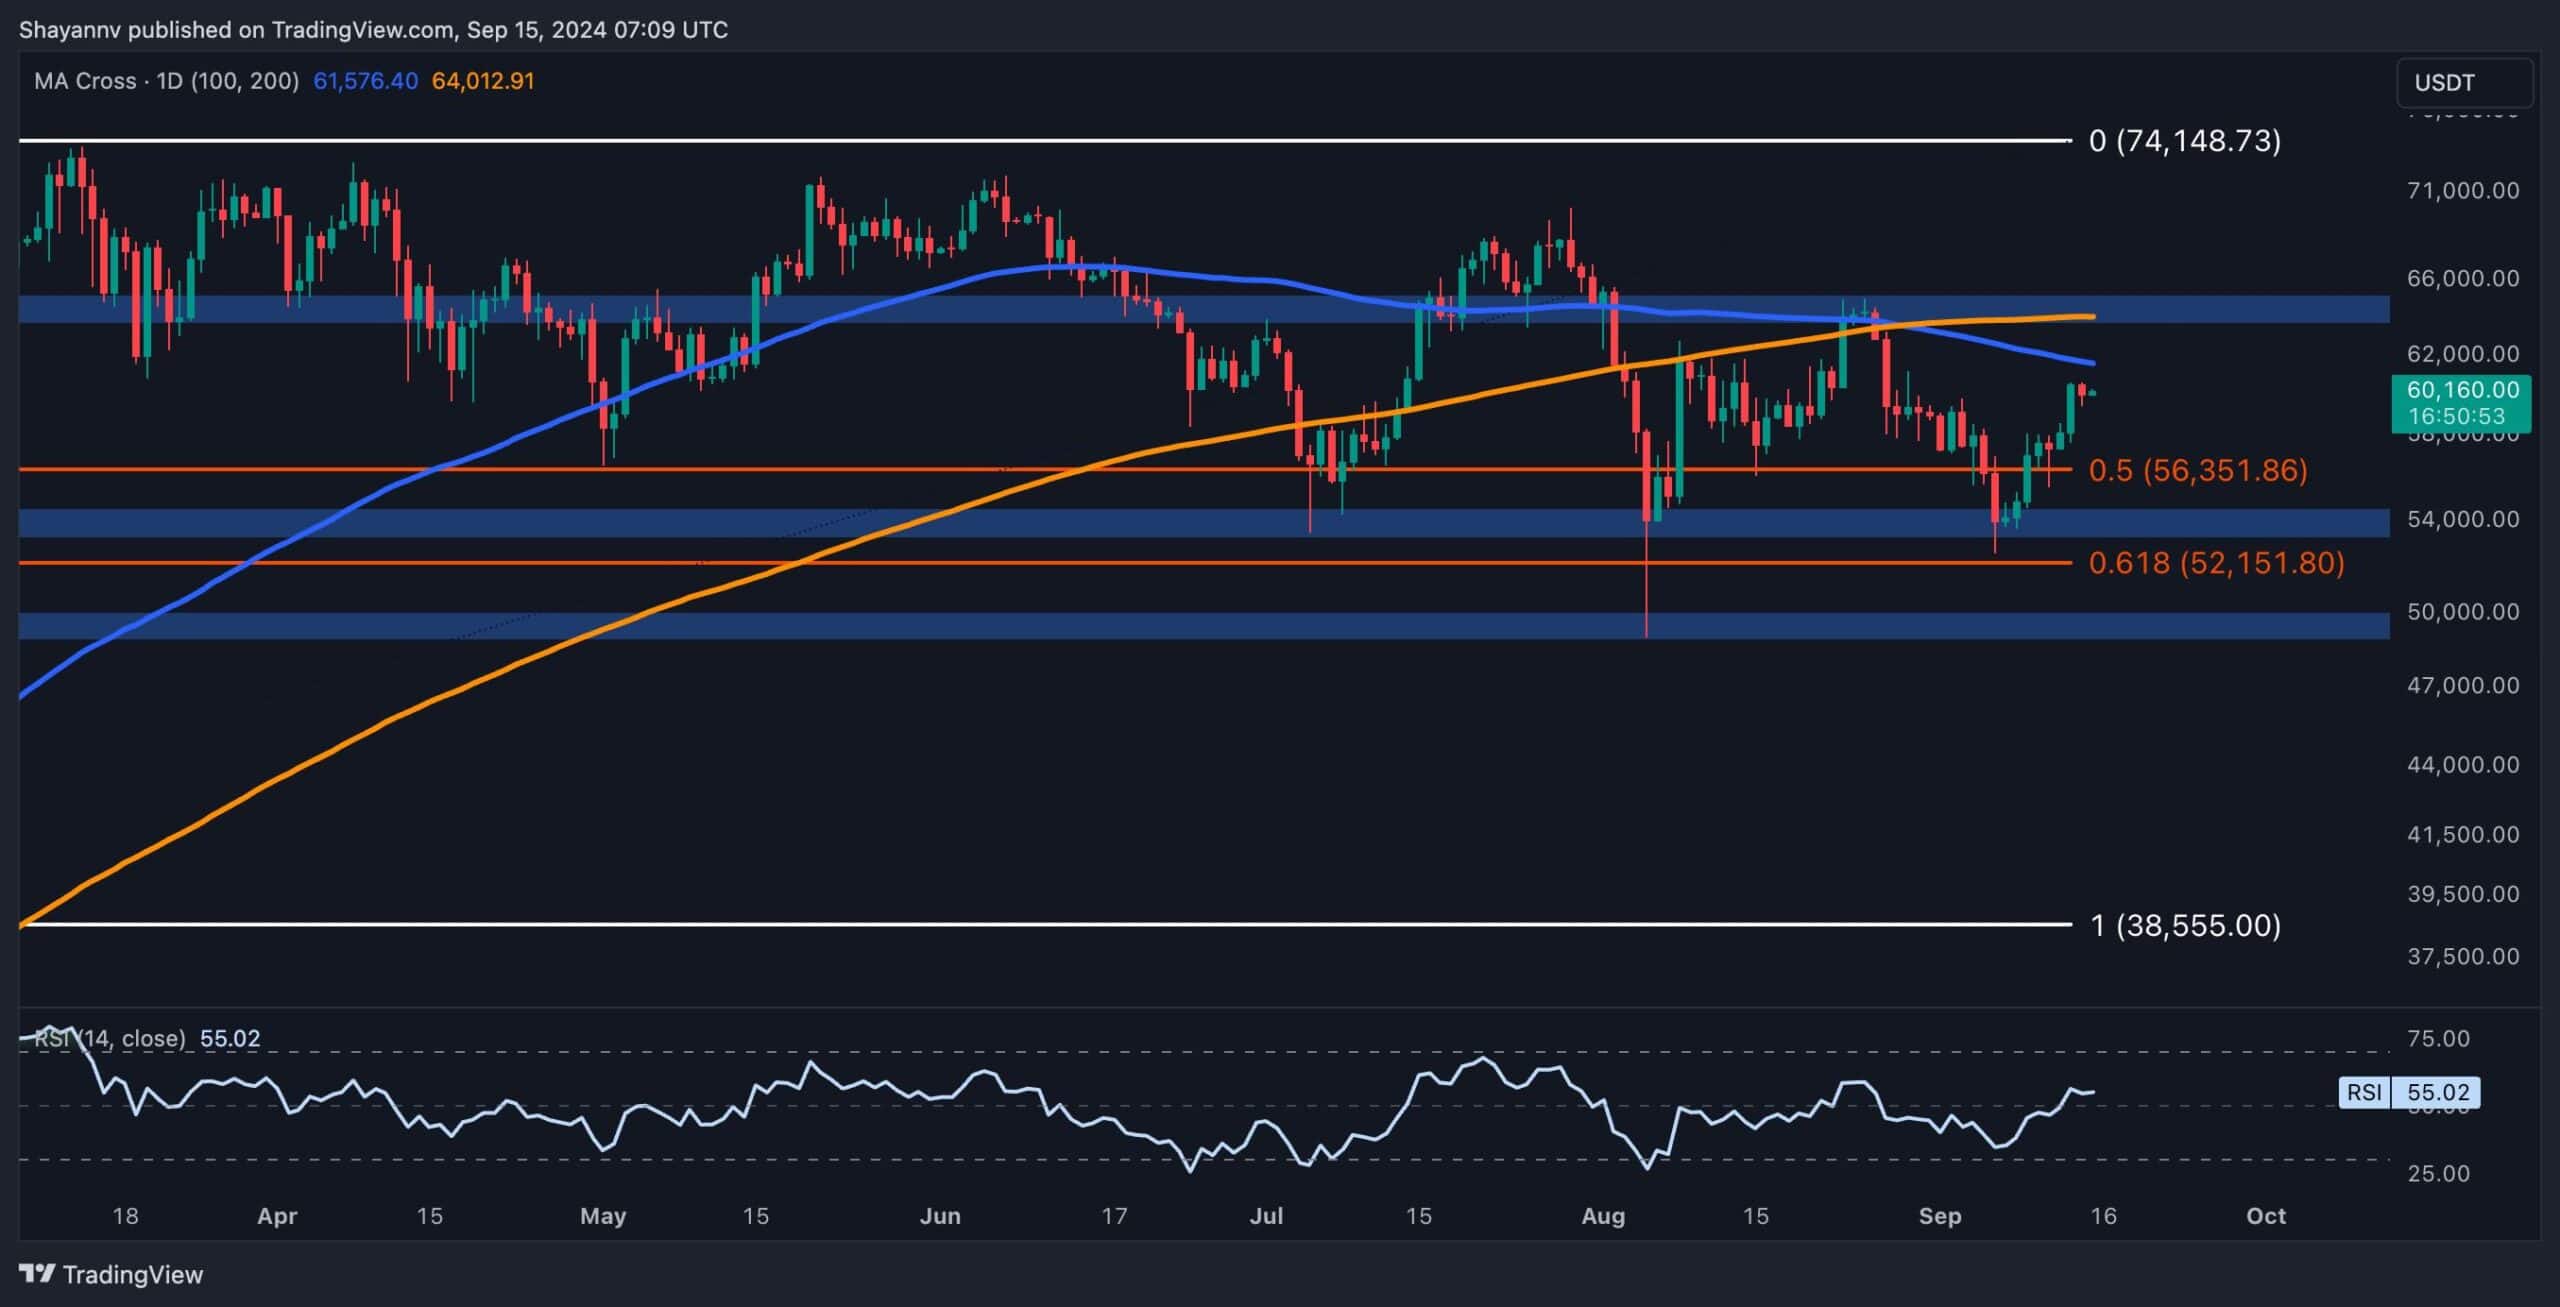
A closer examination of Bitcoins daily chart reveals that after a decline toward the key support zone between the 0.5 ($56.3K) and 0.618 ($52.1K) Fibonacci levels, the asset encountered substantial buying pressure, triggering a sharp reversal. This bullish momentum led to a roughly 15% surge toward the 100-day moving average at $61.6K, a major resistance level.
The current price action suggests buyers have re-entered the market, aiming for further upside. However, Bitcoin is now trading within a critical range, with resistance at $61.6K and support between the 0.5 and 0.618 Fibonacci levels, where a brief period of consolidation may occur.
The 4-Hour Chart
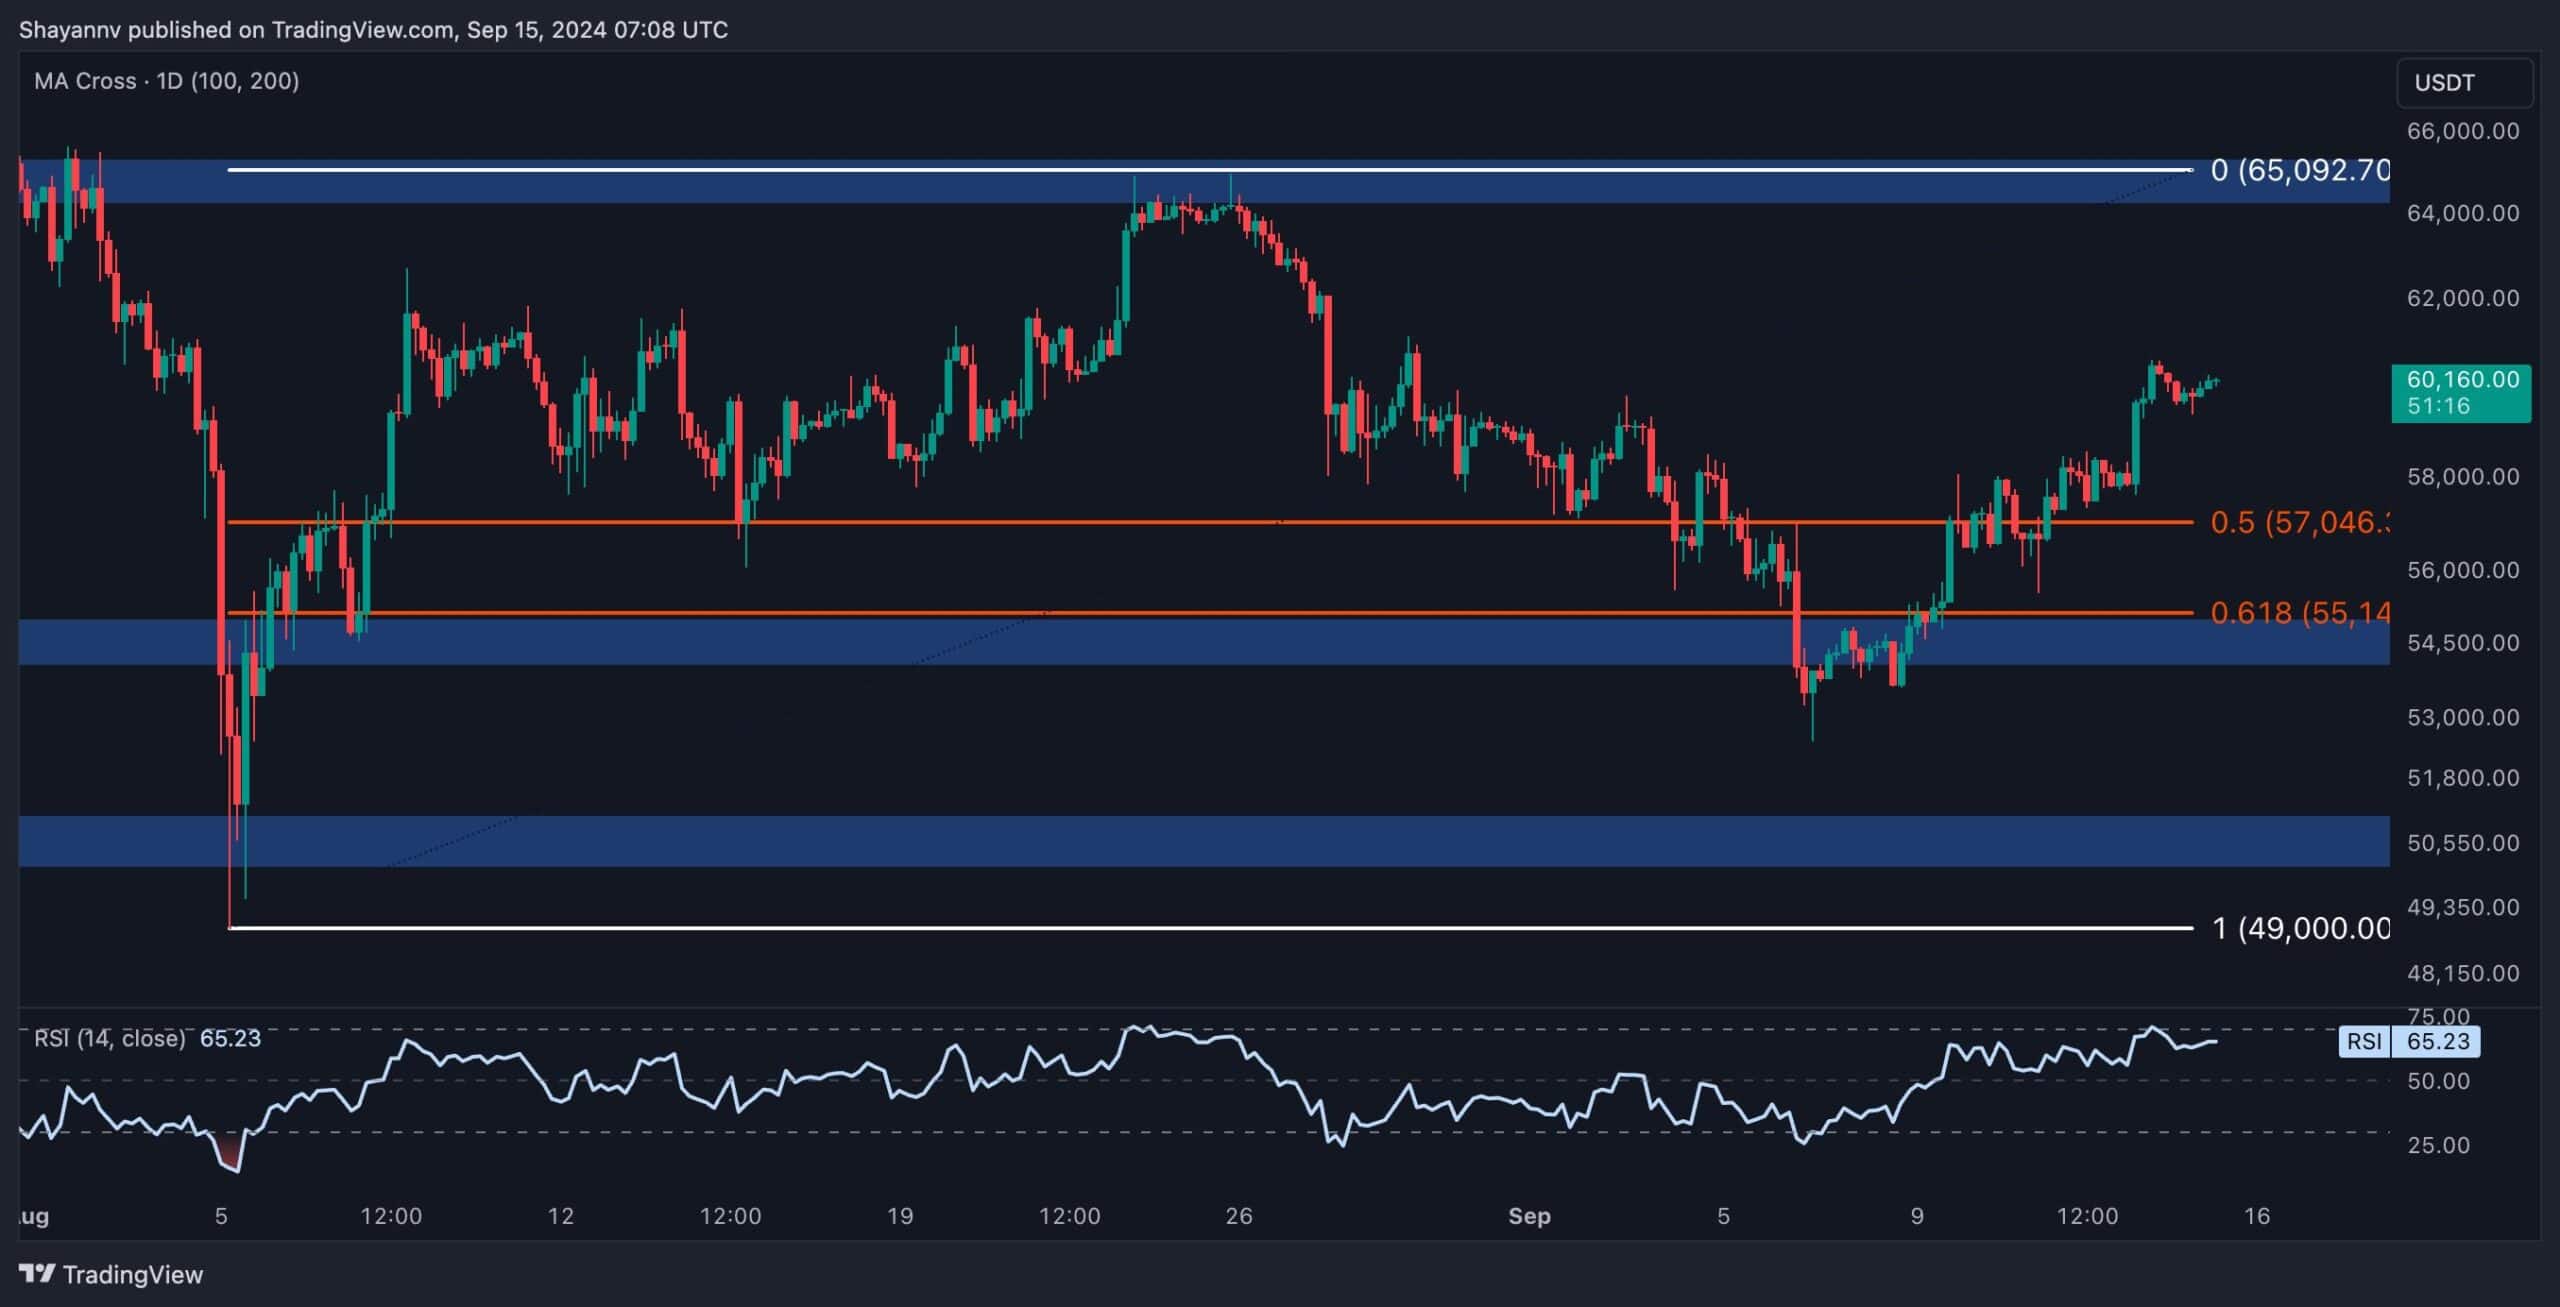
On the 4-hour chart, Bitcoin saw an apparent reversal at the $53K support, which aligns with the 0.618 Fibonacci level, igniting a steady upward trend. The failure to create a new lower low within the $52K-$54K range indicates strong buying interest, effectively halting the previous bearish momentum. Bitcoin is now approaching a key resistance area around $65K, which has historically been a challenging level for the price.
Should buyers push the price above this zone, the next target will be the $70K resistance. However, if the price is rejected at $65K, a bearish pullback toward the $52K-$54K psychological support could follow.
On-Chain Analysis
By Shayan
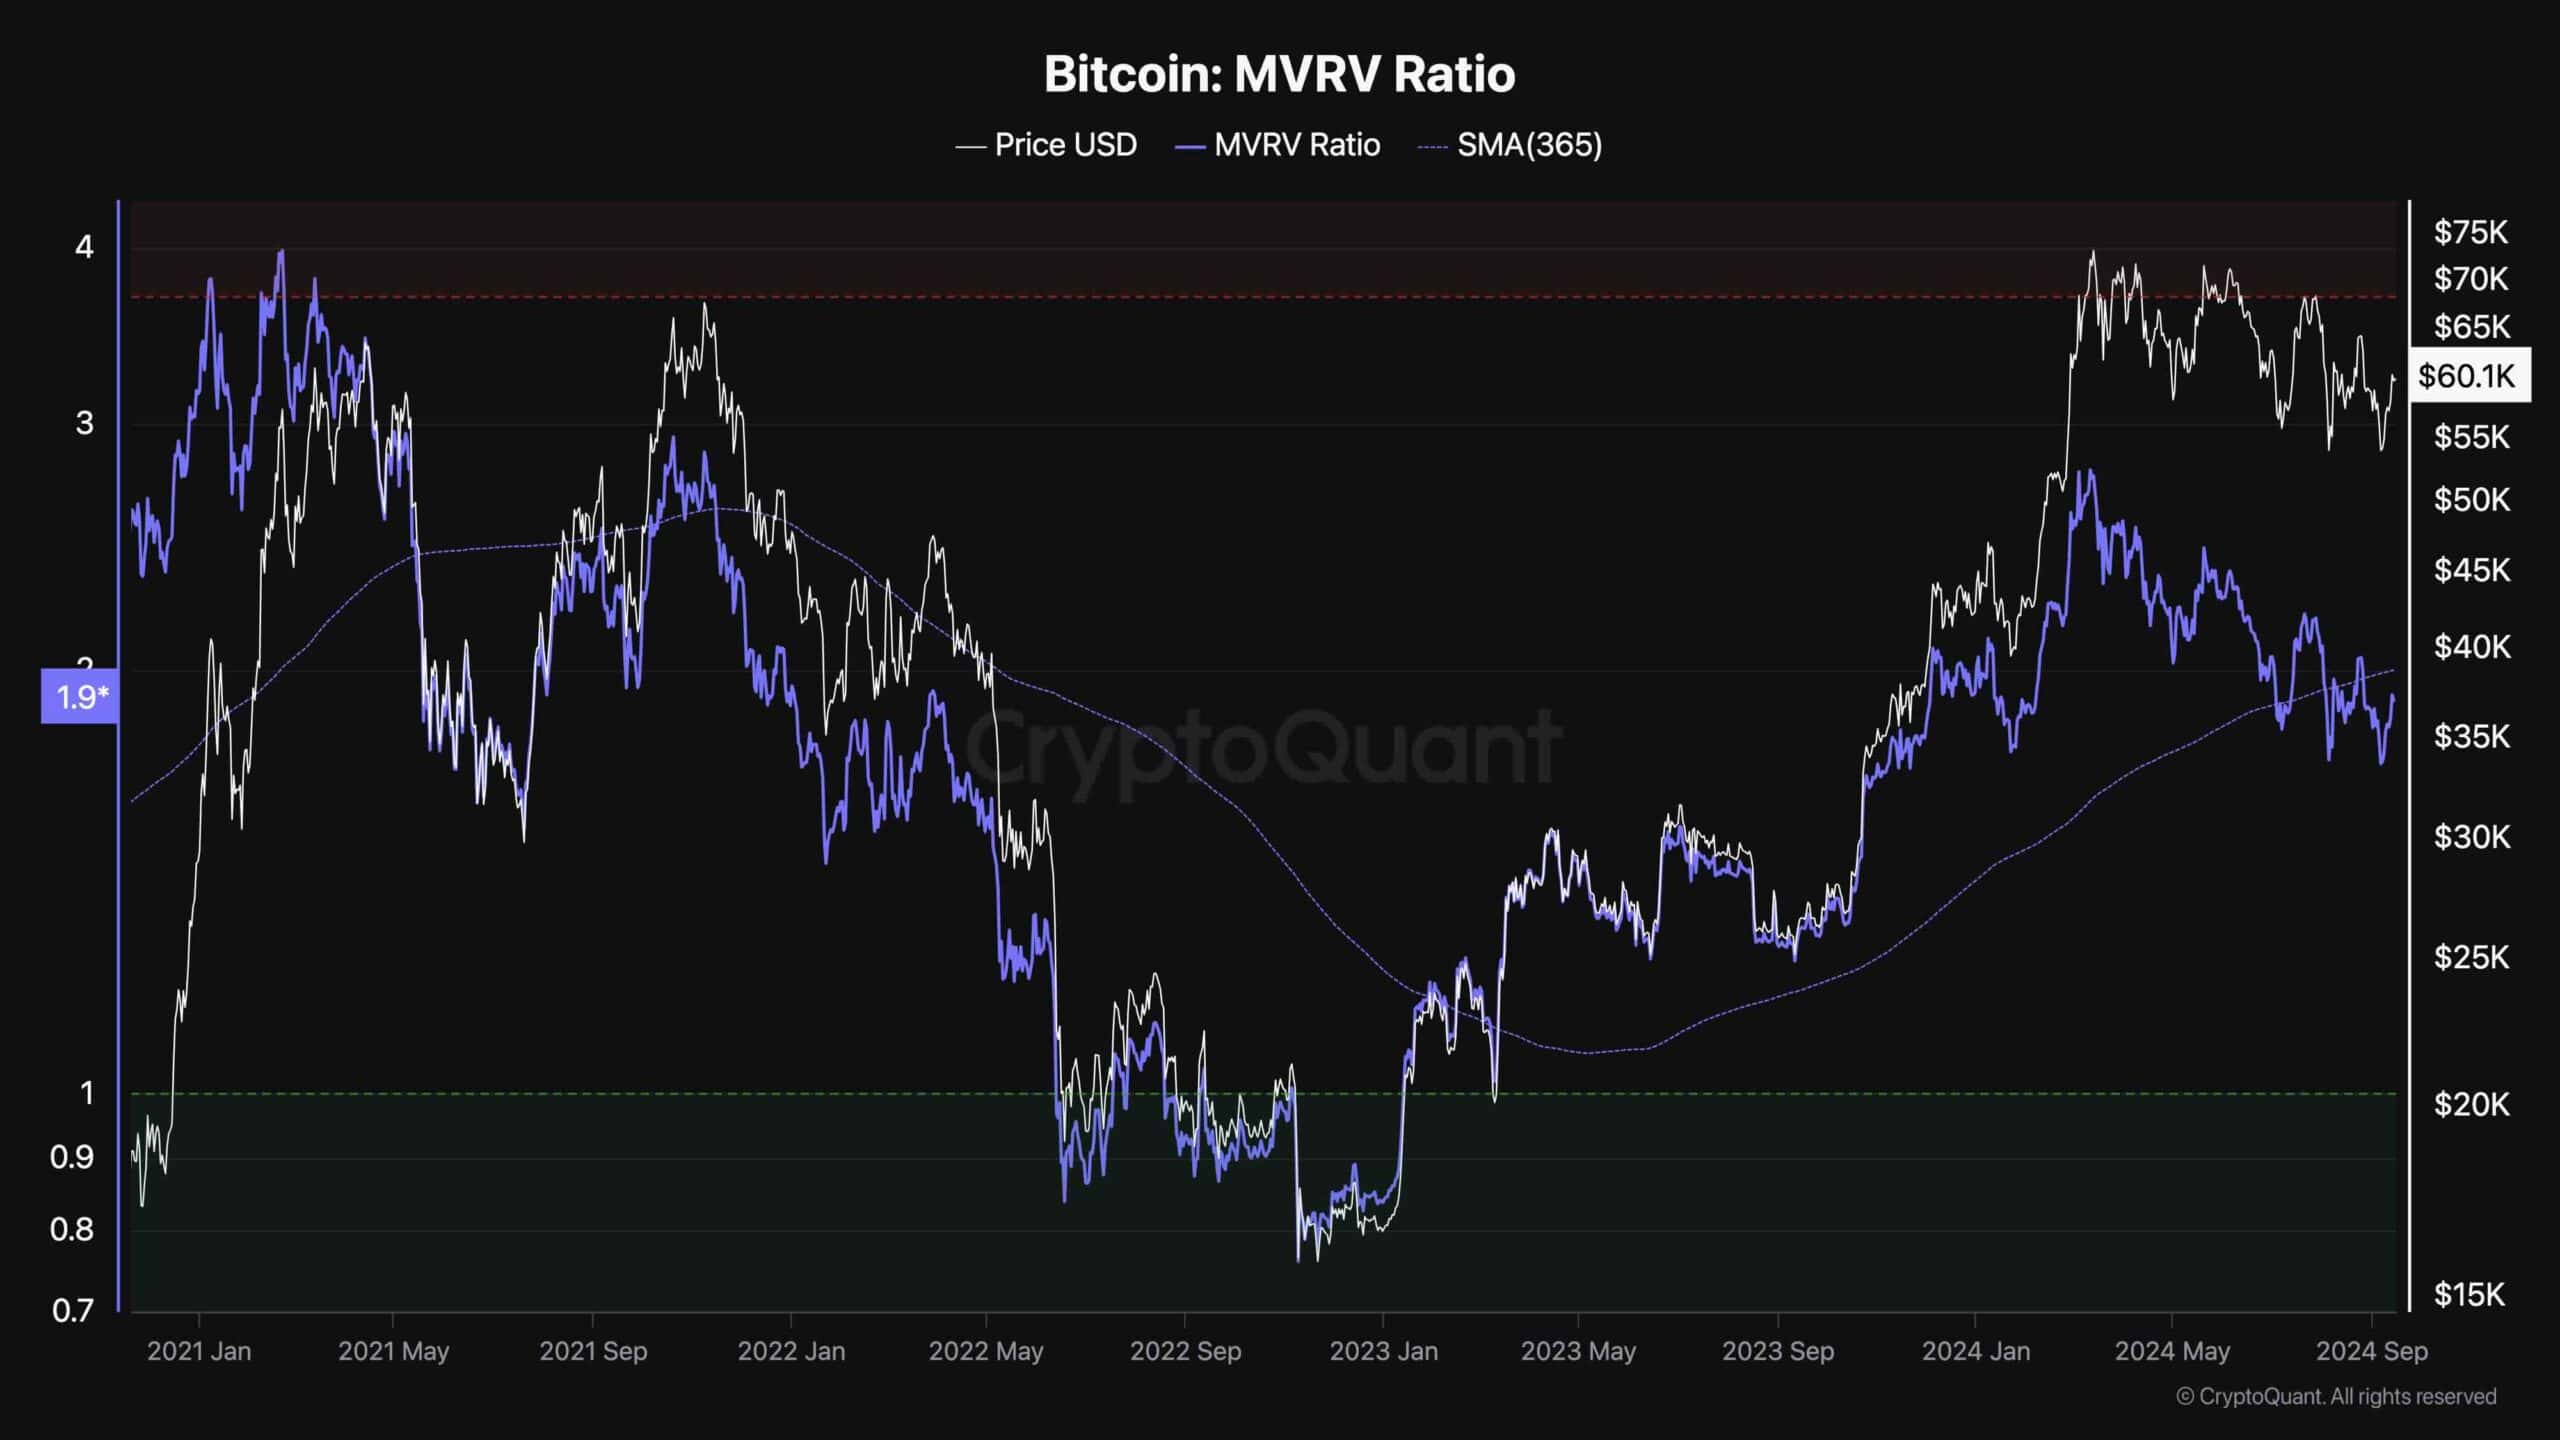
The MVRV (Market Value to Realized Value) ratio is a popular indicator for assessing overall market sentiment. Its calculated by dividing the market cap by the realized cap. When the ratio falls below 1, it signals that the majority of investors are facing losses, a scenario often associated with the formation of bear market bottoms over extended periods.
The MVRV ratio has recently slipped beneath its 365-day moving average, a historically significant level that has frequently marked the start of market recoveries. While this could be seen as a potential opportunity for long-term investors, its essential to exercise caution.
A meaningful recovery is typically signaled once the MVRV ratio climbs back above this key level. In previous market cycles, such a move has often been a turning point, leading to renewed investor confidence. However, current conditions, characterized by heightened fear and uncertainty, suggest that any recovery may take longer to unfold. As such, adopting a cautious and patient approach remains vital during this period.
The post Is BTC Heading Toward $65K After Surging 10% Weekly? (Bitcoin Price Analysis) appeared first on CryptoPotato.
Read more: https://cryptopotato.com/is-btc-heading-toward-65k-after-surging-10-weekly-bitcoin-price-analysis/
Text source: CryptoPotato


