W o r l d . C r y p t o . G l o b a l

Loading

Welcome at World Crypto Global. This portal is packed with useful content and resources to built out your own crypto skills. WorldCrypto is a site member of Gabriel Vega Network.

Contact Info

CATEGORY: chainlink news


Aug 07, 2024 05:50

Chainlink Drops by 64% In 5 Months, LINK Holders Unfazed: They Are Rapidly Accumulating

Yesterday, August 5, LINK, the native currency of Chainlink, a decentralized Oracle provider, plunged to a six-month low. Changing hands at around $8, LINK fell by 64% from March highs, breaking out from a bull flag, signaling weakness. The correction was across the board, and leading altcoins like Solana and Cardano also posted sharp losses. [...]

The post Chainlink Drops by 64% In 5 Months, LINK Holders Unfazed: They Are Rapidly Accumulating appeared first on Crypto Breaking News.

Aug 29, 2024 02:00

HashKey Exchange adds AVAX and LINK trading pairs for retail investors

HashKey Exchange lists AVAX/USD and LINK/USD for retail investors starting August 28. Previously, retail investors in Hong Kong were only limited to Bitcoin and Ethereum. AVAX and LINK deposits and withdrawals are possible via Avalanche and ERC20 networks respectively. HashKey Exchange, one of Hong Kong’s two fully licensed cryptocurrency exchanges, has expanded its offerings to […]

The post HashKey Exchange adds AVAX and LINK trading pairs for retail investors appeared first on CoinJournal.

LINK Surges 11% As Key Data Reveals Day Traders Are Locking Gains

Author: Sebastian Villafuerte
United Kingdom
Aug 23, 2024 12:05

LINK Surges 11% As Key Data Reveals Day Traders Are Locking Gains

Chainlink (LINK) has surged over 10% in the past few hours, pushing its price to $11.39 at the time of writing. This significant gain comes after two weeks of sideways consolidation, signaling a potential shift in momentum.  Related Reading: Chainlink Drops by 64% In 5 Months, LINK Holders Unfazed: They Are Rapidly Accumulating As LINK rallies, data from Santiment, a leading crypto data intelligence platform, reveals that some daily traders are already taking profits, capitalizing on the recent price increase. This profit-taking activity highlights investors’ cautious optimism as LINKs price gains momentum and reaches technical resistance in the 4-hour timeframe. LINKs On-Chain Transaction Volume Showing Profit-Taking LINK’s daily profit-to-loss transaction volume has reached its highest level since July 14, with the ratio at 5.986. This means there are nearly six transactions in profit for every transaction in loss, signaling that short-term holders are actively taking profits following the recent move up. Such a high ratio indicates that investors are capitalizing on a significant price increase or relief rally, locking in gains as the market tests key levels. This profit-taking trend reveals the dynamics prevailing among traders, even as LINKs price continues to gain momentum in the market. With the token testing local supply around the $11.40 mark, the market sentiment is one of careful anticipation. Traders are keenly aware of the delicate balance between further gains and potential pullbacks. Investors will watch for signs of a sustained breakout or a potential reversal as LINK approaches this threshold. The outcome at this level could set the tone for LINKs price action in the coming days, making it a critical juncture for traders and investors alike. Technical Details: LINK Price In Critical Level  LINK is trading at $11.31 after breaking a local high of $10.83 set on August 8, confirming an uptrend on the daily time frame. The price rally paused at $11.40, right at the 4-hour (4H) 200 exponential moving average (EMA), underscoring the significance of this technical indicator in lower time frames. This indicator acts as a dynamic support or resistance level, often indicating the trend in lower time frames. For LINK, reclaiming this level is crucial to confirm bullish momentum. For LINK Bulls to maintain momentum, the next crucial step is to retake the 4H 200 EMA and aim for $13. Conversely, if LINK fails to consolidate above this indicator, it could lead to a retest of the previous resistance at $10.83 and potentially a dip to the higher low around $9.90. Related Reading: Analyst Says Chainlink Price Could Climb To $19 Heres How Despite some day traders locking in profits, this activity should be seen as a sign of healthy profit-taking after a modest rally. The current price action reflects a market in consolidation, with traders closely watching for the next move. As LINK hovers near critical levels, the coming days will be pivotal in determining whether the uptrend continues or if a pullback is on the horizon. Cover image from Dall-E, Charts from Tradingview

Jul 09, 2024 03:35

Whales Amass 6.2M LINK as Prices Dip, Signaling Market Confidence

Chainlink whales have increased their holdings by 6.2M LINK ($76.88M) amid market volatility, suggesting confidence in LINK’s future performance. Chainlink…

The post Whales Amass 6.2M LINK as Prices Dip, Signaling Market Confidence first appeared on The Crypto Basic.

Jul 09, 2024 12:05

Analyst Predicts ChainLink (LINK) Rally To $13 Could Result In 45% Price Correction, Heres Why

The decentralized oracle network ChainLink and its native token, LINK, have staged a price recovery amid the broader cryptocurrency market’s bounce from a recent significant correction.  Despite experiencing a 16% price retracement over the past month, LINK has regained its stronghold, rising 5% to $13 in the past 24 hours after hitting a six-month low of $11 on Friday. Still, cautionary signals have emerged that caught the attention of crypto expert Ali Martinez.  Bearish Signals For ChainLink  In a recent social media post, Martinez raised concerns about a pattern visible on LINK’s daily chart, suggesting the potential for a substantial price correction ahead.  Specifically, the analyst highlighted a possible retest of the neckline of the head-and-shoulders pattern during the recent upswing to $13.  Related Reading: Mass Adoption? NEAR Protocol Sees Over 12 Million Unique Addresses In 30 Days According to Martinez, this pattern indicates a continuation of the downtrend until the right shoulder is broken, meaning that the ChainLink price would have to break above the $20 level, the top of the right shoulder, to invalidate this scenario. If this scenario is as predicted, ChainLink could face a 45% correction. Martinez previously highlighted the likelihood of such a correction if LINK were to break below the $12.70 support level.  The token’s price might retrace significantly in this bearish scenario, potentially reaching as low as $6.60. Notably, these levels were last witnessed in September 2023, before the commencement of the overall market uptrend that began in November of the same year. Key Levels For LINKs Price Recovery Another analyst, Crypto Ambrosio, presents similar downward scenarios for the ChainLink price in a recent analysis of key indicators.  The analyst suggests that if the 20-week exponential moving average (EMA), depicted by the yellow line in the chart above, remains above the current price action, it would serve as a notable bearish signal for the token. However, breaking above this indicator situated at $14.75 would invalidate this bearish outlook. Additionally, Crypto Ambrosio noted a downtrend pattern in the Relative Strength Index (RSI), further supporting the notion of a new downtrend for ChainLink. To counter these bearish signals, it is crucial for LINK to hold the $12 support level, as noted by the analyst.  Ambrosio also believes that if ChainLink forms a Falling Wedge pattern and breaks the resistance at $15, it could signal a bullish reversal and pave the way for further price recoveries toward its yearly high of $22.89, reached in March. Related Reading: Bitcoin Starts July On A Bearish Note, Will CPI Data Change The Narrative This Week? The token must overcome key upper resistance levels while trading at $13.28 to initiate a potential price recovery. Upon analyzing the LINK/USD daily chart, the token will likely encounter its first significant challenge at the $13.52 price level, which has acted as a resistance for the past two months. Moreover, to invalidate the extension of the bearish scenario and surpass the 20-week exponential average, the ChainLink price would need to surpass and consolidate above the $14.38 resistance level.  Featured image from DALL-E, chart from TradingView.com

Jul 24, 2024 12:05

Chainlink (LINK) Forms Signal That Last Led To 123% Rally

On-chain data shows Chainlink has just seen a level of decline in its exchange reserve that last led to a massive rally for the cryptocurrency. Chainlink Exchange Supply Has Dropped By 1.6% In The Past Month According to data from the on-chain analytics firm Santiment, Chainlink has observed significant outflows from exchanges recently. The indicator of interest here is “Supply on Exchanges,” which, as its name suggests, keeps track of the percentage of the total circulating LINK supply that’s currently sitting in the wallets of all centralized exchanges. Related Reading: Last Resistance: Bitcoin Now Testing Final Short-Term Holder Cost Basis When the value of this metric rises, it means these platforms are receiving a net amount of deposits right now. As one of the main reasons why investors may transfer to exchanges is for selling-related purposes, such a trend can have bearish implications for the asset. On the other hand, the indicator registering a decline implies a net outflow of coins is occurring from the exchanges. Holders generally withdraw their coins to self-custody when they plan to hold into the long term, so this kind of trend can be bullish for the cryptocurrency’s price. Now, here is a chart that shows the trend in the Chainlink Supply on Exchanges over the past year or so: As displayed in the above graph, the Chainlink Supply on Exchanges has witnessed a sharp drawdown recently. More specifically, investors have withdrawn around 1.6% of the asset’s entire supply in circulation over the past month. This is a very notable decrease and suggests there is some strong demand from the whales for accumulation. The last time the metric saw a significant drop was in the early part of the year. This last decrease of 1.1% led to a LINK price rally of around 10%. In December, a similar trend was observed, with withdrawals equivalent to 0.7% of the supply resulting in a 26% jump in the coin. Both of these instances, though, saw outflows of a smaller degree than what LINK has seen recently. From the chart, it’s visible that the last time a similar percentage of supply exited these platforms was between 15th of September and 14th of October. What followed this withdrawal spree was a massive 123% surge in the Chainlink price over the next four weeks. As a similar decline has occurred again in the indicator with the exchange supply dropping from 23% to 21.4%, it’s possible that LINK could end up seeing a bullish effect this time as well. Related Reading: Solana Cooling Off After 16% Surge? TD Sell Signal Goes Off It only remains to be seen, though, if any resulting rally would be of a similar scale as that other instance, or if only a small increase will happen, like after the last two outflow streaks. LINK Price At the time of writing, Chainlink is trading around $13.9, down more than 2% over the past 24 hours. Featured image from Shutterstock.com, Santiment.net, chart from TradingView.com

Jul 23, 2024 03:35

Chainlink Whales Accumulate $118.44M LINK as Market Volatility Persists

Whales have accumulated 8.46 million Chainlink (LINK) worth $118.44 million over the last three weeks. Chainlink (LINK) has been a…

The post Chainlink Whales Accumulate $118.44M LINK as Market Volatility Persists first appeared on The Crypto Basic.

Jul 11, 2024 12:05

Chainlink Traders Capitulate After 10% Plunge: Bottom Here?

On-chain data shows that Chainlink investors have been realizing significant losses recently, a sign that the price plunge has put fear into their minds. Chainlink FUD Could Lead Towards Bottom Formation According to data from the on-chain analytics firm Santiment, LINK investors have just shown their largest capitulation event of the year. The indicator of relevance here is the “Network Realized Profit/Loss,” which keeps track of the net amount of profit or loss that Chainlink traders are realizing right now. The metric works by going through the blockchain history of each coin sold to see what price it was moved at before this. If this previous price for any coin was less than the spot price it’s being transferred at now, then the coin’s sale is realizing some profit. Related Reading: Bitcoin Now Forming Pattern That Last Led To It Blasting Off Similarly, transactions of coins of the opposite type would lead to loss realization instead. The indicator adds up these profits and losses for the entire network and then calculates their difference to find the net situation. When the value of the Network Realized Profit/Loss is positive, it means the investors as a whole are realizing profits. On the other hand, the negative metric suggests that loss-taking is the dominant form of selling in the market. Now, here is a chart that shows the trend in the Chainlink Network Realized Profit/Loss over the past few months: As is visible in the above graph, the Chainlink Network Realized Profit/Loss has seen a negative spike recently, suggesting that LINK investors have realized some large losses. This significant loss-taking spree from the LINK traders has come as the cryptocurrency’s price has gone through a significant drawdown over the past few weeks. The coin is down almost 10% in the last seven days alone. Given this timing, it would appear that these investors have been scared by the bearish price action so much that they have decided to exit the market at a loss. In the same chart, the analytics firm has also attached the data for another metric, the Age Consumed, which keeps track of whether dormant coins are moving. Related Reading: Solana Mirroring 2021 Bullish Pattern, Crypto Analyst Reveals It would seem like this indicator also spiked alongside the loss-taking from the investors, implying that even some holders previously sitting tight have been shaken out by the price plunge. This FUD in the market can benefit Chainlink, as historically, the asset has been more likely to bottom out when fear is ripe among the investors. As Santiment highlighted in the graph, a red spike in the indicator also proved bullish for LINK in April. LINK Price Chainlink is trading around $12.8 when writing, down around 3% over the last 24 hours. Featured image from Dall-E, Santiment.net, chart from TradingView.com
Jun 28, 2024 02:00

Chainlink launches Data Streams product on Avalanche Network

Chainlink launches Data Streams on Avalanche to enhance real-time data access. Data Streams introduces pull-based oracles for low-latency data retrieval. The new product adds to the expanding range of Chainlink’s product offerings. Chainlink has introduced an innovative product dubbed Data Streams on the Avalanche Network in partnership with GMX, a perpetual futures trading platform. This […]

The post Chainlink launches Data Streams product on Avalanche Network appeared first on CoinJournal.

Jun 02, 2024 05:50

Chainlink Is Not Done: Analyst Predicts 300% Rise Against Bitcoin

A crypto analyst has highlighted the Chainlink remarkable resilience amidst market volatility, predicting that the cryptocurrency is getting ready to witness a 300% surge against Bitcoin, the worlds largest cryptocurrency.  Chainlink Poised For 300% Increase Against Bitcoin Chainlink, a decentralized blockchain oracle network has been gaining traction recently, bolstered by the innovative developments within its [...]

The post Chainlink Is Not Done: Analyst Predicts 300% Rise Against Bitcoin appeared first on Crypto Breaking News.

May 31, 2024 02:00

APT price jumps after integration of Chainlinks CCIP and data feeds into Aptos

Aptos (APT) integrates Chainlink’s CCIP and data feeds, boosting its dApp development. APT price rises by 3.14% to $9.41; market cap increases by 3.17% to $4.1 billion. Aptos has become the first Move-based blockchain to join Chainlink’s SCALE program. Aptos (APT) has seen a notable increase in its market performance following the announcement of its […]

The post APT price jumps after integration of Chainlink’s CCIP and data feeds into Aptos appeared first on CoinJournal.

May 30, 2024 03:35

Chainlink Price Forecast: This Signal Could Push LINK to $25

Chainlink price soared to a 60-day peak of $18.90 on Wednesday, May 29, extending its monthly timeframe gains to the…

The post Chainlink Price Forecast: This Signal Could Push LINK to $25 first appeared on The Crypto Basic.

May 28, 2024 05:50

Chainlink-SWIFT Partnership Update Looms: LINK Is Set To Skyrocket

As the Consensys 2024 conference commences this week in Austin, Texas, the LINK community is abuzz with anticipation over a potential pivotal announcement from Chainlink in collaboration with SWIFT. Speculations are rife that this announcement, set for May 30 during a session on tokenization, could significantly influence LINKs market performance. Chainlink And Swift Partnership Going [...]

The post Chainlink-SWIFT Partnership Update Looms: LINK Is Set To Skyrocket appeared first on Crypto Breaking News.

May 28, 2024 03:35

Analyst Van de Poppe Predicts 300% Chainlink Surge Against Bitcoin

Market Veteran Michaël van de Poppe predicts a 300% price increase for Chainlink against Bitcoin following rebound from a key…

The post Analyst Van de Poppe Predicts 300% Chainlink Surge Against Bitcoin first appeared on The Crypto Basic.

May 26, 2024 03:35

Chainlink (LINK) Price overtakes Bitcoin Cash (BCH) as it rejoins $10 Billion Valuation Club

Chainlink price broke above $17.70 on Friday May 24, to reach a 45-day peak as the whale investors on embarked…

The post Chainlink (LINK) Price overtakes Bitcoin Cash (BCH) as it rejoins $10 Billion Valuation Club first appeared on The Crypto Basic.

May 23, 2025 02:05

Why is The Graph (GRT) price up today?

The Graph price rose nearly 10% as the market warmed up to Bitcoin’s spike to a new all-time high. With BTC above $111k, The Graph’s GRT surged to $0.12. Integration with Chainlink looks to have aided the bullish momentum for The Graph. The Graph (GRT) emerged as one of the top-performing altcoins in the past […]

The post Why is The Graph (GRT) price up today? appeared first on CoinJournal.

May 21, 2024 12:05

Crypto Analyst Sounds Warning Alarm For Potential 50-60% Crash In Chainlink Price, Heres Why

Crypto analyst CrediBULL Crypto recently warned that Chainlink (LINK) could experience a 50% to 60% drop in its price. However, based on his explanation, LINK holders may not have cause to worry as such a price drop is part of the crypto tokens growth. Why Chainlink Will Experience A Price Drop CrediBULL Crypto explained in an X (formerly Twitter) post that a 50-60% drawdown is normal, natural, and healthy given that Chainlink has experienced ten months of up only and a 4x rally. The analyst expects this price drawdown to last about two to three months and suggested that Chainlink could see brief price surges, but that doesnt invalidate the current bearish trend.   Related Reading: Crypto Analysts Reveal Sub-$1 Altcoins Set To Outperform In The Bull Run In a video posted on his YouTube channel, CrediBULL Crypto further explained why he is so confident in shorting Chainlink. He alluded to the rise in the crypto tokens open interest and claimed that many levered players entered Chainlink on the pump to a major resistance level. He expects that those investors who opened longs will likely begin to close their positions as soon as Bitcoin experiences a pullback and the crypto market starts bleeding again.  The crypto analyst added that these investors will capitulate at the lows, which will bring Chainlinks price to the range lows. CrediBULL Crypto claimed that this move will bring LINK back down to $11.96, about a 30% drop from its current price levels. Based on this, he revealed that he will be looking to short Chainlink around $16, which is the likely level for rejection.  Same Expectations For Meme Coins CrediBULL Crypto also expects meme coins to experience a significant price drawdown, given the parabolic rally they have enjoyed since the beginning of the year. Meme coins Dogwifhat (WIF) and Pepe (PEPE) have been the most significant year-to-date (YTD) gainers among the top 50 crypto tokens, with price gains of over 1,400% and 500%, respectively.  The crypto analyst warned that some major meme coins have already seen their tops and will likely experience significant declines. In the YouTube video he posted, he also gave insights into how low Dogecoin, WIF, and Pepe could drop.  Related Reading: Crypto Expert Willy Woo Predicts Bitcoin Has Room To Run Here Are The Drivers For Dogecoin, he predicts that the foremost meme coin could drop to as low as $0.10. However, CrediBULL Crypto noted that he cant short Dogecoin yet because he expects a relief pump to $0.18, the range he is looking to open a short position.  Meanwhile, he predicts that WIF could drop to as low as $1.6, revealing that he will be looking to short it at $3.90 because he expects the meme coin to enjoy one last push to the upside before dropping to the downside. CrediBULL also predicts a significant price decline for PEPE. He claims the meme coin could experience a drawdown of as much as 60% since it recently hit a new all-time high (ATH). Featured image created using Dall.E, chart from Tradingview.com

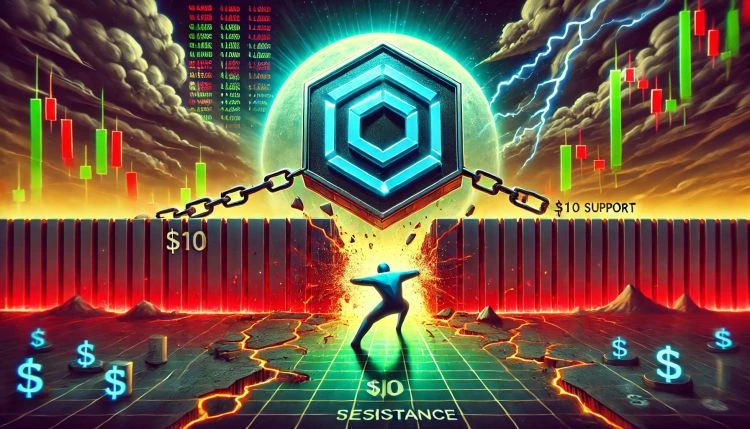
Chainlink Struggles At Key Resistance Level  $10 Support Back In Focus

Author: Sebastian Villafuerte
United Kingdom
May 20, 2025 12:05

Chainlink Struggles At Key Resistance Level $10 Support Back In Focus

After weeks of consistent buying pressure and bullish sentiment, Chainlink (LINK) is now facing a critical moment. The price failed to reclaim the $18 resistance level and has since dropped more than 16%, showing signs of weakening momentum. This recent rejection has sparked concerns among investors and traders, as downside risk intensifies in the short term. Related Reading: Cardano Whale Activity Spikes 80 Million ADA Added In 48 Hours Top crypto analyst Ali Martinez shared a technical analysis pointing to a potential retracement toward lower demand levels. According to Martinez, the recent failure to break above key resistance may trigger further selling pressure, especially if broader market conditions remain uncertain. He suggests that LINK appears to be losing its bullish structure and could be preparing to revisit lower support levels before any meaningful rebound. Chainlinks current position highlights a shift in sentiment, as bulls struggle to hold key zones. While the broader market remains relatively stable, LINK’s inability to maintain higher levels could signal an early sign of deeper correction if volume and momentum do not pick up. With volatility returning to the altcoin space, the coming days will be decisive for Chainlink. Holding above interim supports will be key if bulls want to regain control and avoid further losses. Chainlink Struggles As Momentum Fades: Downside Risks Grow Chainlink (LINK) is showing signs of exhaustion after weeks of upward movement, now trading under mounting pressure as the market grapples with renewed volatility and global financial uncertainty. Bulls remain active, defending key demand zones and continuing to call for a breakout, but fading momentum and growing fear are starting to weigh on sentiment. The failure to breach the $18 resistance level marked a turning point. Since then, Chainlink has slipped over 16%, losing critical support zones and entering a vulnerable technical position. According to Martinez, this rejection could be the start of a deeper correction. Martinezs analysis suggests that LINK is now poised to revisit the $10 level a psychological and structural support that aligns with historical price behavior. The next few trading sessions will be crucial. If bulls cant reclaim higher levels or at least stabilize price action above $14, the selling pressure could accelerate. Adding to the uncertainty is a broader lack of clarity in global markets, with investors closely watching central banks, inflation data, and geopolitical developments for guidance. While some traders are still positioning for a bounce, the current structure points to caution. Chainlinks performance in the coming days could either confirm a local top or offer a high-risk, high-reward entry point if support holds and momentum returns. Either way, the $10$12 range may soon be tested, and how LINK responds there will define its next major trend. Related Reading: XRP Flashes Bullish Signal Technical Indicator Hints At Imminent Rebound LINK Faces Pullback As Buy Pressure Weakens Chainlink (LINK) is under pressure after failing to hold above the $17.50$18 resistance zone. The daily chart shows a sharp rejection near the 200-day SMA (currently at $17.79), followed by a 16% drop that pushed LINK below the 200-day EMA ($16). This move confirms a breakdown of bullish momentum and highlights growing downside risk as traders reassess short-term expectations. Volume has picked up during the recent pullback, suggesting active profit-taking or renewed selling interest. The current support zone lies around $14.80$15.00, a region previously tested in late April and early May. If bulls fail to hold this level, the next major support rests closer to $13.20, potentially opening the door for a deeper correction toward the $10 markan area cited by analyst Ali Martinez. Related Reading: Ethereum Faces Resistance Against Bitcoin ETH/BTC Bullish Structure In Question To regain momentum, LINK must first reclaim the $16 zone and flip the 200 EMA back into support. A daily close above both the 200 EMA and SMA would shift sentiment and restore the bullish structure. Until then, traders should watch for continuation signals or further weakness, especially if broader market volatility persists. LINK is in a make-or-break phase, with the next few days likely to set the tone for its short-term trajectory. Featured image from Dall-E, chart from TradingView

May 19, 2024 03:35

Chainlink Price Forecast: Are Crypto Whales Behind the 35% LINK Rally?

Chainlink price soared to a 40-day peak of $16.7 on May 18, bringing its monthly gains to 34.7%, with on-chain…

The post Chainlink Price Forecast: Are Crypto Whales Behind the 35% LINK Rally? first appeared on The Crypto Basic.

May 18, 2024 12:05

Chainlink Becomes Crypto Winner With 21% Rally: Whats Driving This?

Chainlink (LINK) has enjoyed a sharp surge of more than 21% over the past 24 hours. Here’s what data suggests could be behind this rally. Chainlink Has Surprised Crypto Market With Breakout In The Past Day While most cryptocurrency sectors have seen flat or small green returns over the last 24 hours, Chainlink has shown a decoupling as it has observed some sharp bullish momentum in this window. Related Reading: Bitcoin Still Has A Lot Of Room To Run Before Reversal, Says Top Analyst Here is a chart that displays how LINK’s recent performance has looked like: With this sudden burst, Chainlink has touched the $16.7 mark for the first time since the crash during the first half of April. While the asset has now retraced a major part of this plunge, it still hasn’t made a full recovery. Should LINK’s bullish momentum continue, though, it may not be too long before the cryptocurrency can reclaim the $17.8 level it was trading at just before the crash. As for where Chainlink stands in the wider market, the table below shows that, based on market cap, it’s currently the 15th largest coin. LINK isn’t too far off from Polkadot (DOT) now, so it’s possible that if the price rise continues, the coin will dethrone DOT and take over the 14th spot on the list. Now, what could be the reason for Chainlink’s sudden decoupling from the rest of the market? Data from the on-chain analytics firm Santiment may perhaps provide some hints. The Total Number Of LINK Whales Is At A 6-Month High Now As pointed out by Santiment in a post on X, Chainlink investors holding 100,000 tokens or more of the asset in their balance have recently seen their address count increase. This cutoff is equivalent to around $1.67 million at the current LINK exchange rate. Investors with holdings this large are popularly referred to as whales. Whales can be influential entities in the market because they can move a large amount of volume in a short span of time. As such, their behavior may be worth monitoring. From the graph, it’s visible that Chainlink’s total number of whale addresses has hit 564 after the latest rise, which is the highest the metric has been since October of last year. This increase in the number of whales on the network may be partially behind the surge that LINK has just seen. In the same chart, the analytics firm has also attached the data for another indicator: social dominance. This metric tells us about the share of cryptocurrency-related social media discussions that LINK occupies right now. Related Reading: XRP & Cardano Whales Load Up Bags: Preparation For Altcoin Rally? This indicator has shot up alongside this rally, implying the interest around the coin has spiked. Historically, such a rise in attention has been a bearish sign for the asset, so it remains to be seen if these high values will be maintained. “If social dominance calms and FOMO doesn’t take over, bullish conditions are ahead,” notes Santiment. Featured image from iStock.com, CoinMarketCap.com, Santiment.net, chart from TradingView.com

Your Crypto Gateway

Claim 1,000
Free WCG Coins

World Crypto Global opens the door to digital freedom for everyone.
Manage your free WCG Coins securely—where simplicity meets global accessibility.

11 bn

FREE CRYPTO COINS

8.9 bn

AVAILABLE FOR RESERVATION

2.1 bn+

ALREADY ALLOCATED

× WCG Coin

🎉 Get 1,000 WCG Coins

No fees. No catch. Your crypto journey starts here.