W o r l d . C r y p t o . G l o b a l

Loading

Welcome at World Crypto Global. This portal is packed with useful content and resources to built out your own crypto skills. WorldCrypto is a site member of Gabriel Vega Network.

Contact Info

CATEGORY: demand


Bitcoin Retests Key Support Amid Growing U.S. Demand and Market Optimism

Author: Arslan Tabish
Estonia
Aug 27, 2024 02:30

Bitcoin Retests Key Support Amid Growing U.S. Demand and Market Optimism

Bitcoin has been participating in a retest of its Pi Cycle Moving Average (MA) after recently achieving a daily close above this key technical indicator. In a recent X post, Crypto Rover explained that this retest is crucial as it could define whether BTC could build a new support at the Pi Cycle MA to […]

Jul 08, 2024 12:05

Bitcoin Critic Calls Institutional Demand A Myth Following Recent Price Slump

Popular Bitcoin critic Peter Schiff dismisses claims of growing institutional interest in the maiden cryptocurrency. Schiffs challenging statement comes following the recent Bitcoin market sell-off which resulted in a 10% price decline on Friday. Related Reading: Market Expert Predicts When Bitcoin Price Will Reach Its Cycle Highs Peter Schiff Claims Little Institutional Demand For Bitcoin According to blockchain analytics platform Lookonchain, the German and US governments, and defunct crypto exchange Mt. Gox have moved a combined 17,788 Bitcoin valued at $1.08 billion to exchanges since June 19.  In particular, the German government has sold parts of its BTC holdings every day since the start of July transferring out a substantial 3,000 BTC, worth around $175 million, on Thursday. The constant sell-off by the German and US authorities coupled with Mt. Gox repayments to creditors which are expected to be sold, soon resulted in massive selling pressure on BTC, forcing the tokens price down from $60,097 on Thursday to as low as $53,971 on Friday. Commenting on this event, Schiff stated in an X post on Saturday, that Bitcoins price slump demonstrated that the institutional demand for the market leader was overestimated. While the Bitcoin critic acknowledged that market sell-off contributed to the assets decline, he also emphasized the absence of a high institutional demand, which if existed, should jump at the chance to buy the massive amount of Bitcoin that has been sold. Schiffs comments are likely targeted at popular sentiments that Bitcoins institutional demand has been on the rise following the introduction of the Spot Bitcoin ETFs in January.  Notably, the market leader embarked on an upward trend in the first quarter of 2024 rising to a new all-time high of $73,750, a development which coincided with the rapid growth of the Spot Bitcoin ETF market which hit a $10 billion trading volume in March. Related Reading: Bitcoin Woes Not Over? Analyst Predicts Further Crash To $47,000 Bitcoin Poised For Market Rebound, Analyst Says In other news, popular crypto analyst Rekt Capital has postulated that Bitcoin may be preparing for a market recovery following the recent price dip. In an X post on Saturday, Rekt Capital noted that Bitcoin closed its daily trading above $56,750 allowing the token to continue to remain within the range low area of $60,600. According to the analyst, if BTC continues to cluster around the price region, it could soon launch a price rebound reaching as high as $71,000. At the time of writing, the premier cryptocurrency continues to trade at $58,189 with a 2.45% increase in the last day. However, BTCs daily trading volume remains down by 63.35% and is valued at $20.61 billion. Featured image from Market Insider, chart from Tradingview

Record $39.4B Bitcoin open interest suggests imminent price breakout

Author: Cointelegraph by Zoltan Vardai
United States
Jul 30, 2024 12:00

Record $39.4B Bitcoin open interest suggests imminent price breakout

Open interest is often used to gauge the interest and liquidity behind an asset. In Bitcoins case, the surge in open interest could signal an imminent breakout.

Direct client demand driving growth in BlackRock's Bitcoin ETF so far

Author: Cointelegraph by Derek Andersen
United States
Jul 26, 2024 12:00

Direct client demand driving growth in BlackRock's Bitcoin ETF so far

BlackRock head of digital assets Robert Mitchnick talked ETFs with Bloombergs James Seyffart at Bitcoin 2024.

BitGo integrates Stacks for Bitcoin rewards, following institutional BTC demand

Author: Cointelegraph by Zoltan Vardai
United States
Jul 19, 2024 12:00

BitGo integrates Stacks for Bitcoin rewards, following institutional BTC demand

The integration comes due to growing institutional demand for Bitcoin, according to Stacks ecosystem investor lead.

Bitcoin mining to boost UKs renewable energy grid

Author: Cointelegraph by Savannah Fortis
United States
Jul 11, 2024 12:00

Bitcoin mining to boost UKs renewable energy grid

A UK-based Bitcoin organization is advocating to the new Labour government to implement a Bitcoin mining-based strategy to combat a growing problem of local electricity demand.

Jun 22, 2024 01:25

Bitcoin Blockspace: Dynamics of System Resource Use

A look at the nature of different second layer systems, and how their different needs for blockspace will interact with each other and Bitcoin.

May 06, 2025 05:50

Trump to Host Memecoin Gala Dinner Despite Criticism and Impeachment Demands

The value of the stablecoin associated with former President Donald Trump has seen a significant increase following a controversial cryptocurrency deal with a senator from the United Arab Emirates (UAE). Senator Warren has raised concerns about the shady nature of this deal, questioning the motives behind the sudden surge in the stablecoin’s value. The partnership [...]

May 20, 2025 12:05

XRP Price Confirms Bullish Reversal Setup With This Demand Zone

A new technical analysis reveals that the XRP price has just confirmed a bullish reversal set-up on the 1-hour chart, following a strong rebound from a critical demand zone. This development has raised expectations of a potential short-term rally, as a crypto analyst forecasts higher targets in the coming sessions.  XRP Price Bullish Reversal In Sight FrankFx14, a pseudonymous TradingView crypto analyst, has revealed that the XRP price has found solid footing between the $2.31246 and $2.37028 support area. The analyst also identified this range as a historically significant demand zone where previous buying pressure has consistently reversed price declines.   Related Reading: XRP Price Explosion To $5.9: Current Consolidation Wont Stop XRP From Growing As XRPs price dipped into this demand zone on May 17, bulls stepped in, defending the lower boundary and triggering a sharp rejection. According to the analyst, the confirmation came with a bullish engulfing candle a widely recognized signal for a potential trend reversal.  Trading at approximately $2.378 at the time of the chart analysis, XRP is now holding the top of this key demand zone, indicating renewed buying interest. The TradingView analyst has suggested that as long as the price remains above $2.37028, XRPs bullish outlook remains intact.  According to the TradingView expert, the presence of XRPs bullish reversal setup is supported by the LuxAlgo Supply and the Demand Visible Range indicator. With XRPs price action breaking upward from its local bottom, the analyst points to $2.4939 as the next key level to watch. This price marks the mid-level of a previous supply zone and a likely resistance area. The next bullish target for XRP is $2.6031. The analyst has described this point as a major supply zone where sellers previously gained control. These price zones are now considered primary targets for short-term traders positioning for potential upside.  FrankFx14 has urged traders to wait for further confirmation, highlighting that strong trading volume and candle closes above the $2.375 level would be the key to validating XRPs bullish continuation.  Analyst Forecasts Mega Rally For The Altcoin XRP has officially broken out of a long-term Falling Wedge pattern, sparking optimism, with analysts like Crypto Avi believing that a mega rally could be on the horizon. According to his chart analysis, the token is now poised for a mid-term surge, targeting new all-time highs around $4.90.  Related Reading: When Will The XRP Price Explode? Timeline Shared By Crypto Pundit Presently trading at $2.29, a surge to this bullish target would represent a significant increase of 114% for the altcoin. The chart illustrates that the cryptocurrency has been trapped in a downward-sloping channel since late 2024, consolidating in a pattern seemingly recognized as bullish. XRP is currently testing the Falling Wedges breakout level, which may now act as support. A sustained move above this level could confirm the analysts bullish thesis, paving the way for a potential climb toward $4.90. Featured image from Getty Images, chart from Tradingview.com

May 19, 2025 05:50

Pavel Durov defiantly refuses EU demands to censor Romanian election information

Pavel Durov, the CEO of Telegram, has firmly rejected the European Union’s attempts to pressure the messaging platform to censor content related to the recent Romanian election. Durov’s refusal to comply with EU demands showcases his commitment to protecting freedom of speech and expression on his platform. In a bold move, Durov publicly stated that [...]

May 13, 2025 12:05

Bitcoin Price Targets $110,000 All-Time High After Consolidation Trend Ends

Over the past three days, Bitcoin has hovered between $103,000 and $104,500, creating a narrow channel after a notable rally that saw it break above $100,000 last week. Technical analysis of the daily candlestick chart shows the formation of a minor impulsive wave from $103,000, which may mark the final end of the recent consolidation and the beginning of a fresh rally towards new highs.   Notably, recent price action in the past 12 hours or so has seen the gradual end of the consolidation, and attention is now turning to the next psychological level at $110,000.  Analyst Sees Breakout As Signal For Upside Continuation In a post shared on the social media platform X, crypto analyst CrediBULL explained the logic behind his current long trade setup, pointing out that Bitcoin has broken away from its three-day consolidation zone with an early impulse that started at the $103,000 level. His analysis predicted that this movement could be the start of a much larger leg upward, especially if the current price structure holds without falling back into a local demand zone between $101,000 and $102,000. Related Reading: Bitcoin 6-Month Flight Plan To $188,000, Heres The Roadmap According to CrediBULL, the current trade has a clean invalidation level just below the impulse origin, allowing for a tight stop loss. This setup yields a high reward-to-risk ratio exceeding 5:1, with an upside target of $110,660, as illustrated in the chart. If this breakout is genuine, it could be a signal that Bitcoin is preparing for an aggressive push toward new all-time highs. On the other hand, CrediBULL cautioned that if the current move proves to be a deviation and price falls below the impulse origin, focus should shift to the local demand zone around $101,800. The chart supports this with a clearly marked green area labeled local demand. This is the next major support if Bitcoin bulls fail to hold the current price levels. $110,000 Bitcoin Target In Sight With Increasing Market Momentum According to the crypto analyst, his prediction of the next move to $110,000 has at least a 20% chance of playing out. These odds are quite nice, considering the unpredictable nature of the crypto market.  Related Reading: Whats Driving The Bitcoin Price Recovery Above $100,000 And Is It Sustainable? Notably, price action in the past 24 hours has seen the leading cryptocurrency break above $105,000 again, peaking at an intraday high of $105,503 before easing slightly. This move strengthens the case that the recent consolidation phase may have concluded, and a successful move above $110,000 before the end of the week is underway. At the time of writing, Bitcoin is trading at $104,428. A successful rally to the $110,660 target would represent a 6% gain from the current price, while downside risk is capped below the $103,000 level. Featured image from Getty Images, chart from Tradingview.com

May 02, 2025 05:55

Solv CEO Reveals Surge in Bitcoin Yield Demand as Institutions Drive Liquidity Boom

Bitcoin Yield Demand Surges as Institutions Seek Liquidity in DeFi As Bitcoin continues to dominate the cryptocurrency market, institutions are increasingly looking towards decentralized finance (DeFi) platforms to satisfy their growing yield demand. The DeFi space has been experiencing a surge in popularity as traditional financial institutions seek alternatives for generating returns in a low-yield [...]

May 02, 2024 01:25

DEMAND Pools CEO Says The Time To Decentralize Bitcoin Mining Is Now

Alejandro De La Torre believes Bitcoin mining is dangerously centralized and plans to put power back into the hands of solo miners with DEMAND.

Massive Chainlink Demand Wall At $6.26 As 90K Investors Buy 376M LINK

Author: Sebastian Villafuerte
United Kingdom
Apr 06, 2025 12:05

Massive Chainlink Demand Wall At $6.26 As 90K Investors Buy 376M LINK

Chainlink is currently trading at critical demand levels as the broader crypto market faces ongoing pressure. With global financial conditions growing increasingly fragile, volatility continues to dominate across risk assets. Geopolitical tensions and sweeping tariffs imposed by world leaders including recent moves by US President Donald Trump have only added to the uncertainty, shaking investor confidence and stalling bullish momentum in crypto. Related Reading: Ethereum Whales Buy the Dip Over 130K ETH Added In A Single Day Amid this backdrop, Chainlink has struggled to reclaim higher ground, instead consolidating around a key support zone. According to on-chain data, LINK’s most critical demand wall sits at $6.26. This concentration of buying interest marks a potentially strong support area that bulls must defend to avoid a deeper correction. As markets react to shifting macroeconomic signals, Chainlinks ability to hold this demand zone could determine its next move. If this level fails, additional downside may follow. But if it holds, it could serve as the base for a potential rebound once sentiment improves. For now, all eyes remain on LINKs price action as it tests one of the most important accumulation zones on its chart. Chainlink Consolidates As Next Demand Level Lies Below Despite broader market uncertainty, Chainlink remains one of the most prominent players in the real-world asset (RWA) tokenization narrative a sector expected to see substantial growth in the coming years. As traditional finance continues exploring blockchain infrastructure, Chainlinks oracle technology and decentralized data feeds remain essential to bridging off-chain assets with on-chain applications. However, in the short term, LINKs price action has mirrored the broader crypto market downturn. Chainlink is down 17% since March 26, with current price action showing continued uncertainty. LINK is consolidating just above a key demand level, and although bulls have struggled to regain momentum, some analysts believe the worst may be behind. Fears of ongoing selling pressure persist, but overall market conditions suggest that the sharpest drawdowns could be over. Supporting this view, Ali Martinez shared on-chain data revealing that the most critical demand wall for Chainlink sits at $6.26, where nearly 90,000 investors accumulated approximately 376 million LINK tokens. This strong accumulation zone may provide the foundation needed for price stabilization and a potential reversal, especially if broader market sentiment begins to recover. While analysts still warn of a possible deeper correction, the fading intensity of selling and the presence of strong support indicate growing resilience. Chainlinks long-term fundamentals, particularly its leadership in the RWA space, continue to attract attention even during times of market stress. If the $6.26 level holds, LINK could be well-positioned for a rebound once bullish momentum returns across the crypto landscape. Related Reading: Bitcoin Rejected At Descending Resistance Again Is $78,600 Still In Play? LINK Holds Solid Ground As Bulls Eye Recovery Confirmation Chainlink (LINK) is trading at $12.8 after enduring several days of heavy selling pressure. Despite the recent downside, bulls have managed to defend the crucial $12.3 support level, which has so far acted as a solid demand zone. This hold is a key short-term victory, but the broader trend remains fragile as LINK struggles to regain upward momentum. To confirm a potential recovery rally, bulls must push LINK above the $14.6 level a critical resistance zone that aligns with both the 4-hour 200-day moving average (MA) and the exponential moving average (EMA). A decisive breakout above this area would signal renewed strength and potentially attract more buyers back into the market. Related Reading: SUI Forms Inverse Head And Shoulders Can Bulls Break Above $2.52? However, the risk of further downside still looms. If LINK loses its grip on the $12.3 demand zone, the next logical support could lie near the $10 mark, a psychological level that hasnt been tested since early Q4 2023. With the broader crypto market still under pressure and sentiment cautious, LINK remains at a crossroads. The coming days will be pivotal as bulls attempt to reclaim momentum and avoid slipping deeper into correction territory. Featured image from Dall-E, chart from TradingView

Ethereum Consolidates Against Bitcoin  Dominance Shift On The Horizon?

Author: Sebastian Villafuerte
United Kingdom
Apr 30, 2025 12:05

Ethereum Consolidates Against Bitcoin Dominance Shift On The Horizon?

Ethereum is currently trading above the $1,800 mark, holding strong after weeks of volatility but struggling to reclaim the critical $2,000 resistance level. Bulls have managed to push prices higher, yet momentum must continue building for a full breakout. Analysts are closely watching Ethereums movements, noting that the market is preparing for a decisive move that could shape the coming weeks. Global macroeconomic tensions remain a challenge, but optimism is growing across crypto markets. Related Reading: Ethereum Shows 4H Bearish Divergence Can Bulls Hold $1,750? Top analyst Daan shared insights revealing that ETH is still consolidating within its current range against Bitcoin (BTC). According to his analysis, hes watching the local range high around the 0.02 BTC level closely. A successful break above this key range could signal a major shift in market dynamics, potentially sparking a multi-week decline in Bitcoin dominance led by Ethereum. This would likely trigger an increased risk appetite toward altcoins, as investors rotate capital away from Bitcoin and into higher-risk assets. For now, Ethereum continues to move within its range, and bulls must act fast to reclaim momentum. If ETH can push through these resistance levels, the stage would be set for a major rally across the altcoin sector, with Ethereum leading the charge. Ethereum Battles Resistance As Bulls Aim For Breakout Against BTC Ethereum is trading at a critical level, and all eyes are on whether bulls can reclaim higher supply zones to confirm a bullish reversal. After recovering strongly from local lows, ETH has begun forming a bullish structure in low time frames. However, persistent selling pressure still threatens to invalidate this structure unless buyers step in with strength. Momentum has shifted, and many analysts expect a decisive move soonbut there’s also caution, with some warning that a failed breakout could drag Ethereum back to the $1,500$1,600 demand zone. Daan shared a key perspective on Ethereums performance relative to Bitcoin. He noted that ETH/BTC is still consolidating within a defined range, with the local range high near 0.02 BTC acting as the most important resistance. A successful breakout above this level would likely trigger renewed interest in altcoins and could mark the start of a Bitcoin dominance downtrend led by ETH. According to Daan, such a move would increase risk appetite across the board. However, he also warns that if ETH loses the 0.0185 BTC level, it could confirm a continuation of the current downtrend. For now, Daan is closely watching how the range develops. A confirmed breakout followed by a structure flip would offer a much clearer bullish signal. Related Reading: Solana Forms Textbook Cup And Handle Pattern Massive Breakout Ahead? Ethereum Consolidates As Bulls Eye Critical Breakout Ethereum is trading at $1,830 after spending several days consolidating within a tight range between $1,850 and $1,750. This narrow trading channel has kept price action muted, but it also signals that a decisive move could be approaching. Analysts agree that whichever side breaks out first will likely set the tone for Ethereums price action over the coming weeks. Bulls have managed to defend the $1,750 support multiple times, but their real challenge lies ahead: reclaiming the $2,100$2,000 zone. This range is seen as critical for reversing the broader downtrend and establishing a more sustainable recovery rally. A strong breakout and daily close above $1,850 would be an encouraging signal, but failure to follow through could quickly lead to another leg down. Related Reading: Solana Will Face A Pivotal Moment In May Bear Market Bounce Or Bull Market Dip? On the bearish side, if Ethereum fails to hold the $1,800$1,750 range and experiences a false breakout above $1,850, it could trigger a deeper correction toward the $1,600 or even $1,500 level. Traders and investors are watching closely, as the coming days could mark a major turning point for Ethereums medium-term structure. Featured image from Dall-E, chart from TradingView

Apr 27, 2025 05:50

US Senator Demands Trump Impeachment, Cites Memecoin Dinner

A United States senator has publicly voiced support for the impeachment of former President Donald Trump, referencing a controversial incident involving a meme cryptocurrency at a dinner event. The senator pointed to the use of a meme coin during the dinner as evidence of Trump’s lack of seriousness and competence in handling political matters. The [...]

The post US Senator Demands Trump Impeachment, Cites Memecoin Dinner appeared first on Crypto Breaking News.

Apr 03, 2025 06:00

US lawmakers demand SEC to disclose information on crypto company supported by Trump family

Lawmakers in the United States are calling on the Securities and Exchange Commission (SEC) to take action against Mark Uyeda and World Liberty Financial following allegations of misconduct brought against them by President Donald Trump. The SEC has been urged to investigate Uyeda and World Liberty Financial for potential violations of securities laws. This move [...]

The post US lawmakers demand SEC to disclose information on crypto company supported by Trump family appeared first on Crypto Breaking News.

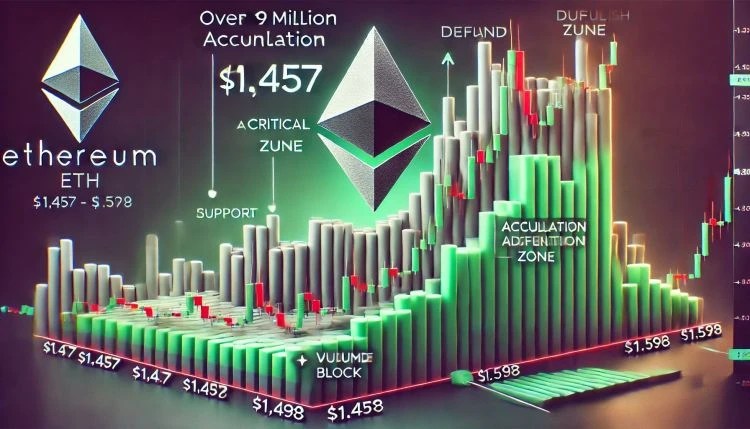
Over 1.9M Ethereum Positioned Between $1,457 And $1,598  Can Bulls Hold Support?

Author: Sebastian Villafuerte
United Kingdom
Apr 17, 2025 12:05

Over 1.9M Ethereum Positioned Between $1,457 And $1,598 Can Bulls Hold Support?

Ethereum is trading above the $1,500 mark after a week of heightened volatility and continued global trade uncertainty. Macroeconomic tensions driven by tariffs, shifting policies, and weakened investor sentiment continue to weigh heavily on crypto markets. Despite the recent bounce, Ethereum’s price action still hints at a broader downtrend, with bulls struggling to reclaim key resistance levels that could trigger a meaningful recovery. Related Reading: Dogecoin Whales Buy 800 Million DOGE in 48 Hours Smart Money Or Bull Trap? However, there are signs of potential strength ahead. If bulls manage to push ETH above immediate resistance zones, a bullish momentum shift could emerge. Market watchers are closely monitoring cost basis levels to identify where strong demand may resurface. According to data from Glassnode, Ethereum’s Cost Basis Distribution reveals three key price clusters likely to shape short-term action. Among them, the $1,546 level stands out as the most significant, with 822,440 ETH previously accumulated in this range. A successful hold or breakout above this zone could provide a solid foundation for a larger recovery. For now, Ethereums outlook remains cautiously neutral, with bulls needing to reclaim higher levels to shift sentiment and challenge the broader downtrend. Ethereum Key Cost Basis Levels Could Define Price Action Ethereum has lost over 50% of its value since early February, setting the stage for a challenging but potentially pivotal recovery phase. After months of heavy selling pressure, ETH is now trading just above the $1,500 mark, a zone that could serve as a springboard if bullish momentum builds. While the broader market has shown signs of recovery, Ethereums underwhelming price action continues to test investor patience. Still, analysts believe a recovery rally is possible, especially if macroeconomic sentiment improves. Persistent global trade tensions, ongoing tariff battles, and US foreign policy shifts continue to inject volatility into financial markets. These factors have suppressed demand for risk assets like Ethereum, but some believe that the worst may be behind. Glassnodes on-chain data offers a more detailed look at Ethereums short-term outlook. According to their Cost Basis Distribution analysis, three price clusters are likely to shape ETHs near-term price action. Around $1,457, roughly 408,000 ETH were previously accumulated. At $1,546, over 822,000 ETH sit, making it one of the most critical levels. Finally, approximately 725,000 ETH were acquired around $1,598. These clusters reflect areas of high on-chain activity and are expected to act as support or resistance zones during the current phase of price consolidation. A breakout above the $1,600 level could trigger a more significant move toward $1,800 and beyond. For now, Ethereums price remains range-bound, but market participants are watching these levels closely for signs of a decisive shift. Related Reading: Ethereum Metrics Reveal Critical Support Level Can Buyers Step In? ETH Faces Crucial Resistance As Bulls Fight to Regain Momentum Ethereum is currently trading at $1,580 after failing to break above the $1,700 resistance level, signaling that bullish momentum remains weak. Despite a brief recovery from recent lows, ETH has struggled to reclaim higher ground, and key resistance levels continue to weigh on price action. For bulls to confirm the start of a true recovery phase, Ethereum must push above the 4-hour 200 MA and EMA, both hovering around $1,820. A decisive move above these indicators would indicate renewed market confidence and open the door for a push toward critical demand levels around $2,000. However, the risk of further downside remains. If Ethereum loses the $1,500 support level, selling pressure could accelerate, potentially driving the price below the $1,400 mark. This zone served as a key level in early 2023 and could be retested if bearish momentum builds. Related Reading: Dogecoin Gears Up For A Breakout To $0.29: Can Bulls Hold Key Support? With macroeconomic uncertainty and trade tensions still dominating the narrative, investors remain cautious. The next few trading sessions will be critical for ETH, as it hovers between potential recovery and the threat of renewed decline. Traders should watch for volume spikes and reaction around the $1,700 and $1,500 zones to assess the next move. Featured image from Dall-E, chart from TradingView

Apr 17, 2024 12:05

Bitcoin Has Next Major Demand Zone At $56,000: Brace For Impact?

On-chain data shows the next major Bitcoin demand zone is around $56,000, a level BTC might end up revisiting if the decline continues. Bitcoin Has Next Major On-Chain Support Around $56,000 According to data from the market intelligence platform IntoTheBlock, BTC’s recent drawdown has meant that it may end up having to rely on the price range around $56,000 for support. Related Reading: Bitcoin Whales Showing Different Behavior From Past Cycles, But Why? In on-chain analysis, a level’s potential as support or resistance is based on the total number of coins that the investors last acquired there. Below is a chart that shows what the various price ranges around the current spot price of the cryptocurrency look like in terms of this cost-basis distribution. The data for the BTC acquisition distribution across the various price levels | Source: IntoTheBlock on X In the graph, the size of the dot represents the amount of Bitcoin that was purchased inside the corresponding price range. It would appear that the $63,000 to $64,890 level is currently thick with investors. To be more particular, 1 million investors acquired 530,000 BTC inside this range. Generally, whenever the asset retests the cost basis of any investor, they may become more likely to make some kind of move, due to the importance the level holds for them. Investors who were in profits just prior to the retest may be willing to make further bets, believing that if this level was profitable in the past it might be so again in the future. Naturally, this buying effect would only be relevant for the market if a large amount of investors acquired coins inside a tight price range. The $63,000 to $64,890 range qualifies for this. The range should have acted as a support point for the coin, but BTC has recently slipped under it, possibly suggesting that this support level may have broken down. As IntoTheBlock has highlighted in the chart, the next major range of potential support is the $55,200 to $57,100 range. Thus, should the current drawdown continue, this may be the next relevant range. “While this doesn’t mean that Bitcoin has to go this low, it is good to keep this range in mind while price is exploring recent lows,” notes the analytics firm. A decline to the average price of this range ($56,000) would mean a drawdown of almost 10% from the current spot value of the coin. Related Reading: Bitcoin Rebounds After Nearing Cost Basis Of Short-Term Whales Before this level, though, there is another interesting on-chain level that BTC could end up revisiting. As analyst James Van Straten has pointed out in an X post, the Realized Price (the average cost basis) of the short-term holders is around $58,800 right now. Looks like the value of the metric has been going up since a while now | Source: @jvs_btc on X The short-term holders (STHs) here refer to the investors who bought within the past 155 days. This group’s Realized Price has been at an important level historically during bull runs, as the asset has often found support at it. Breaks under it have, in fact, usually led to bearish transitions in the past. “If we drop below this, I will concede to a bear market similar to May 2021,” says Straten. BTC Price Bitcoin has registered a decline of almost 7% over the past 24 hours and in the process, has lost any recovery it had made earlier. Now, BTC is trading around $62,100. The price of the asset appears to have been going down recently | Source: BTCUSD on TradingView Featured image from Kanchanara on Unsplash.com, Glassnode.com, chart from TradingView.com

Mar 08, 2024 05:50

Mark Cuban: Bitcoin Demand to Outpace Supply, BTC Is a Great Store of Value

Billionaire investor Mark Cuban, a minority owner of the National Basketball Association (NBA) team Dallas Mavericks, expects the price of bitcoin to go up due to the supply-demand dynamic. “I do feel that the demand is going to exceed the number of people selling,” he explained, adding that bitcoin is “a great store of value.” [...]

The post Mark Cuban: Bitcoin Demand to Outpace Supply, BTC Is a Great Store of Value appeared first on Crypto Breaking News.

Your Crypto Gateway

Claim 1,000
Free WCG Coins

World Crypto Global opens the door to digital freedom for everyone.
Manage your free WCG Coins securely—where simplicity meets global accessibility.

11 bn

FREE CRYPTO COINS

8.9 bn

AVAILABLE FOR RESERVATION

2.1 bn+

ALREADY ALLOCATED

× WCG Coin

🎉 Get 1,000 WCG Coins

No fees. No catch. Your crypto journey starts here.