W o r l d . C r y p t o . G l o b a l

Loading

Welcome at World Crypto Global. This portal is packed with useful content and resources to built out your own crypto skills. WorldCrypto is a site member of Gabriel Vega Network.

Contact Info

CATEGORY: dotusdt


Jun 08, 2024 12:05

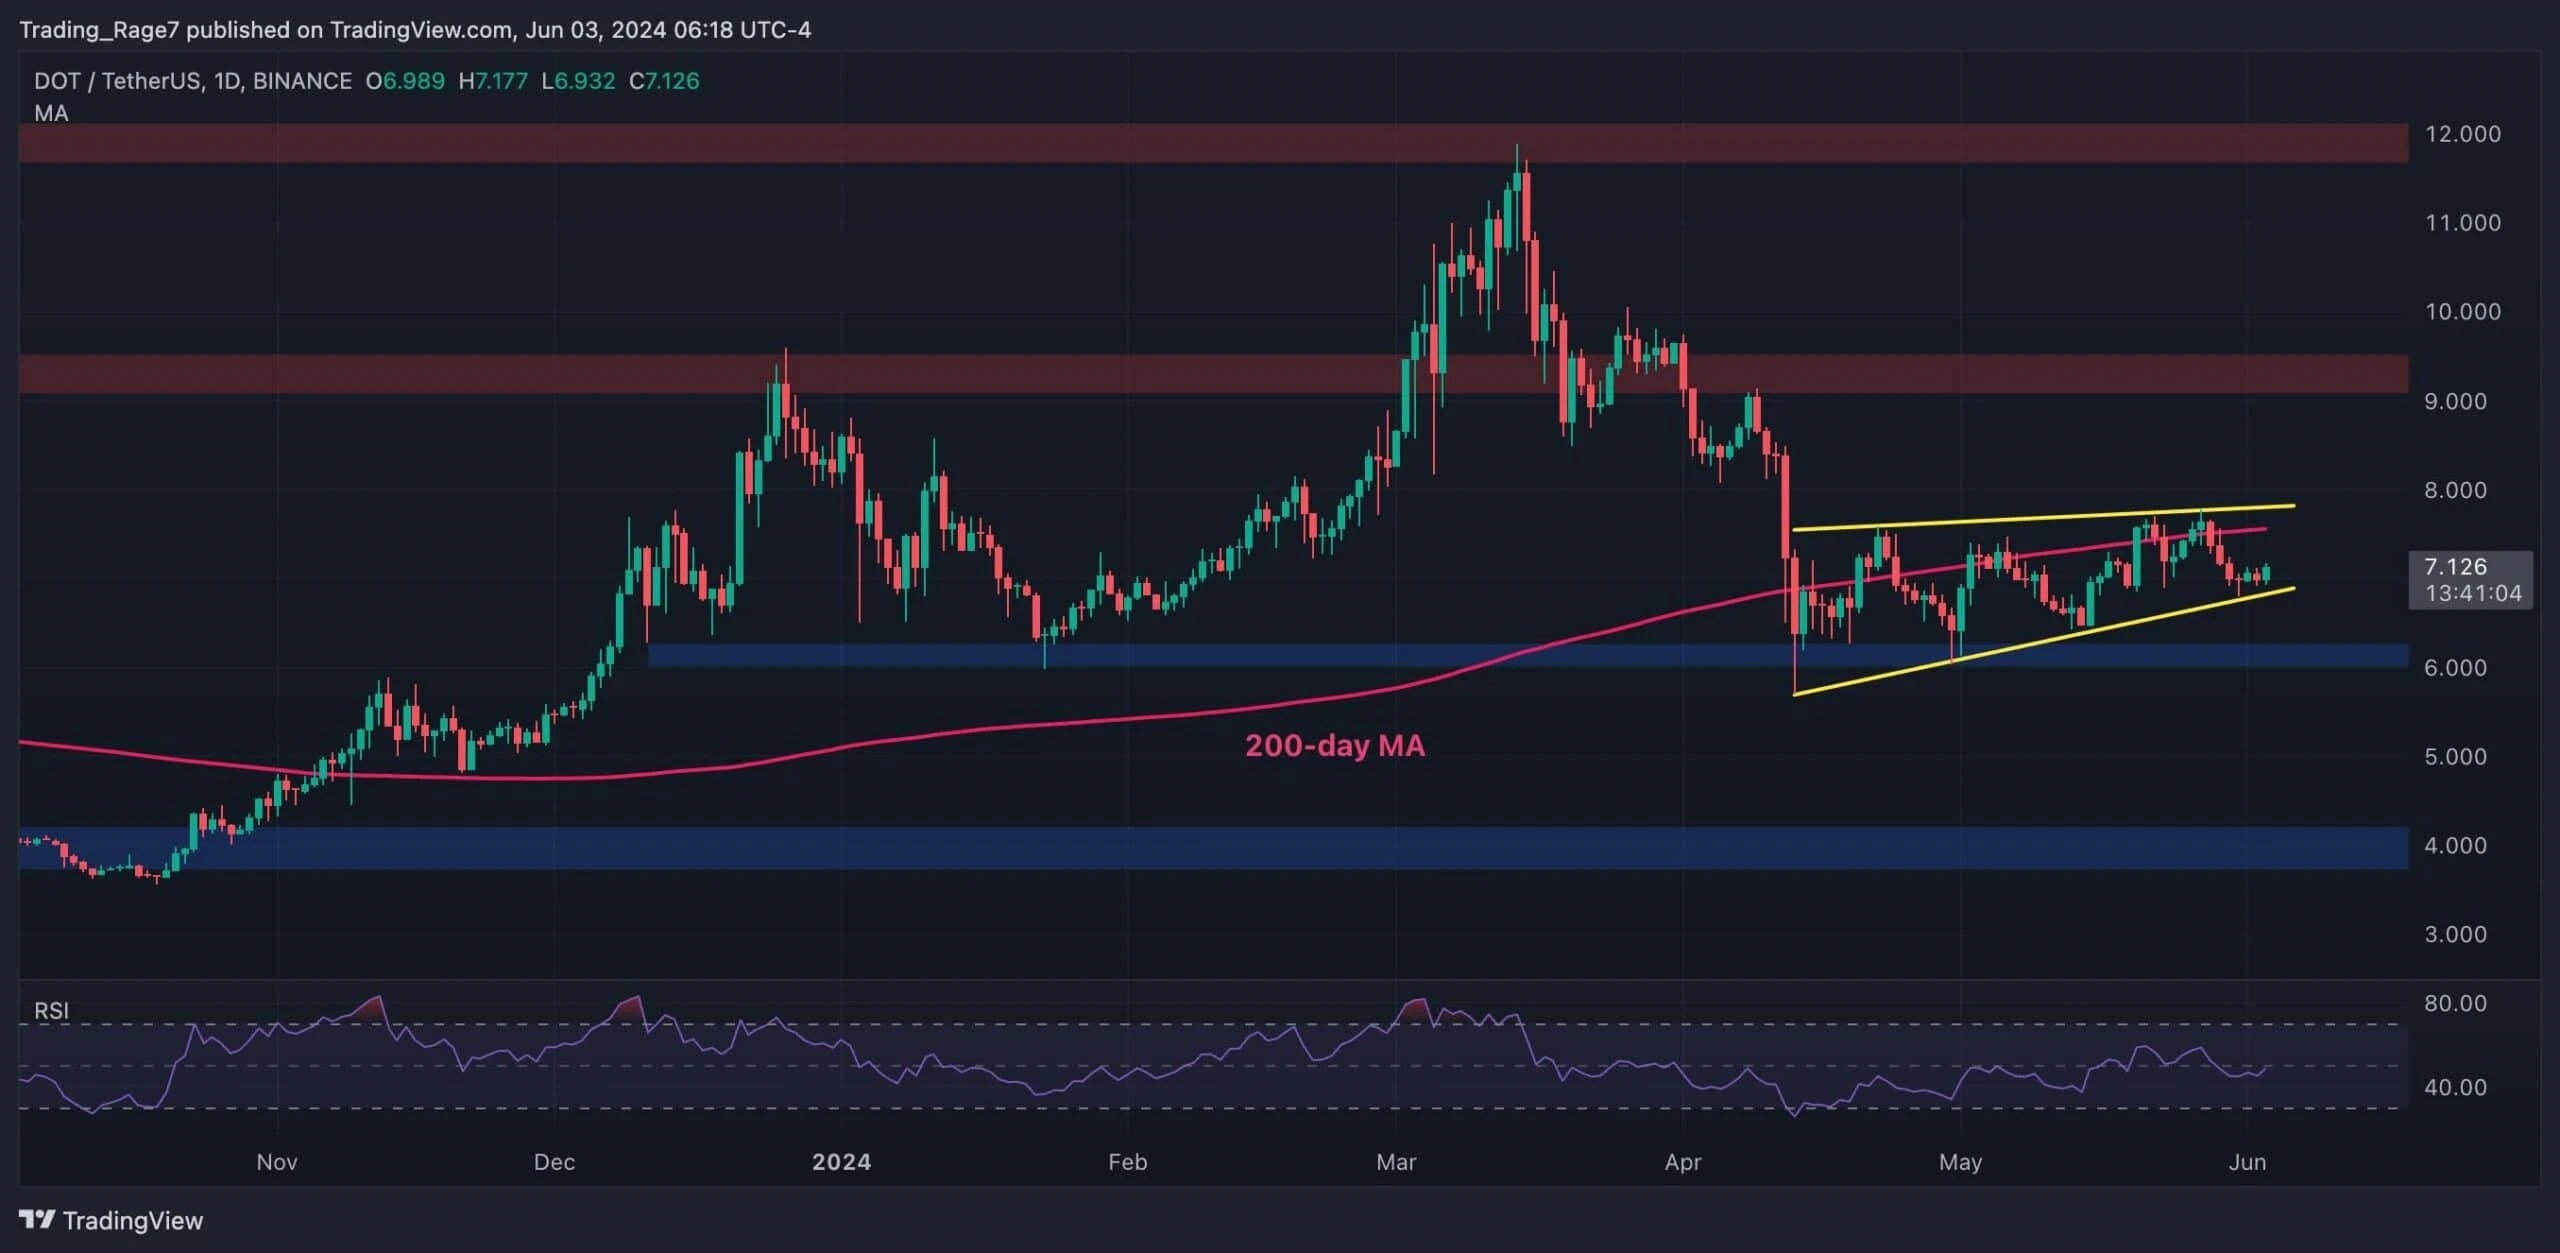
Polkadot (DOT) Forms Rising Wedge Pattern, Bullish Or Bearish?

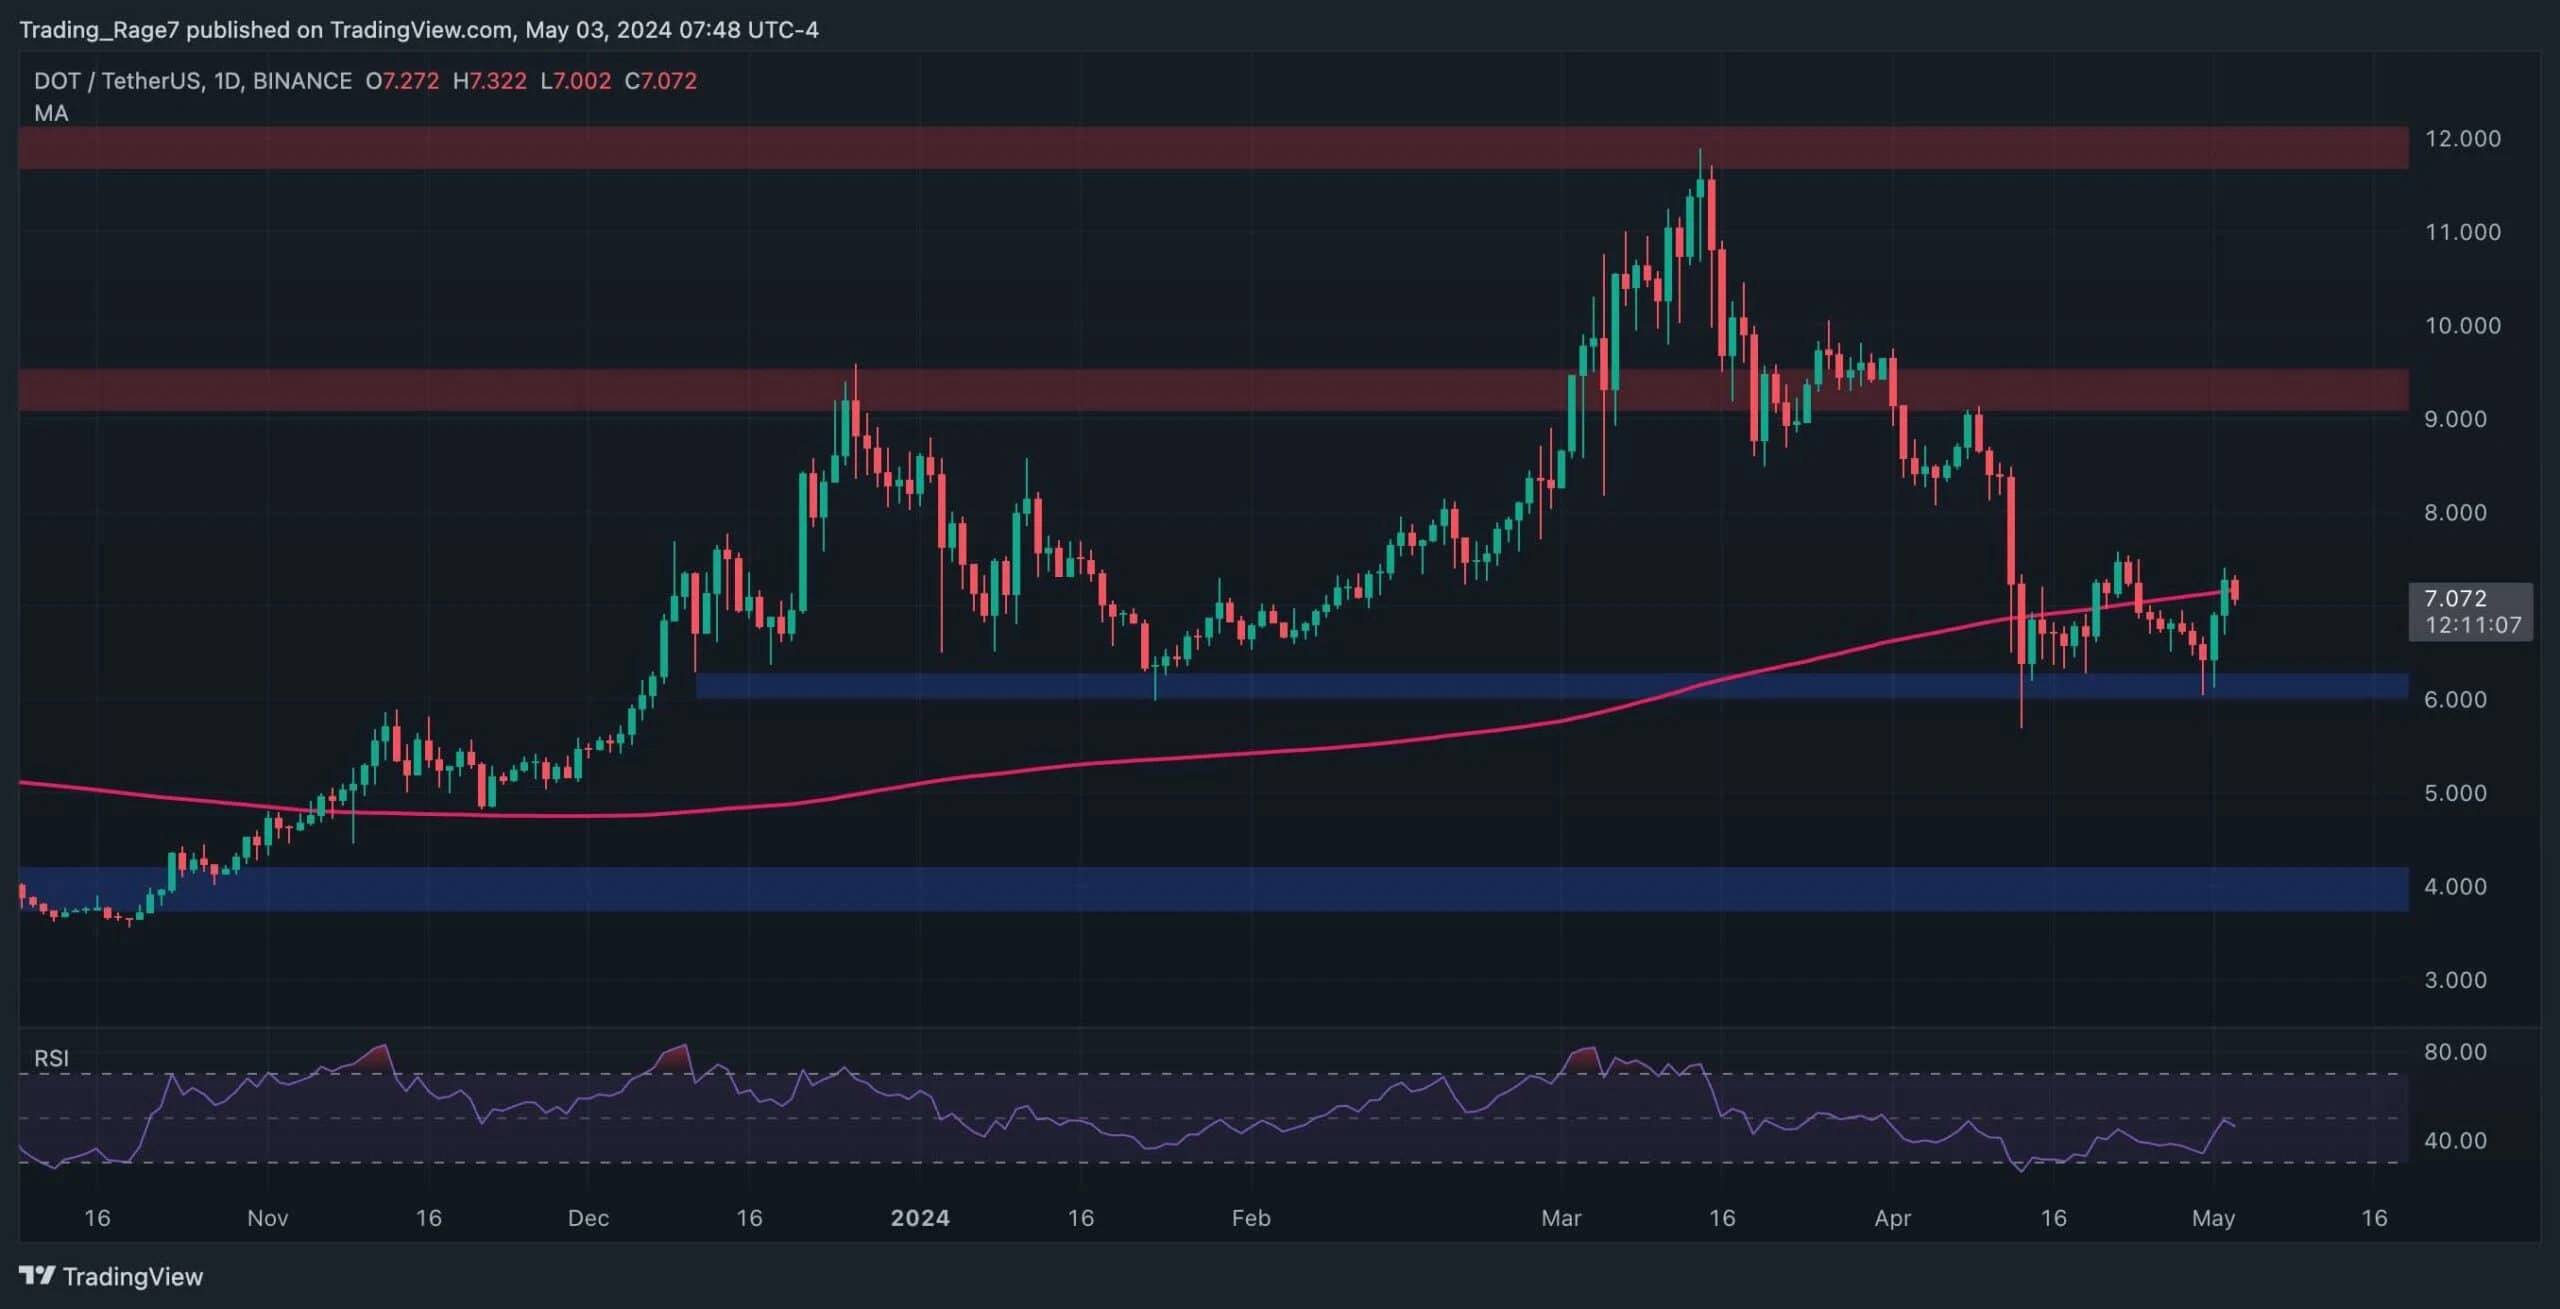
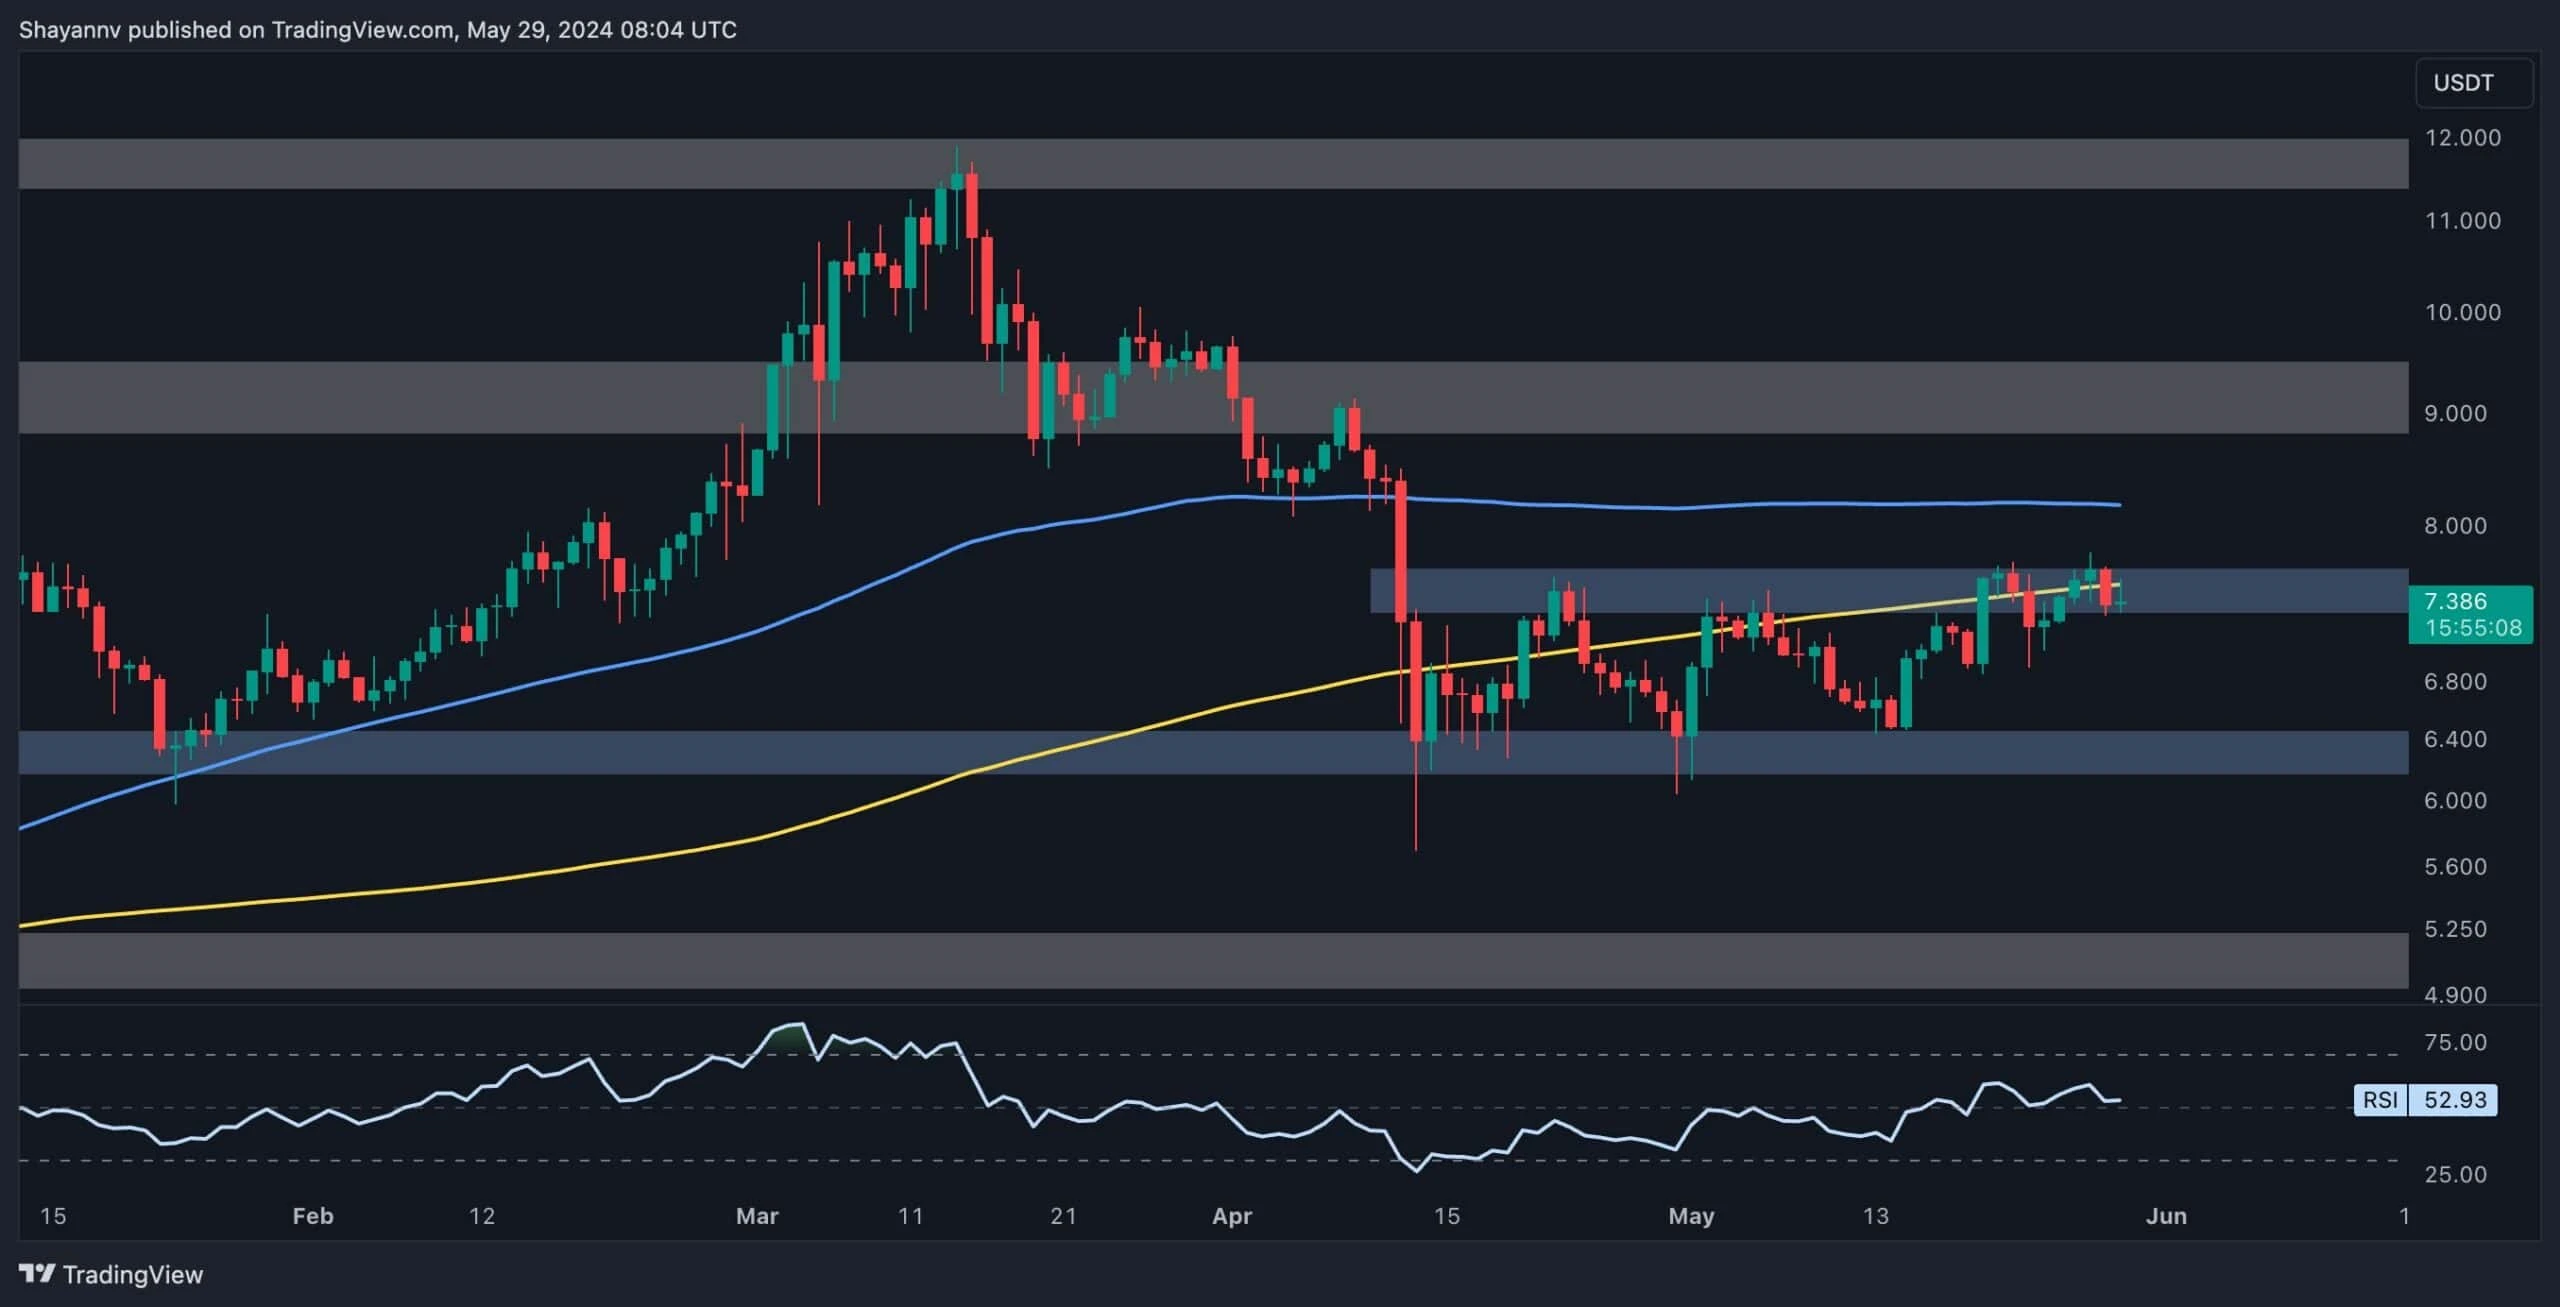
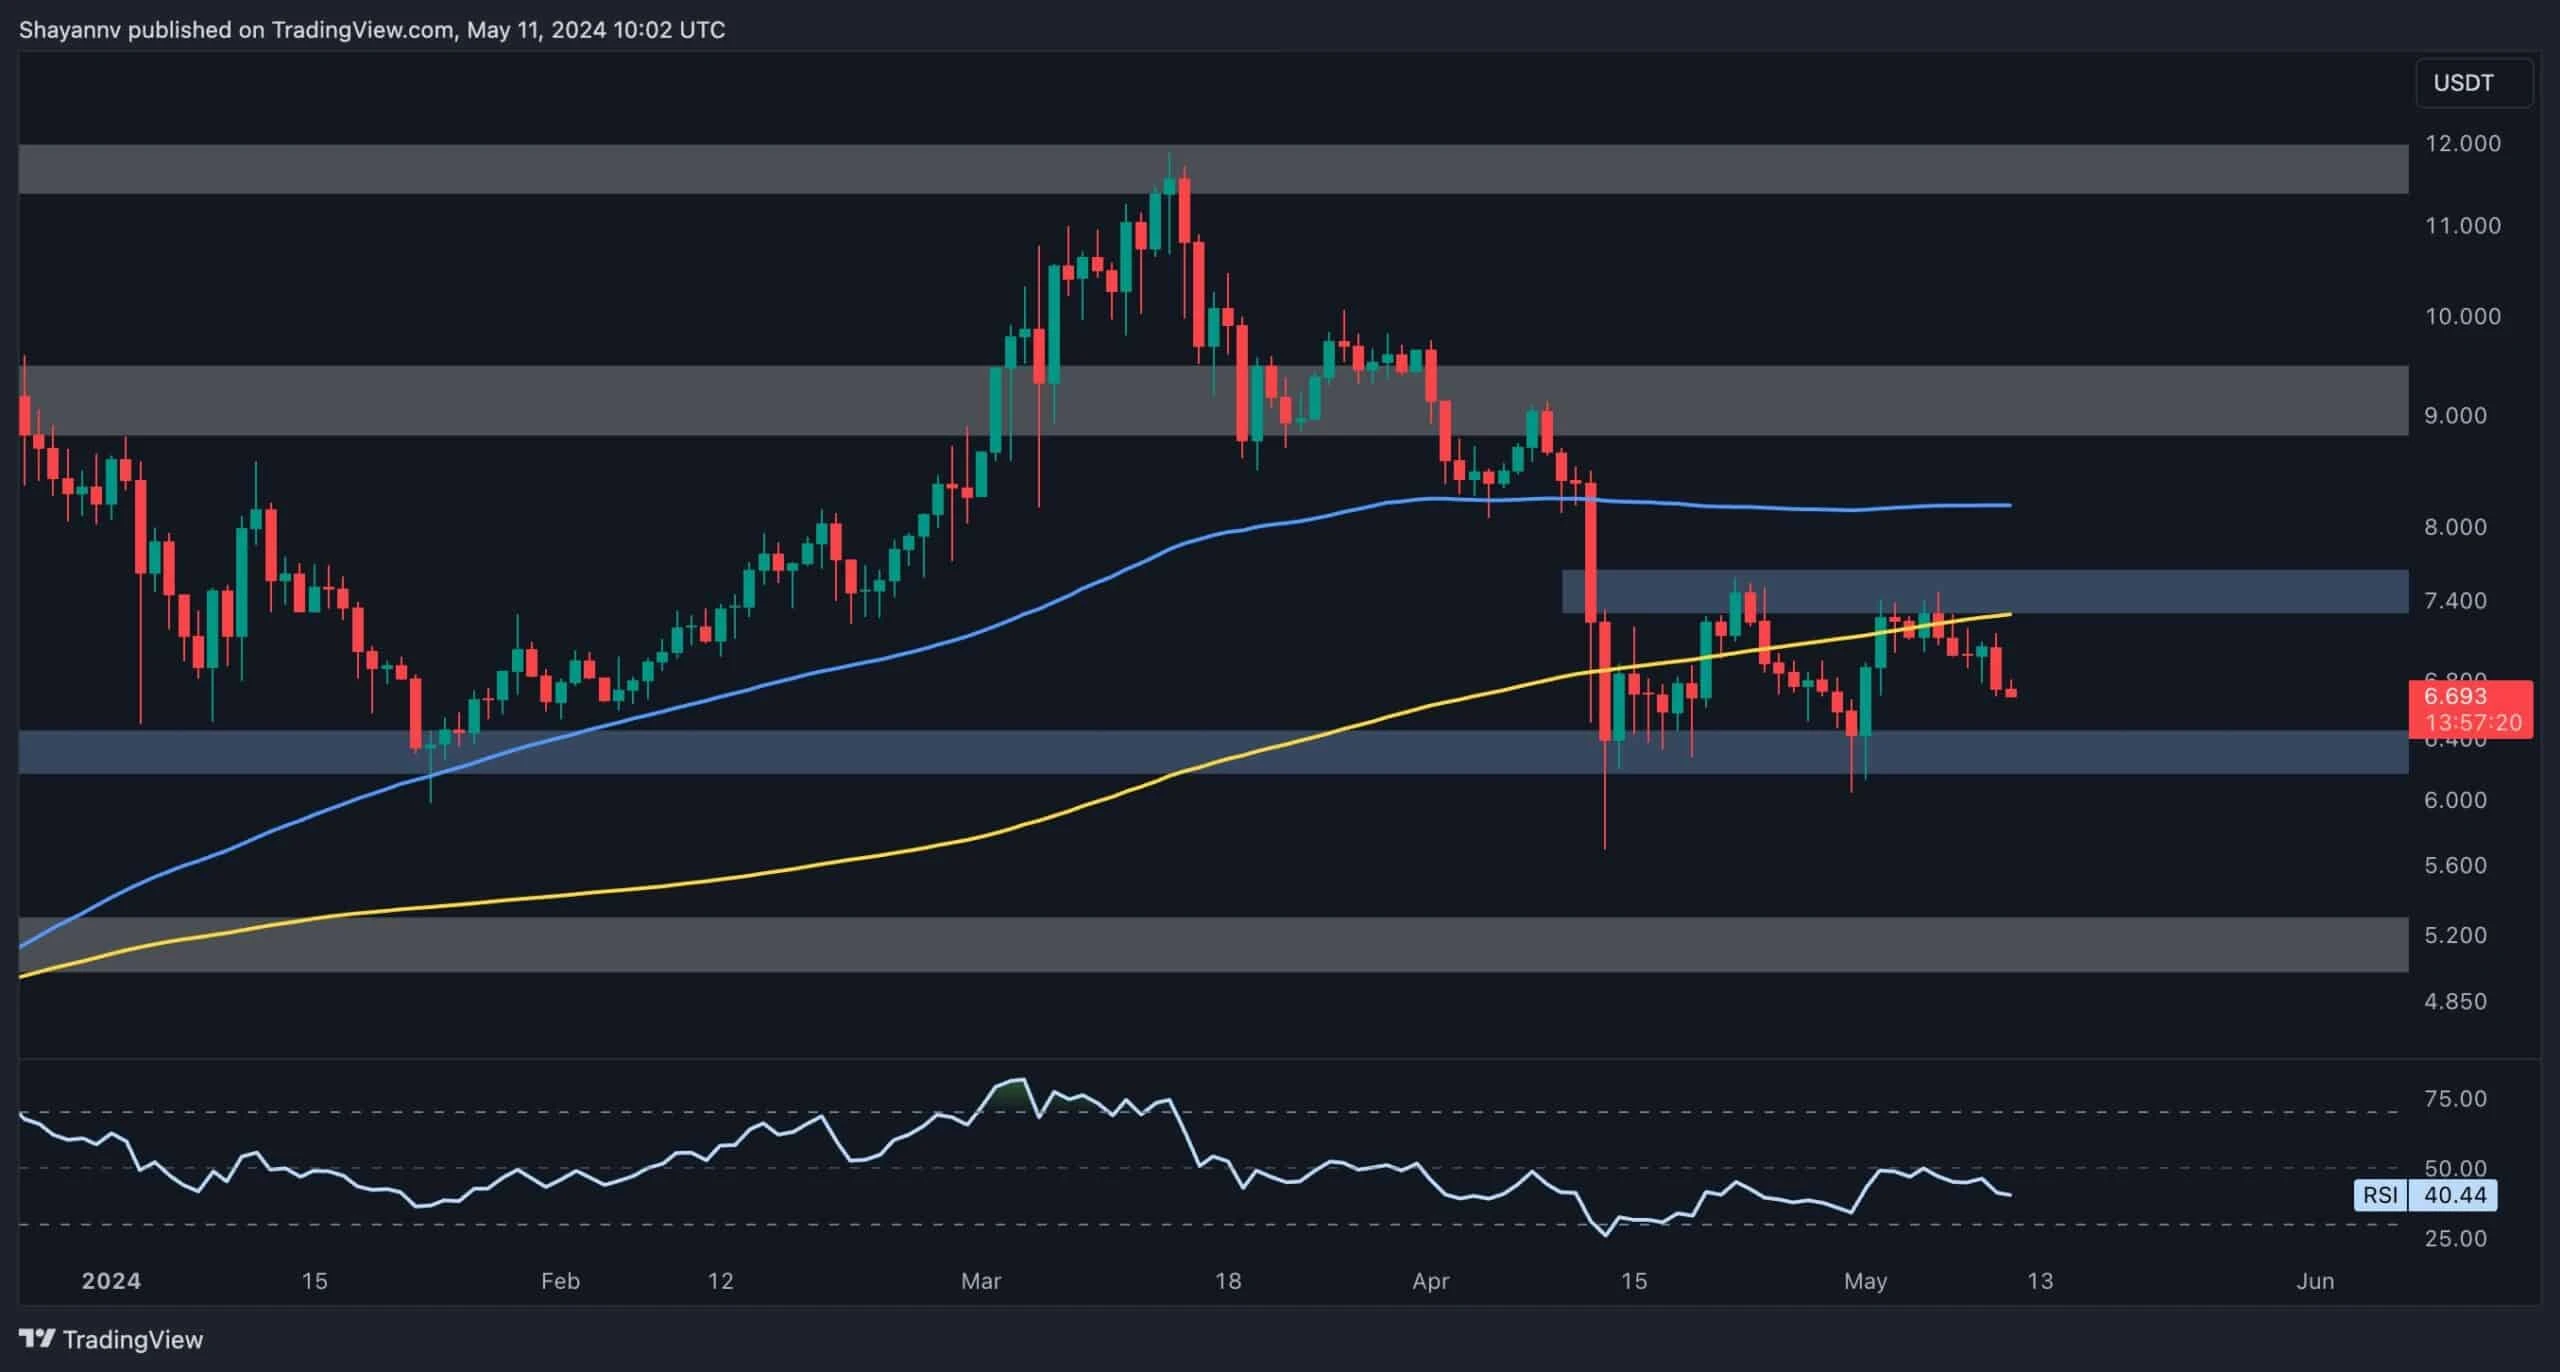
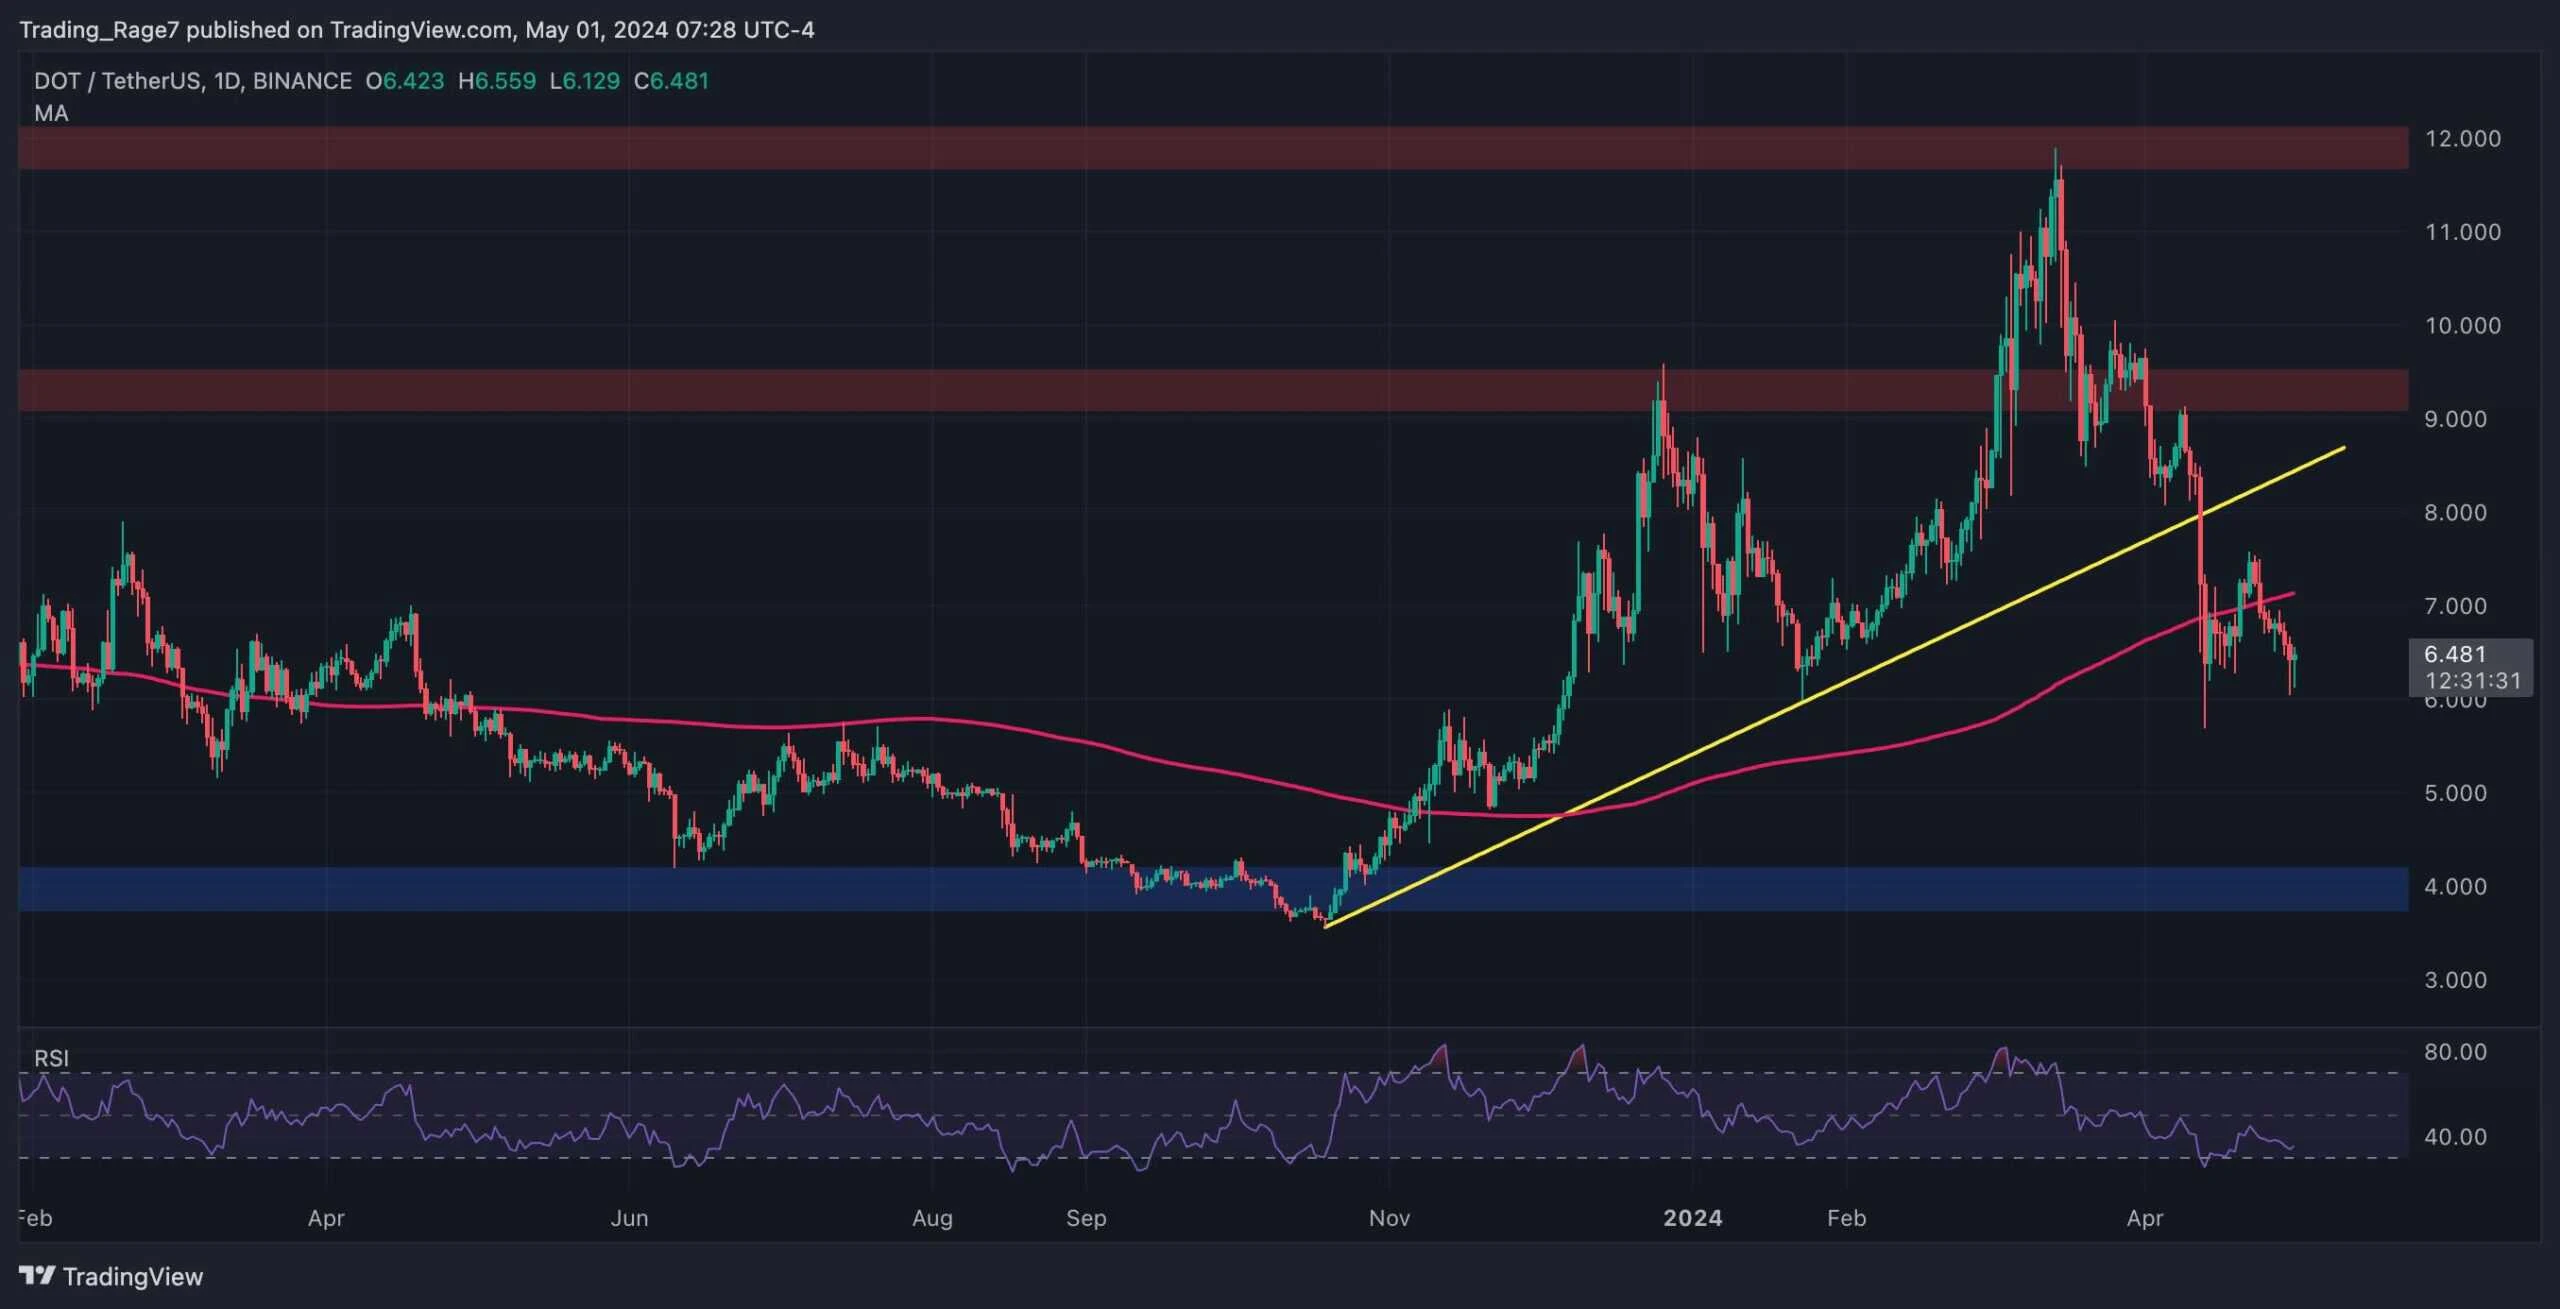
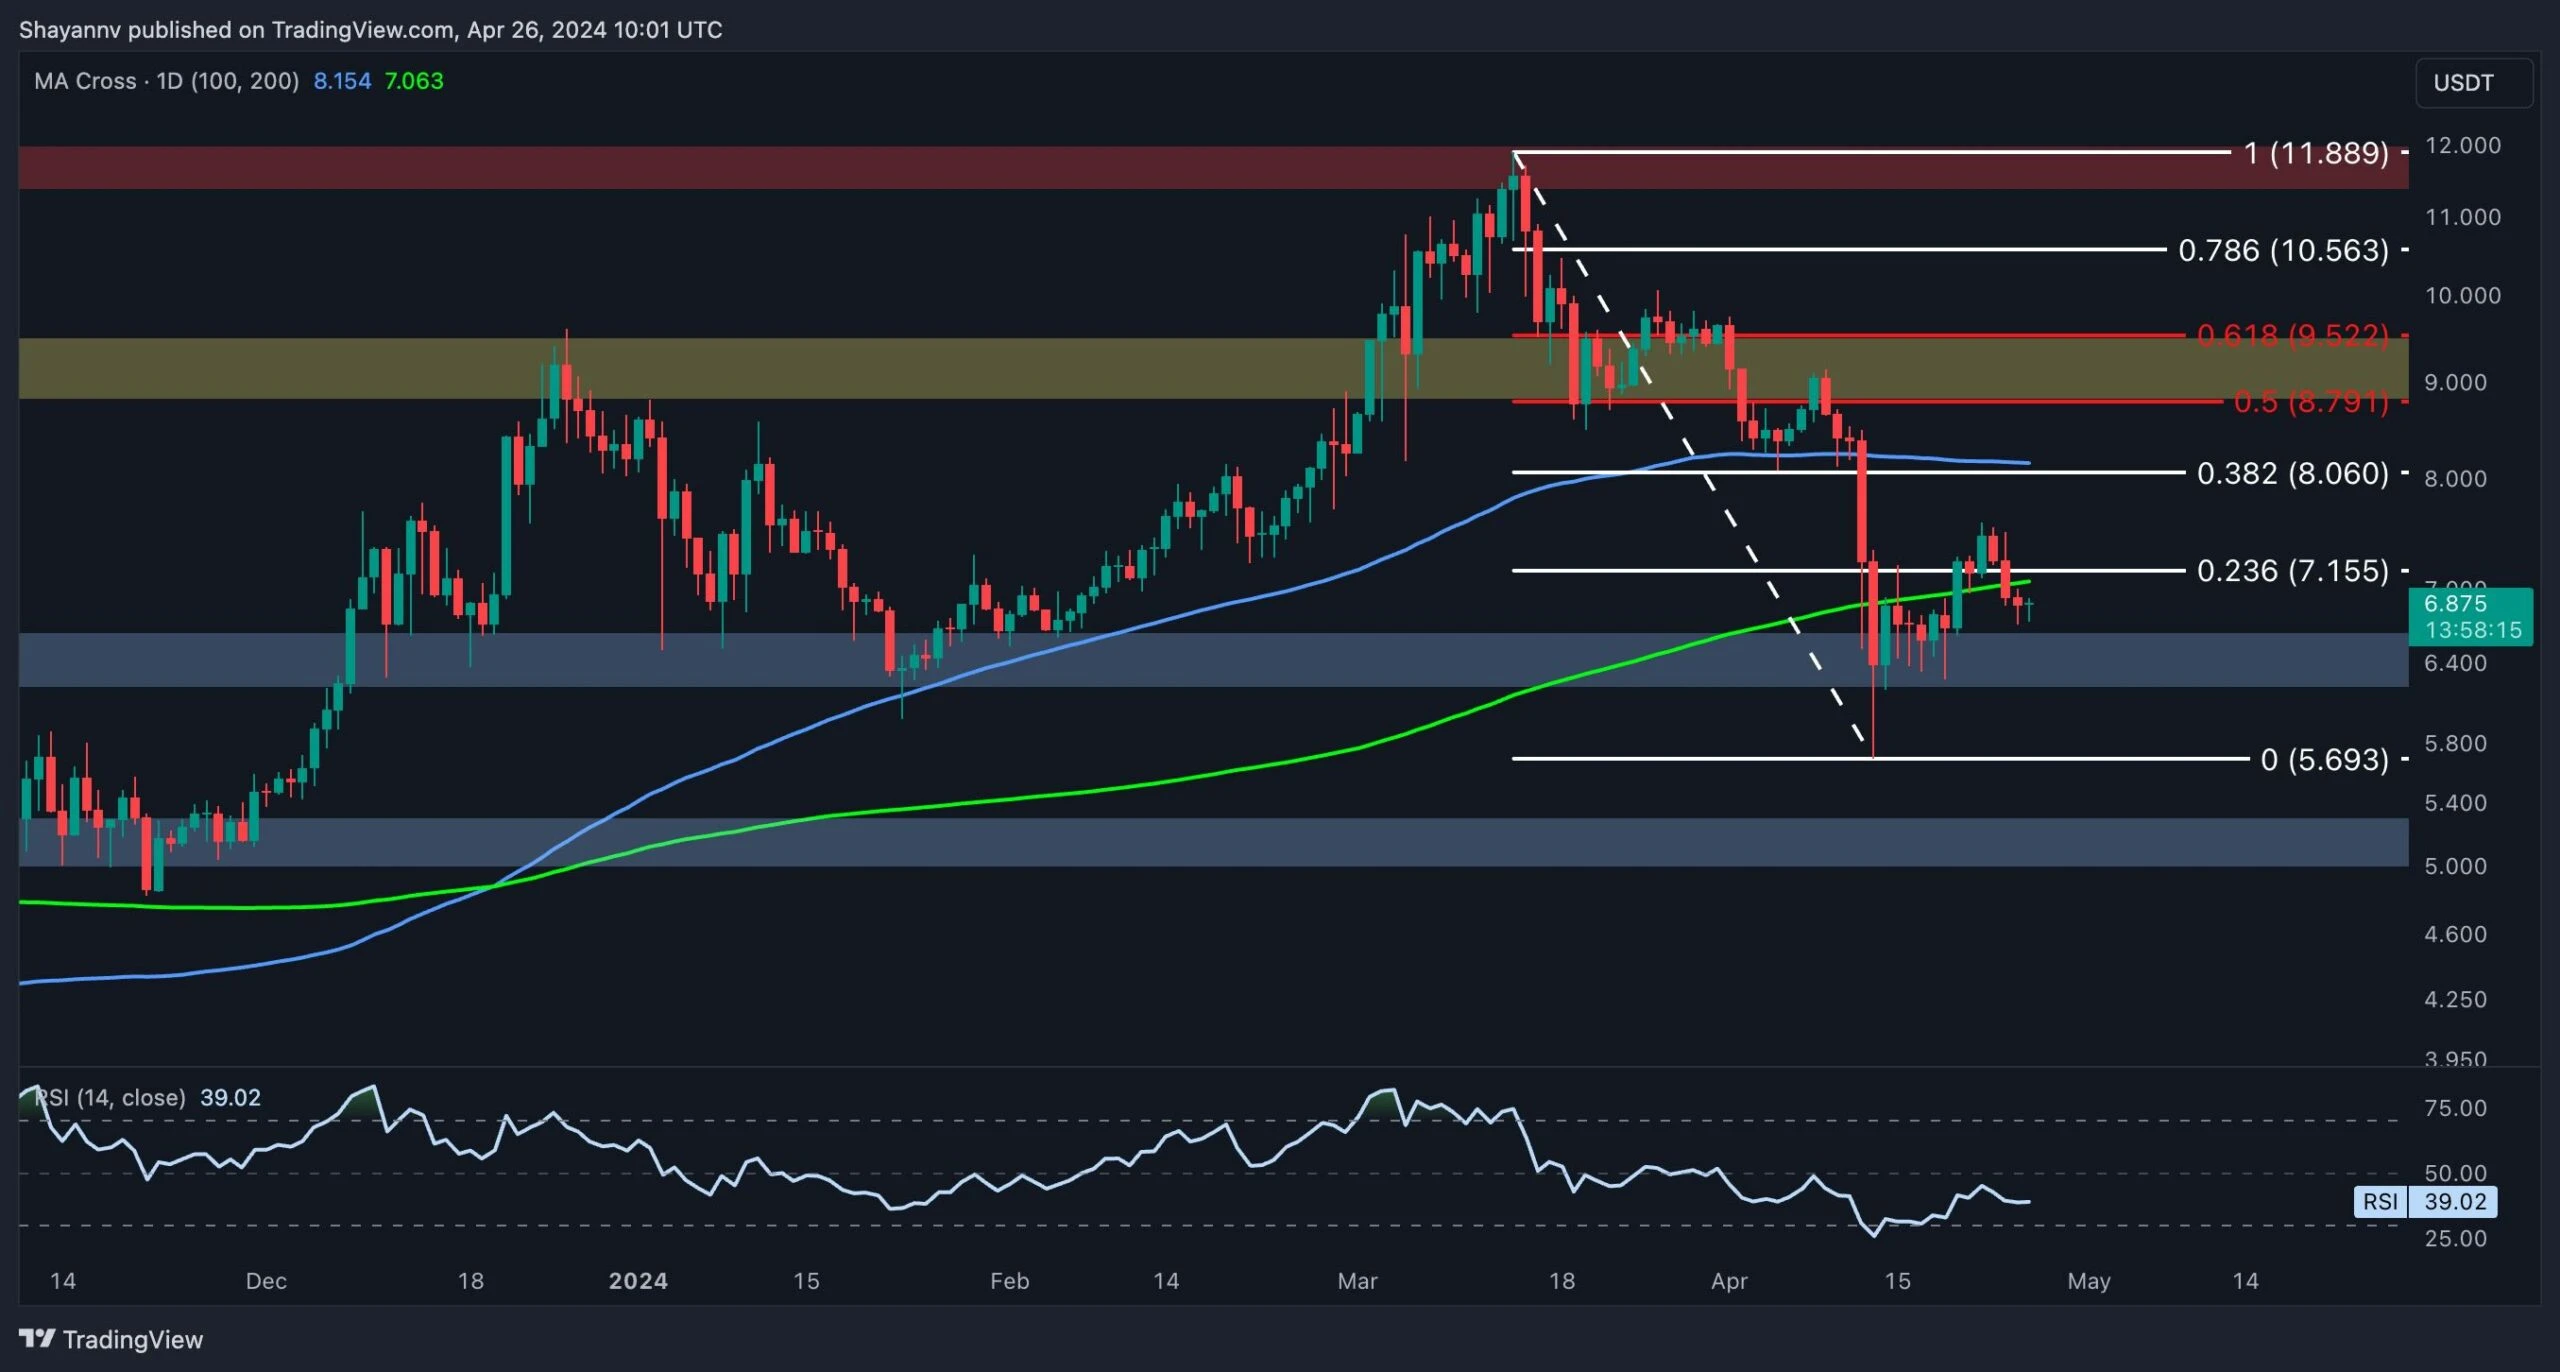
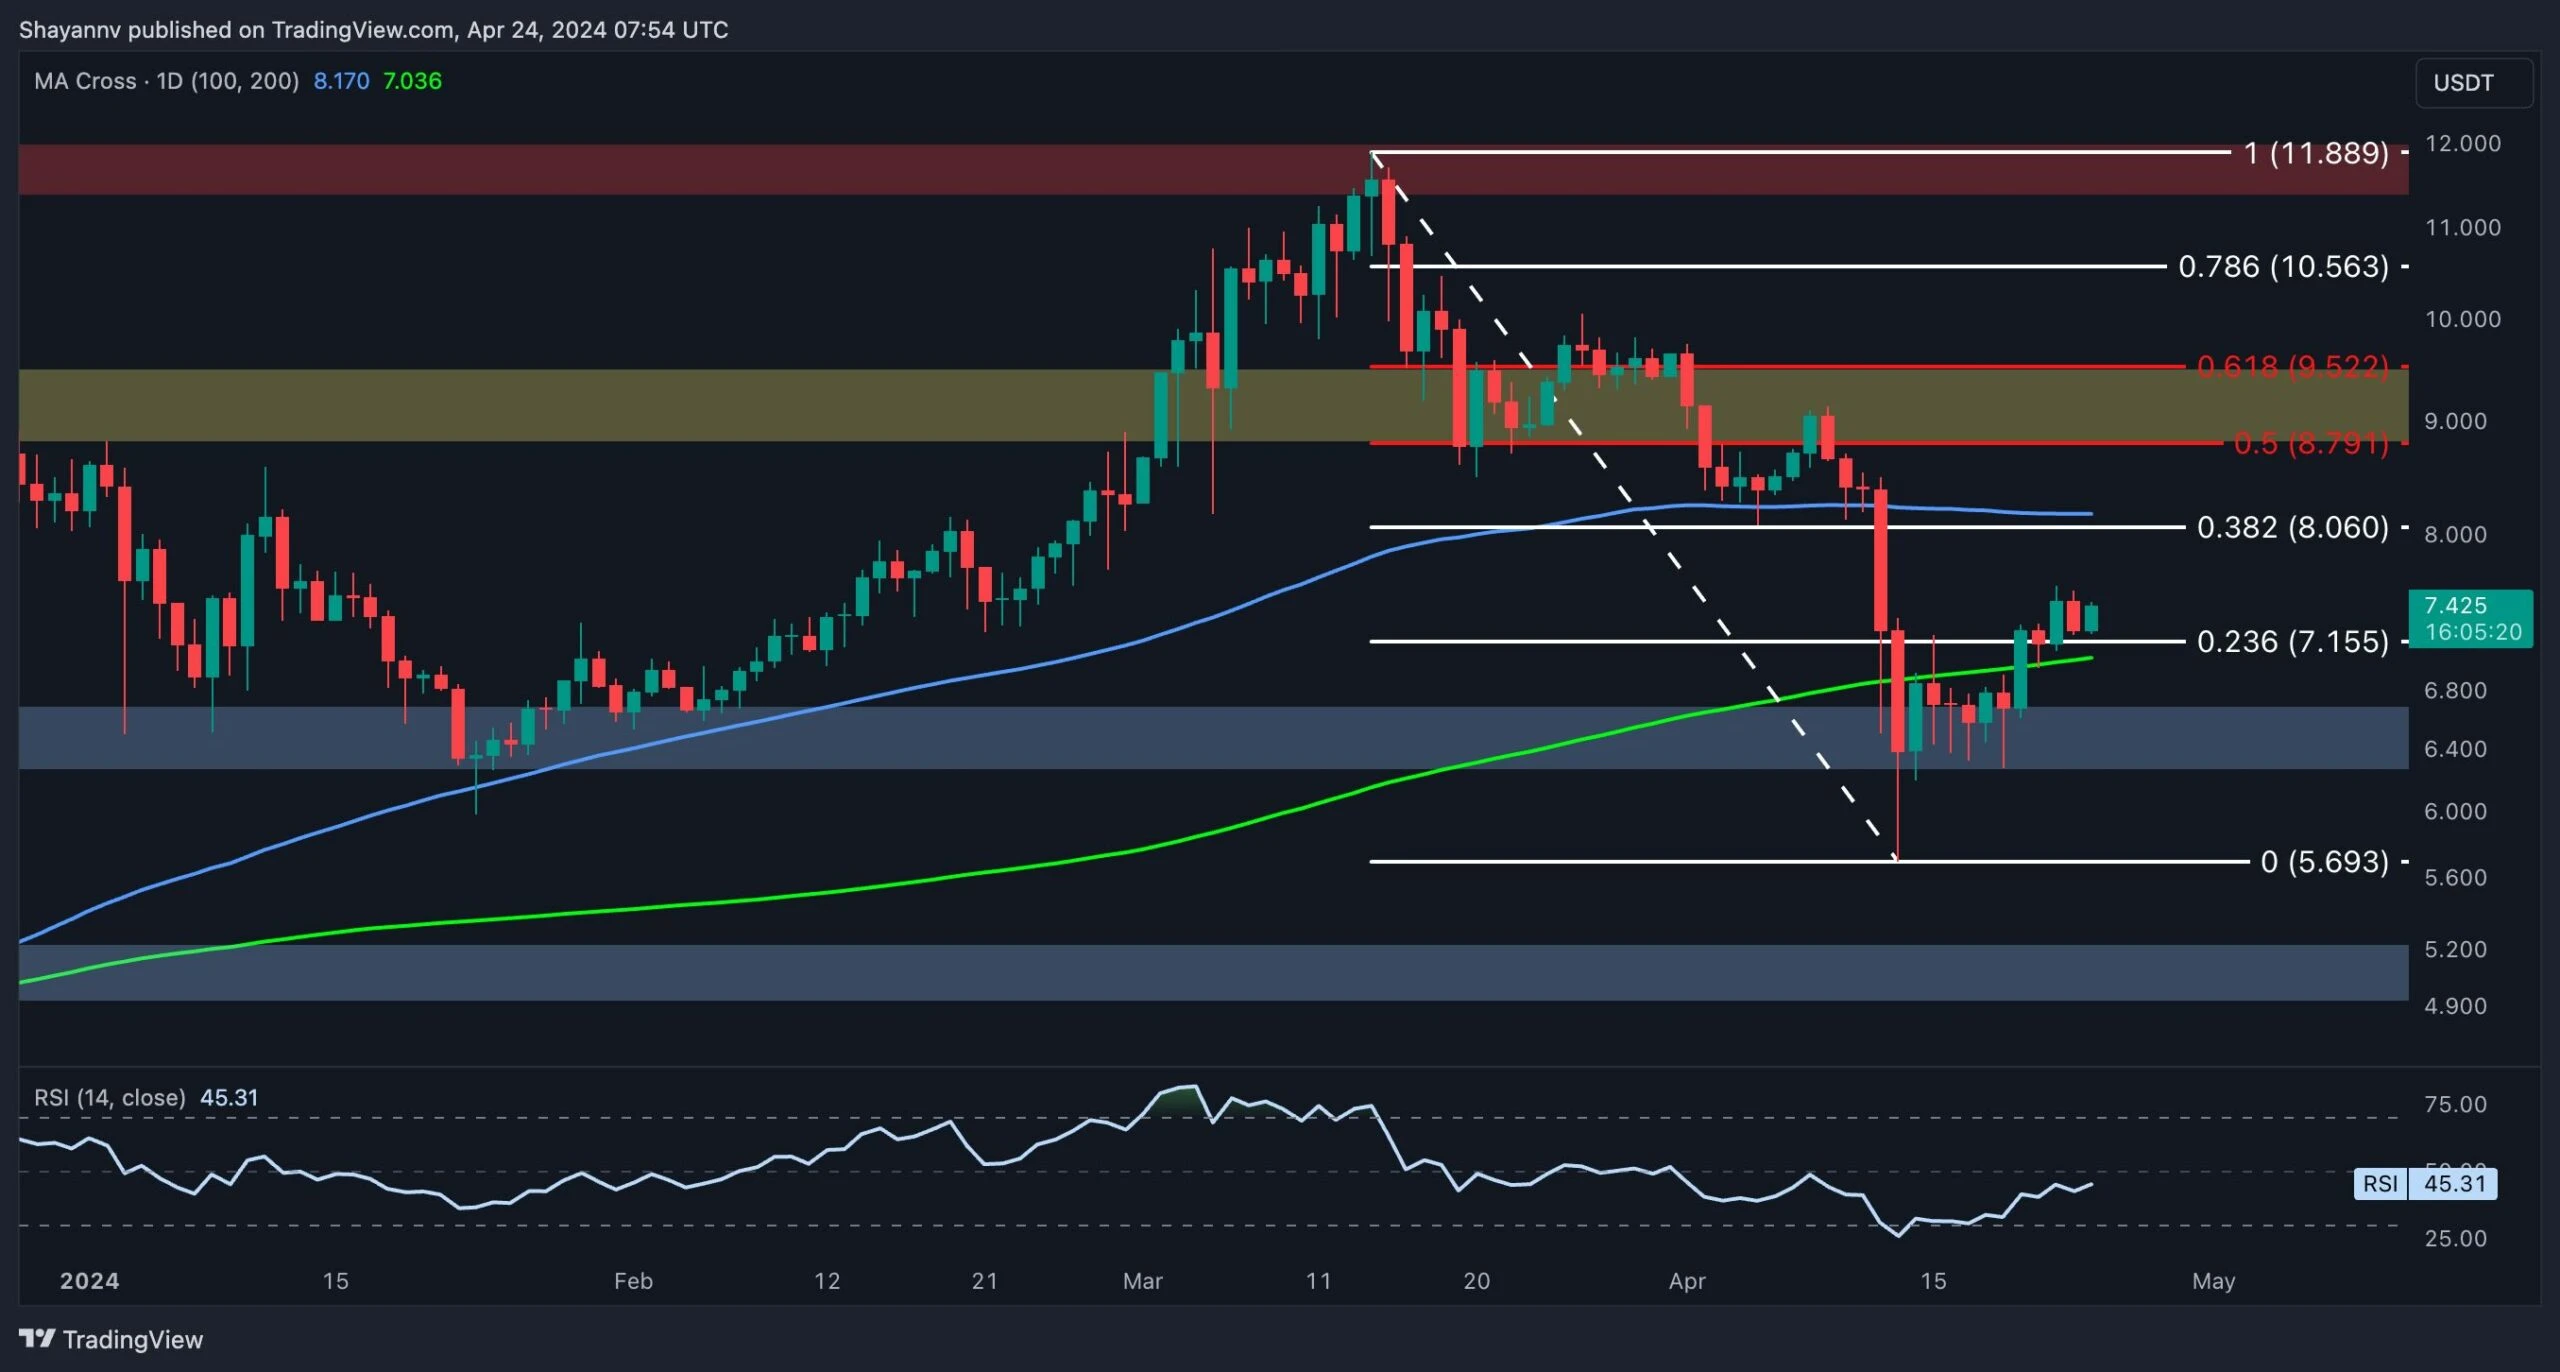
Polkadot (DOT), a popular cryptocurrency in the blockchain space, has been making waves with its innovative approach to interoperability and scalability. However, like any financial asset, its price movement is subject to various technical analysis patterns, one of which is the rising wedge chart pattern. The formation of a rising wedge pattern on DOT’s price chart suggests that despite its recent upward trajectory, there could be a downturn on the horizon. Traders and investors often watch for confirmation signals such as a break below the lower base of the wedge to confirm the pattern’s validity and anticipate potential selling pressure. Currently, the price of DOT is down by -0.13%, trading at about $7.13, with a market capitalization of over $10 billion and a trading volume of over $153 Million as of the time of writing. Although its market capitalization is down by 0.39%, its trading volume is up by 0.34% in the past day. With the help of the 100-day Simple Moving Average (SMA), and Relative Strength Index (RSI), this analysis was carried out using both the 4-hour and daily timeframe. Analytical View Of DOT’s Current Price Condition Currently, in the 4-hour chart, DOT is still moving in a consolidation manner, with the upper base and the lower base of the wedge building up momentum below the 100-day simple moving average. The 4-hour relative strength index is signaling that the price of DOT might break below the lower base of the wedge as the RSI line is seen trending a bit below the 50% level. From this RSI formation, it can be suggested that if DOT breaks below the wedge, it will begin to move downward toward the closest key support level. Meanwhile, in the 1-day chart, DOTs price is seen trending within the wedge but close to the lower base. The 1-day RSI also suggests that DOT might go bearish as the RSI line is attempting to cross below the 50% level. From this RSI formation, it is advised that investors should watch out for a break below the wedge before taking any sell positions. Potential Price Action In The Event Of A Breakout Presently, the crypto assets price is still moving within the wedge, and DOT will begin to decline in the direction of the $4.8 support level in the event that there is a breakout below the wedge. If the price falls below the aforementioned level, it might perhaps fall further to test the $3.5 support level. On the other hand, if the price reverses course and breaks above the wedge’s upper base, it will begin to rise toward the $9,8 resistance level. Should it break above this level, Polkadot will go higher to test the $11.9 resistance level. In addition, DOT might see a stronger rise to test more significant levels if it closes above $11.9. Featured image from Adobe Stock, chart from Tradingview.com

Jun 04, 2024 12:05

Is Polkadot Preparing For A 100% Surge And Spike Above $20?

Polkadot, the interoperable blockchain, remains one of the largest and most popular networks in the top 20. At press time, DOT, the platform’s native currency, is 14th, ahead of Tron and the NEAR Protocol. However, despite recent gains, it is still down 87% from all-time highs, undeniably facing a brutal market correction. Even with this bearish sentiment, a wave of optimism is building around DOT’s future. Taking to X, one analyst thinks not only will the coin shake off weakness but will surge, rallying to over $20 in the coming months. Related Reading: Crypto Guru Unveils Best Altcoins To Buy Now This confidence, the analyst said, will be primarily because of crucial developments in the broader Polkadot ecosystem. Eyes On Polkadot 2.0, Better On-Chain Governance Of the many, the analyst thinks the upcoming Polkadot 2.0 upgrade will be a game-changer. Already, Polkadot is interoperable and scalable. However, once the new upgrade comes into play, the platform’s developers expect the network to be more interoperable, scalable, and with better governance. Specifically, to address scalability, they will eliminate the Parachain slot auction and introduce the concept of coretime. This feature will give developers more flexibility. Instead of bidding and locking resources in the auction, they must purchase block space dynamically as needed. This will improve resource allocation, leading to more accessibility and efficiency. Additionally, Polkadot developers are introducing the OpenGov system for more decentralized governance. The objective here will be to give all DOT holders a voice in decision-making, which is crucial in decentralized networks. JAM Upgrade Proposal Passed, Will DOT Bulls Break $8? The network is also preparing for more changes. The community recently approved the Join-Accumulate Machine (JAM) chain. The proposal, which was unanimously passed by the community, paves the way for developers to build services similar to Ethereum smart contracts directly on the Polkadot Relay Chain. Gavin Wood, the former Ethereum developer who introduced the proposal, said this would make the network more accessible. Related Reading: Notcoin Unstoppable! Token Soars Over 400%, Blazes New All-Time High Beyond network-related upgrades, the analyst also said that more DOT’s are being locked, which is a huge boost. Usually, with staking, coins are taken out of circulation, increasing scarcity. If more activity and the demand for DOT increases, it would positively impact the price, helping lift it from the current ranges. As of June 3, over 1.4 billion DOT were in circulation. By the fourth week of May, over 820 million DOT had been staked. Looking at the price chart, if the coin breaks above $8, the incentive to stake and early rewards plus capital gains will increase. Feature image from Canva, chart from TradingView

Jun 04, 2024 01:00

Calm Before the Storm: DOT Ready to Rally to $9? (Polkadot Price Analysis)

Polkadots price has been consolidating over the past couple of months, following a steep decline in early April. Yet, things might be changing for the better. Technical Analysis By TradingRage The Daily Chart On the daily chart, the cryptocurrency has been range-bound inside a rising wedge pattern. This is a classical bearish reversal or continuation […]

Jun 30, 2024 01:00

Crypto Price Analysis June-29: ETH, XRP, ADA, DOGE, and DOT

This week, we take a closer look at Ethereum, Ripple, Cardano, Dogecoin, and Polkadot. Ethereum (ETH) Ethereum fell by 3% this week, and buyers appear to struggle to defend the key support at $3,500. So far, they have managed to prevent a breakdown. If sellers maintain the pressure, ETH could have a difficult week ahead. […]

Jun 16, 2024 12:05

Polkadot (DOT) In Freefall: Will It Recover Or Hit Rock Bottom?

Polkadot (DOT), a prominent player in the blockchain ecosystem, is currently experiencing a dramatic decline, prompting a bearish alert. The cryptocurrency is in freefall, with its price plummeting towards new lows. A combination of market-wide volatility, negative investor sentiment, and regulatory pressures fuels this sharp downturn. As DOT’s value continues to erode, investors are advised to brace for further losses and reassess their strategies in light of these bearish signals. In this analysis, we will dive into Polkadot’s price prospects with the help of some technical indicators focusing on the 1-hour and the 4-hour timeframe. DOT Price Still Actively Bearish DOT’s price on the 4-hour chart did a retracement after a break from the previous bearish triangle wedge and began to drop again. Although the price currently is attempting to move up, the reality is that it will continue to drop afterward. The formation of the 4-hour Composite Trend Oscillator also suggests that the price of DOT may still drop as the signal line and Simple Moving Average (SMA) of the indicator are currently trending close to the oversold zone. Also, on the 1-day chart, DOT is attempting a bullish move below the 100-day SMA after dropping a bearish candlestick on the past day. Based on the 1-day price formation, it can be suggested that this bullish move that DOT is making is just on a short-term note. Lastly, the 1-day Composite Trend Oscillator on the daily chart signals that DOT’s price is still actively bearish as both the signal line and SMA have crossed below the zero line and are heading towards the oversold zone. More Losses Ahead? In conclusion, Polkadot is currently in a precarious position as it experiences a sharp and sustained decline, triggering a bearish alert. Therefore, if the price of DOT continues to drop, it might move towards the $4.809 support level. And if it breaks below this level it will drop further to test the $3.542 support level and probably other key levels afterward. However, if DOT decides to continue its move in the upward direction, it will begin to move toward the $7.701 resistance level. Should it move above this level, it will move higher to test the $9.805 level and probably go bullish to test other key levels. As of the time of writing, DOT was trading at around $6.23 and was down by 2.58% with a market capitalization of over $8.9 billion and a 24-hour trading volume of over $204 million. Although its market capitalization is down by 2.52%, its trading volume has increased by 19.08% in the past day. Featured image from Adobe Stock, chart from Tradingview.com

Jun 15, 2024 01:00

Is the Worst Over for DOT or More Pain to Come? (Polkadot Price Analysis)

Polkadot’s price has been consolidating sideways near the critical resistance region around the $6.5 threshold. A slight bullish reversal might occur in the short term due to the potential heightened demand near this pivotal level. Technical Analysis By Shayan The Daily Chart The daily chart shows Polkadots bearish momentum faded after reaching the substantial support […]

Jun 11, 2024 01:00

What Can We Expect from the Polkadot Price in the Near Future? (DOT Price Analysis)

Polkadot buyers were unable to surpass the critical resistance at $7.5, resulting in a significant 7% decline due to increased selling pressure. The cryptocurrency has now reached a decisive support level, and the upcoming price action will be crucial in determining Polkadot’s future trend. Technical Analysis By Shayan The Daily Chart A detailed daily chart […]

May 09, 2024 01:00

Is Polkadot Bound for a Massive Move Following Consolidation Around $7? (DOT Price Analysis)

Following a bounce from the lower boundary of the current price range at $6.4, Polkadot experienced a surge, reaching the upper threshold, coinciding with a significant resistance area. Consequently, a slight rejection is anticipated, with the price targeting the lower part of the range. Technical Analysis By Shayan The Daily Chart Upon close examination of […]

May 08, 2025 12:05

Polkadot (DOT) Prints Classic Bullish Falling Wedge Big Breakout Imminent

In an update on X, crypto analyst Jascrypto pointed out that Polkadot (DOT) is currently forming a textbook bullish falling wedge pattern on the daily chart. This technical setup is often associated with a potential trend reversal, signaling the end of a downtrend and the beginning of a bullish breakout. As DOT continues to consolidate within the narrowing bounds of the wedge, market participants are starting to take notice. The structure suggests that bearish momentum may be weakening, allowing buyers to step in. With volume expected to increase upon a breakout, this pattern could mark a pivotal shift for DOT and spark a strong upside move, potentially starting a new bullish phase. Why The Polkadot Falling Wedge Is Bullish Crypto analyst Jascrypto recently highlighted that Polkadot has completed a breakout from a multi-month falling wedge pattern. Falling wedges are typically viewed as reversal patterns, and DOTs successful breakout suggests that downward pressure may be easing after months of consolidation. This structural shift reflects growing optimism and signals that the asset could be preparing for a larger upward trend. Related Reading: Polkadot Price Caught In A 5-Year Channel Can It Finally Break Free? Jascrypto pointed out that DOT is currently testing the 100-day and 200-day Exponential Moving Averages (EMAs), key technical levels that often act as strong resistance in bearish conditions. He emphasized that a decisive daily close above these EMAs would validate the breakout and signal a shift in market sentiment. According to Jascrypto, if Polkadot maintains momentum and closes above these critical levels, it may pave the way for a rally toward the $5.5 to $6.0 range in the near term. This move would mark a significant recovery phase for DOT, attracting fresh bullish interest from investors. In an alternative scenario, Jascrypto noted that the worst-case outcome might see Polkadot dipping as low as $3.120 on higher timeframes. However, he added that such a move could set the stage for a much stronger rebound, propelling the price above the $7 mark once momentum returns. Momentum Indicators Lean Bullish Is DOT Ready To Run? Momentum indicators are beginning to align in favor of the bulls, offering promising signals that Polkadot may be gearing up for a meaningful move higher. The 4-hour Relative Strength Index (RSI) has rebounded from oversold territory, hovering near the midpoint around 50. This shift indicates that bearish momentum is fading, and buyers may be gradually regaining control. Related Reading: Polkadot (DOT) Nears Critical Zone: A Reversal Could Trigger 180% Surge Adding to the optimistic trend, the 4-hour Moving Average Convergence Divergence (MACD) has shown a bullish crossover, where the MACD line crosses above the signal line. A move that often marks the beginning of a new uptrend or a pause in prior downside pressure. Combined, the RSIs recovery and the MACDs bullish signal suggest that DOTs momentum is shifting favorably, setting the stage for a potential breakout continuation if price action remains strong. Featured image from Medium, chart from Tradingview.com

May 08, 2024 12:05

Polkadot To Sponsor Messis Inter Miami: DOT To The Moon?

The Polkadot community has approved a proposal to sponsor Inter Miami, the football club co-owned by David Beckham and featuring superstar Lionel Messi. The move could be a strategic decision to propel Polkadot, a smart contracts platform similar to Ethereum, into the global spotlight.  Polkadot To Sponsor Inter Miami The proposal, approved by Polkadot’s Open Gov community, sought 968,000 DOT (roughly $6.5 million) to secure the sponsorship. Under the “sports sponsorship fund,” the goal was to partner with Inter Miami, a team described as one of the “world’s most engaging and followed sports teams.”  Related Reading: Cardano (ADA) Trading Activity Goes Quiet: Will This Drag Down The Price? While the goal is to “elevate” Polkadot’s global brand visibility, the plan is to develop other deeper integration, leveraging Inter Miami’s global fanbase. For instance, the team plans to enhance user experience through engaging non-fungible tokens (NFTs) and other gamified experiences deployed on Polkadot’s parachains. Additionally, the team plans to explore how Polkadot-based solutions can be implemented at Inter Miami, resulting in greater efficiency and improved fan engagement initiatives.  While the potential deal’s specifics are confidential, the proposal emphasizes transparency. Accordingly, funds will be held in a multi-signature wallet, accessible only with community approval. Moreover, ORSEN SA, a Swiss sports marketing agency, will manage the partnership rights. Polkadot’s Plans to Scale As Polkadot enhances its global visibility, developers are also working on activating a key update: “Asynchronous Backing.” Last year, Sophia Gold, the Engineering Lead at Parity Technologies, said the technology would be a game changer.  Asynchronous Backing will allow Polkadot to scale the number of Parachains from 100 to 1,000 by the end of the year. The network will boost its transaction processing capacity, with Polkadot supporting more “independent blockchains” via Parachains.  Related Reading: Heres How This Ethereum Whale Made $16 Million From A Single Trade Furthermore, improvements via techniques like “pipelining” will permit multiple parachains to process data simultaneously, halving transaction confirmation times. Though Polkadot continues to enhance its network and strike more deals, DOT prices remain under pressure. At spot rates, DOT is down 40% from 2024 highs. While CoinMarketCap data shows that the coin has risen 14% in the last week, the failure of bulls to break above $7.5 is a concern. Technically, a high volume lifting the coin above this local liquidation level would pave the road for an expansion toward $9 and March 2024 high in the coming sessions. Feature image from Unsplash, chart from TradingView

May 04, 2024 05:50

Record-Breaking Q1 For Polkadot: Daily Active Addresses Hit 514,000 As DOT Price Surges 7%

According to a Messari report, the Polkadot (DOT) blockchain protocol made significant progress in the first quarter (Q1) of the year in terms of market capitalization, revenue, and Cross-Consensus Message Format (XCM) activity, as well as a record increase in daily active addresses. DOTs Market Cap Surges 16% QoQ During Q4 2023, Polkadots market capitalization [...]

The post Record-Breaking Q1 For Polkadot: Daily Active Addresses Hit 514,000 As DOT Price Surges 7% appeared first on Crypto Breaking News.

May 04, 2024 01:00

Polkadot Price Analysis: Has DOT Bottomed and is $9 the Next Target?

Polkadots price has been on the decline for a while now, since reversing to the downside in March, Yet, the market might recover soon. Technical Analysis By TradingRage The Daily Chart On the daily chart, DOTs price has been making lower highs and lows since being rejected from the $12 resistance level. The $9 mark […]

May 30, 2024 01:00

Bears Seem in Control, Is DOT About to Drop Toward $6.5? (Polkadot Price Analysis)

A constant consolidation near the substantial resistance region of $7.4 indicates an ongoing battle between Polkadot buyers and sellers. Nevertheless, the market is in a critical spot, with the upcoming price action shedding light on DOTs future prospects. Technical Analysis By Shayan The Daily Chart A detailed examination of Polkadot’s daily chart reveals an uncertain […]

May 23, 2024 05:50

Polkadot Price Sets Sights on New Highs: DOT Bullish Momentum Building

Polkadot (DOT) is consolidating gains above the $7.40 zone against the US Dollar. The price could start another increase if it clears the $7.70 resistance. DOT gained pace and tested the $7.70 resistance level against the US Dollar. The price is trading above the $7.20 zone and the 100-hourly simple moving average. There is a [...]

The post Polkadot Price Sets Sights on New Highs: DOT Bullish Momentum Building appeared first on Crypto Breaking News.

May 18, 2024 12:05

Polkadot Price On The Verge Of Massive Breakout, Can It Reach $25?

Polkadot (DOT) has come under the spotlight with crypto analysts laying out bullish narratives for the crypto asset. One of them is crypto expert Michaël van de Poppe, who believes Polkadot could rise to as high as $25 in this bull run.  Polkadot Could Reach $25 On Next Leg Up Michaël van de Poppe mentioned in an X (formerly Twitter) post that Polkadots next rally will see it climb between $20 and $25. He explained that the crypto token has seen a substantial correction in the past months, but it showed enough strength by coming back to pre-rally levels. The analyst further claimed that Polkadot has bottomed, especially since JAM Whitepaper came out. Related Reading: PEPE Whales Go On Massive 720B Shopping Spree Amid Campaign For New ATHs, Is It Time To Get In? As such, he believes that Polkadot is more than primed for this rally, which could propel it to such heights. The crypto analyst has been a big believer in Polkadots potential. He previously included Polkadot in a list of crypto tokens that he believes are undervalued. He claimed that DOTs valuation was still at a cycle low, which had opened up a huge opportunity to invest in it.  Van de Poppe is very much invested in Polkadot because of its technology. In a previous X post, he highlighted how the JAM (Join-Accumualte Machine) Paper, which ushered in Polkadot 2.0, would revolutionize DOTs ecosystem. He also claimed that Polkadot is the second largest blockchain in terms of developers and growth. Therefore, he expects DOTs price to complement the teams efforts soon enough.  Meanwhile, Van de Poppe expects Polkadot to reach as high as $20 in the third quarter of this year. For now, he believes that the $8 and $17 range are crucial resistance levels that the crypto token must break out of to enjoy such a parabolic rally.  A More Bullish Prediction For DOT Crypto analyst Crypto Thanos offered a more bullish prediction for Polkadot, stating that the crypto token climbing above $50 is easily achievable in this bull run. He believes this price is attainable because he expects institutions to get interested in large caps like Polkadot. He also noted Polkadots collaboration with Tie, which aims to increase institutional exposure and access.  It is worth noting that Polkadots all-time high (ATH) is currently $55, which makes Thanos prediction for the crypto token feasible. Crypto tokens are known to usually surpass their ATH in every bull run.  Related Reading: Why Is This Crypto Pundit Warning XRP Investors To Be At Alert For The Next 3-12 Months Crypto analyst Captain Faibik provided insights into what to expect from Polkadot in the short term. He predicts the crypto token will record a 35% bullish rally soon enough. He said a major trendline breakout/retest has already been confirmed for DOT on the four-hour timeframe chart.  At the time of writing, Polkadot is trading at around $7.11, up over 2% in the last 24 hours, according to data from CoinMarketCap.  Chart from Tradingview.com

May 12, 2024 01:00

Calm Before the Storm? DOT Eyes This Level to Trigger Mass Liquidations (Polkadot Price Analysis)

Polkadot’s recent price action has been characterized by steady but uncertain movements within a defined range, highlighting a balance between buyers and sellers. However, a decisive breakout from this range is imperative to determine its future trajectory. Technical Analysis By Shayan The Daily Chart On the daily chart, Polkadot has been trapped within a defined […]

May 02, 2024 01:00

Polkadot Price Analysis: DOT Tumbles 7% Weekly but the Bulls May Be Staging a Comeback

Polkadots price has been dropping rapidly over the last couple of months and is yet to show any sign of slowing down. However, the cryptocurrency might soon begin a bullish rebound. Technical Analysis By TradingRage The Daily Chart On the daily chart, the price has been on an aggressive decline since a rejection from the […]

Apr 30, 2025 12:05

Polkadot Price Caught In A 5-Year Channel Can It Finally Break Free?

According to Çanur Cessur in a recent post on X, Polkadot (DOT) has been consistently trading within a clearly defined black channel on the monthly chart. This channel is formed by well-established horizontal support and resistance levels, which have been tested numerous times over the past 4 to 5 years.  The range, spanning from $4 on the lower end to around $12 at the top, has effectively boxed in DOTs price action, shaping a long-term sideways market structure. A clear move beyond this 5-year range, especially on strong volume, could mark the beginning of a new trend, either into price discovery or deeper support levels. Analysing Price Action Within The Channel Cessur emphasized in his recent analysis that the green channel shown on the Polkadot chart represents a downtrend that has been in place for nearly four years. This trend has consistently guided the broader market structure, acting as a long-term resistance. However, he noted that if DOT manages to break above this channel, it could set the stage for a major trend reversal to new highs in the months ahead. Related Reading: Polkadot Rebounds Slowly As Oversold Conditions Ignite Bullish Hopes He also drew attention to DOT’s short-term outlook, where a red falling channel on the weekly timeframe has just been breached to the upside. According to Cessur, this development is a sign of potential bullish continuation, positioning DOT as one of the altcoins to start an increase.  The analyst concluded that if the asset continues to follow the multi-year pattern of ranging from $4 to $12, another climb toward the top of this range seems likely. Most importantly, if the weekly candle closes above $4.70, he noted that the chances of seeing a swift move toward $10 could increase significantly, supported by growing bullish momentum and historical price behavior. Bear Case: Losing $4 Might Send Polkadot To All-Time Lows The bear case for Polkadot revolves around the critical $4 support level, which has been pivotal in maintaining the altcoins price structure. If DOT loses the $4 mark, it might signal a deeper bearish move. This would invalidate recent bullish hopes and raise the potential for further declines as market sentiment shifts to a more risk-averse stance. Related Reading: Polkadot (DOT) Must Retest Crucial Support To Sustain Uptrend Details Such a drop would suggest that the upward momentum observed in recent months could be a false rally, with DOTs price unable to maintain its position above key support levels. Its failure to hold above $4 may prompt heightened selling pressure, especially when broader market conditions worsen or there’s a loss of confidence in Polkadots long-term prospects. Additionally, a move below this critical support would raise the probability of a retest of all-time lows, which would be a significant bearish development for the token. In this scenario, patience and strategic re-entry points would become key factors for short and long-term holders. Featured image from Adobe Stock, chart from Tradingview.com

Apr 27, 2024 01:00

Is Polkadot Primed for a Major Move Following Extended Consolidation? (DOT Price Analysis)

Polkadot has been undergoing a prolonged corrective consolidation around the critical $6.5 support level, with the price retracing slightly toward the 100-day moving average. However, the short-term expectation is to continue this corrective consolidation phase. Polkadot Price Analysis: Technicals By Shayan The Daily Chart A comprehensive analysis of the daily chart shows a swift rebound […]

Apr 25, 2024 01:00

Polkadot Price Analysis: DOT Consolidates in Critical Area as Bulls Eye $9 Push

Polkadot’s recent price movement has seen it finding support from the crucial 200-day moving average, prompting a bullish retracement. However, despite this upward trajectory, the cryptocurrency faces several critical resistance levels ahead, casting doubt on the sustainability of the bullish retracement. Technical Analysis By Shayan The Daily Chart A thorough daily chart analysis reveals a […]

Your Crypto Gateway

Claim 1,000
Free WCG Coins

World Crypto Global opens the door to digital freedom for everyone.
Manage your free WCG Coins securely—where simplicity meets global accessibility.

11 bn

FREE CRYPTO COINS

8.9 bn

AVAILABLE FOR RESERVATION

2.1 bn+

ALREADY ALLOCATED

× WCG Coin

🎉 Get 1,000 WCG Coins

No fees. No catch. Your crypto journey starts here.