Ethereums firm $2,860 support signals path to $4,500 Deribit
A Deribit report underscores Ethereums resilience at $2,860, pointing toward potential highs driven by recent ETF approvals.
Loading
Welcome at World Crypto Global. This portal is packed with useful content and resources to built out your own crypto skills. WorldCrypto is a site member of Gabriel Vega Network.

A Deribit report underscores Ethereums resilience at $2,860, pointing toward potential highs driven by recent ETF approvals.
Bitcoin price is finally seeing some relief, but it faces significant resistance at the $68,000 mark, which would trigger over $700 million worth of short liquidations.
The lack of retail participation is suspected of dropping Bitcoin wallet activities as celebrity memecoins attract speculators away from more established cryptocurrencies.
XRP analyst Egrag Crypto, who is well-known for offering bullish predictions about the altcoin, has now drawn the crypto communitys attention to another altcoin, XDC. The analyst predicts this crypto token could also witness a remarkable surge and enjoy up to a 3,350% gain as bullish metrics emerge. XDC To Rally To $2 As Indicators Turn Bullish In an X post, Egrag Crypto stated that XDC will rally to $1 and then easily surge to $2. This came as he remarked that the altcoins chart looks amazing. First, the XRP analyst noted that the RGB (Red-Green-Blue) indicators perfectly align with the XDC token. Based on this, he asserted that the next move for the altcoin could be a 10x pump. Related Reading: Fartcoin Reaches Critical Make-Or-Break Level: Analyst Reveals What Could Happen From $0.77 This XDC price surge is expected to target the Fibonacci levels between 1.414 and 1.618, rallying to between $0.50 and $0.80. The XRP analyst remarked that this is still below the previous cycles blow-off top, when the token soared by 3,350%. He expects XDC to replicate this explosive move, potentially surging to the $2 target. The XRP analyst alluded to the Stochastic Relative Strength Index (SRSI) as another bullish indicator. He revealed that the SRSI is waving bullish signals. The analyst admitted that there is still a long road for XDC to reach and sustain RSI levels above 80, but claimed that the momentum is definitely on the bulls side. In line with this, Egrag Crypto asserted that big moves could just be around for the altcoin. The Bearish Angle For The Altcoin The XRP analyst also provided a bearish angle for the XDC price. He revealed that the 21 Exponential Moving Average (EMA) is on the verge of crossing below the 33 Moving Average. If that happens, the analyst warned that it could turn super bearish. Related Reading: Altcoin Season In Danger If Bitcoin Dominance Closes April Above This Level However, he added that this crossover will most likely be avoided and that there could be a blow-off top before the inevitable retracement. The analyst also urged market participants to be attentive as the sharp move higher would come unexpectedly before a big crash to the downside. From a fundamental perspective, XDCs outlook also looks bullish. The XDC network just officially joined the MiCA alliance, which is a major step forward in aligning blockchain innovation with regulatory clarity in Europe. The team stated that the network is deeply committed to compliance, transparency, and building long-term trust. Like Ripples offering using XRP for cross-border payments, XDC is a layer-1 that offers real-world applications like trade finance, cross-border payments, and RWA tokenization. At the time of writing, the XDC price is trading at around $0.07, up over 1% in the last 24 hours, according to data from CoinMarketCap. Featured image from Getty Images, chart from Tradingview.com
XRP’s price action in the past seven days has been marked by a consistent decline from $2.25, putting the target at a probable break below $2. If XRP were to lose this support level, there’s a risk of a further crash until it reaches $1.6, as there isn’t a realistic support base between these levels. Nonetheless, an interesting technical indicator suggests that the cryptocurrency is headed for $9 by September 2025. Analyst Eyes $9 XRP Target Using Gann Angle Resonance Grid A crypto analyst recently posted a technical projection on the social media platform X, showcasing a long-term XRP price chart structured around the 1×1 Gann Angle Resonance Grid on the 3-day candlestick timeframe chart. According to the chart, the analyst anticipates XRP could reach a price target of $9.63 by early September 2025, aligning with the upper edge of the Topping Channel in the Gann grid. This projection stems from the intersection of the Gann channels resistance trendlines and a key Fibonacci market cap extension level at the 4.236 Fib, which the analyst identifies as a major confluence point. Related Reading: Analyst Says XRP Is Back, Heres Why Although a $9 target might seem a lot, as it would be far higher than XRP’s current all-time high of $3.40, it is quite conservative compared to some more extravagant predictions circulating within the XRP community. However, the $9 projection is the most realistic target based on the Gann angle resonance grid. As it stands, the XRP price is in the mid-base zone, now at the cusp of entering the upper band called the topping channel. The technical structure of the rally resembles a stair-step progression, with each consolidation phase occurring near major grid lines. Strong Support At $1.60, But $9 In September Although the long-term outlook is a strong surge, there is also a need to consider the possibility of a short-term downside movement. If XRP fails to hold the mid-base level just above $2.00, the next structural support zone is around $1.60. Related Reading: XRP Price Shoots For 20% Surge To $2.51 Amid Pullback To Breakout Zone Notably, the grid-based projection places XRP reaching the $9 target sometime around September 7, 2025. However, even if a strong rally and stronger inflows were to push XRP to this point, this might not be done in a straight line but gradually through a series of breakouts and pullbacks. The greater the breakout, the greater the pullbacks. At the time of writing, XRP is trading at $2.14, up by 2.14% in the past 24 hours with an intraday high of $2.17. Right now, all eyes are on whether it can break above the descending trendline that has capped its price movement into lower highs and lower lows in the past seven days. Featured image from Getty Images, chart from Tradingview.com
HBAR is gaining bullish strength amid overall market recovery from its weeks of volatility. With the recovery of BTC from support levels, altcoins like HBAR are gaining strength, offering traders and investors optimism for the breakthrough. A continuation above current levels of resistance may mark the start of a bullish trend. At the time of […]
Solana (SOL) continues to rise after breaking through a major resistance level and indicating strength within its existing uptrend. A formation of an ascending triangle pattern, which tends to be a positive indicator, reinforces the positive outlook. Traders and long-term investors are both watching intently in hopes of the potential for a long-term rally. If […]
Chainlink (LINK) ended the volatile week of trading on a clear bearish bias, falling below the $14 level as bearish sentiment controlled the market. LINK found it difficult to hold its ground in the face of general market volatility. The token started the week trading higher at prices around $15 but soon came under intense […]
Bitcoin Investors’ Outlook Shifts as 88% of Held BTC Supply Shows Profit The sentiment among Bitcoin investors is evolving as the majority of the cryptocurrency’s supply held by investors is currently in profit. This data reflects a shift in expectations and attitudes toward the digital asset. According to recent statistics, 88% of the total Bitcoin [...]
INJ, the native token of the Injective Network, commenced May with a fluctuating price action marked by a series of significant losses and gains. As INJ attempts to establish a stable price trajectory, popular market analyst with X handle Crypto Tony has highlighted a pivotal support zone for the altcoin in the coming weeks. Related Reading: Buckle Up, Injective (INJ) Primed For Takeoff Towards $50 Analyst INJ Must Not Fall Below $19.30 Level, Analyst Warns In an X post on Friday, Crypto Tony shared a vital insight on the INJ market which could create a sentiment of caution among many traders. The renowned analyst stated that INJ must maintain a market price above the $19.30 price zone, warning that a dip below this support level could spell danger for investors. While Crypto Tony did not say the extent of this danger, the possible loss seems to be likely massive as his statements implied the INJ bull traders could struggle to re-establish market control should the tokens price fall below the specified threshold. Furthermore, the analyst stated that early investors of INJ including himself would be immune to this potential downside. However, he still plans to pull out of the Injective market should the token lose its $19.30 support zone. Currently, INJ trades around $24.70 reflecting a gain of 4.68% in the last day after a period of intense market volatility. The altcoin appears to be gathering momentum for a bullish trend following negative performances in recent weeks resulting in a decline of 24.07% in the last 30 days. Related Reading: XRP Forms On-Chain Signal That Led To 16% Crash Last Time What’s Next For Injective? With respect to a highly anticipated crypto bull run, INJ, which gained by over 3,000% in 2023, has been marked by several analysts as one potentially favorable altcoin for investment in the coming weeks. Interestingly, these sentiments have been bolstered in recent weeks by a series of positive developments on the Injective network. For instance, Injective recorded 2.4 million transactions in a single day marking a new milestone in daily transactions for the Layer 1 network. In particular, the Injective 3.0 network upgrade has also been recently approved which is expected to tackle the inflationary problems of the INJ by decreasing the tokens minimum and maximum creation rate by 25% and 30%, respectively over the next two years on a uniform quarterly basis. Through these deflationary measures, it is expected that INJ would experience an increased scarcity which could, in turn, drive up the altcoins market value, thus contributing to a positive performance in the expected crypto bull run. However, investors are reminded that all cryptocurrencies are subject to varying levels of market volatility and are admonished to trade with all necessary caution. INJ trading at $24.66 on the daily chart | Source: INJUSDT chart on Tradingview.com Featured image from iStockphoto, chart from Tradingview
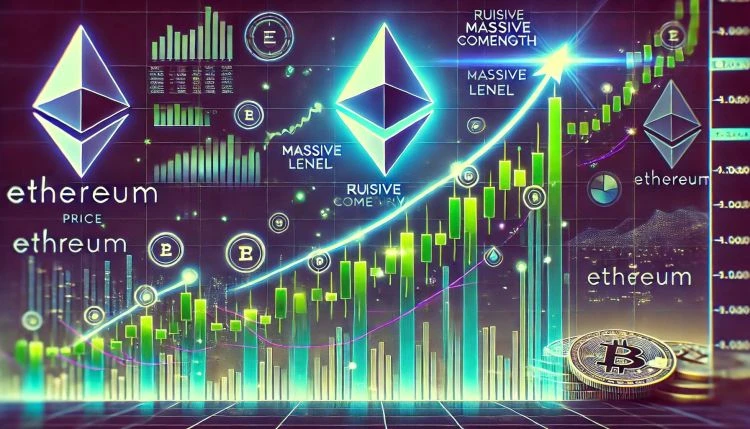
Ethereum is edging closer to a crucial Bitcoin price threshold that could result in significant gains, as seen in the past. With a potential 450% increase on the horizon, investors are eagerly watching the market dynamics unfold. The current trend in Ethereum’s price movements indicates a promising outlook for the cryptocurrency’s value. As it approaches [...]
An analyst has pointed out how Bitcoin recently closed below a historically important on-chain level, a failure to reclaim which could spell trouble for BTC. Bitcoin Fell Below Short-Term Holder Cost Basis In Latest Crash In a new post on X, Maartunn discussed BTCs recent close below the realized price of the short-term holders and [...]
The post Bitcoin Loses Historical Level, Analyst Says Reclaim And Bounce, Or Die appeared first on Crypto Breaking News.
In a strikingly optimistic forecast amidst favorable market conditions, cryptocurrency analyst and trader Edrag Crypto, has provided a bullish review for XRP, predicting that a massive run for the digital asset could be on the horizon. The analysis explores a confluence of positive market indicators and trends that demonstrates the potential for XRP to attract significant price surges and gains, positioning the coin as a promising asset in the ever-evolving world of cryptocurrency. Edrag Crypto’s bullish prediction for XRP is based on a Genuine Wake-Up line previously introduced by the expert, divided into two distinct sections, such as Break-out and Atlas Line. XRP Poised For Substantial Growth The analyst has expressed that while this wake-up line saw a successful breakout last year, it could not reach the heights anticipated by the analyst then. “Many moons back, I introduced the ‘Final Wake Up Line,’ which saw a breakout in July 2023. Yet, it didn’t quite soar to the heights we hoped for,” he stated. Related Reading: XRP Declares War On Uncertainty: Analyst Predicts Breakout Fueled By Regulation However, Edrag Crypto spotted a new development on XRP’s chart two weeks ago, which he indicated as a white triangle. According to the analyst, highs from 2021 are being incorporated into the white triangle. At that time, for XRP to witness a complete upward swing, it needed to break through the Genuine wake-up line with absolute conviction and then retest. Consequently, Edrag Crypto urged the community to remain firm, putting his wave 1 target at $7.5 and wave 3 at a 3-digit target, within the Macro wave 3. Presently, addressing the break-out aspect, the analyst has noted that the white triangle break-out is in perfect alignment with the Fibonacci 0.702 – 0.786 levels and his previous charts. It is expected that the measured move will be between $1.2 and $1.5, while the crucial break-out point is closer to $0.70 or $0.75. Due to this, Egrag Crypto affirms that XRP will see a breakout from the point in the upcoming weeks. Despite the possibility of a retest of the breakout, the expert believes that a mega run for the crypto asset is imminent. The Atlas Line Delving into the Atlas Line aspect, Egrag Crypto underscored XRP’s resilience in this area. According to the analyst, the asset is dominating the atlas line with a solid grip like a boss. Related Reading: Ready For Liftoff: XRP Price Primed To Skyrocket Before November He further pointed out a quick timeframe analysis revealing resistance at $0.5777, support at $0.5000, and a break-out point at $0.6799. Edrag Crypto’s prognosis has captured investors’ and enthusiasts’ attention alike, as they closely monitor these developments. At the time of writing, XRP was trading at $0.5284, indicating a 3% rise in the past week. While its market cap has reduced by about 1.28%, its trading volume has seen positive movement of more than 36% in the past day. Featured image from Shutterstock, chart from Tradingview.com
Traders disinterest in Bitcoin shorting during this bull cycle improves market stability, allowing people to anticipate smoother price
Onchain data shows that over $40 billion worth of XRP has been moved over the last week, which puts the altcoin on the edge. Specifically, these coins were transferred to exchanges, which indicates that XRP is at risk of a massive sell-off. Over $40 Billion XRP Moved To Exchanges CryptoQuant data shows that over $40 billion has been moved to Binance this past week, with the exchanges reserves surging during this period. This development is usually bearish as it indicates that investors are looking to offload their coins. This comes as the XRP price surged to as high as $2.6, which explains this wave of profit-taking. Related Reading: XRP Reaching Oversold Levels As Net Flows Turn Negative, Whats Next? Moreover, crypto analyst Ali Martinez revealed that Bitcoin whales have secured profits, selling over 30,000 BTC this week. As such, XRP whales may be simply mirroring this move. Meanwhile, Bitcoinist reported that XRP is reaching oversold levels as net flows turn negative, with the wave of sell-offs heightening. This selling pressure comes amid Judge Analisa Torres ruling in the Ripple SEC lawsuit, which provides a setback for XRP. The judge denied the parties’ motion for an indicative ruling because the filing was procedurally improper. The ruling also sparked a massive sell-off, with XRP dropping over 4%. XRP risks losing its bullish setup as Martinez revealed that the key support zone is at $2.38, meaning that a drop below this level could lead to a deeper correction. However, a hold above this level could set the altcoin for a rally to new highs as the analyst revealed that there are no major resistance clusters ahead. Crypto analyst CasiTrades had warned that XRPs failure to hold above the $2.69 resistance could send its price towards $2.30 for a reset. Altcoin Has Formed A Double Bottom Formation In an X post, crypto analyst Egrag Crypto revealed that XRP has formed a double bottom following the dip to $2.3126. He stated that the altcoin is still bouncing off the red descending trend line, showing resilience. The analyst added that the altcoin is experiencing some micro noise within the range between the Fibonacci 0.888 levels at $2.30 and $2.62. Related Reading: XRP Price Set To Continue Uptrend As Stochastic RSI Moves Out Of Oversold Zone His accompanying chart showed that the key is for the XRP price to hold above the trendline at $2.3. A bounce from this level could send the altcoin as high as $3.8, near its current all-time high (ATH) of $3.84. Based on its historical performance, Egrag Crypto still expects the altcoins price to rally to between $27 and $33 in this market cycle. At the time of writing, the XRP price is trading at around $2.37, down almost 2% in the last 24 hours, according to data from CoinMarketCap. Featured image from Getty Images, chart from Tradingview.com
XRP has re-entered a pivotal trading range against Bitcoin (BTC), stirring up excitement as technical signals suggest a potential breakout. This move is reinforcing its bullish position, highlighting three major price targets that could confirm a larger macro rally. XRP Sets Sights On Key Targets Against Bitcoin After months of consolidation, the XRP/BTC trading pair is now back inside a critical triangle formation, which market expert Egrag Crypto has identified as a key price range to watch for potential breakout or breakdown moves. The analyst shared a short-term XRP/BTC chart on X (formerly Twitter), explaining how important this price range is for the trading pair to hit new bullish targets and reach even larger goals. Related Reading: XRP Analyst Highlights Ultimate Targets And Selling Strategy As XRP Price Rebounds This triangle structure, dating back years, acts as a roadmap for XRP/BTCs potential breakout, but only if it successfully flips certain levels into support. The first major target highlighted by Egrag Crypto is $0.000003033, which represents the upper boundary of the triangle. A decisive breakout above this level would signal a structural shift, confirming a possible bullish breakout from the narrowing wedge. The analyst’s second key target is $0.00003430, the local high from XRP/BTC’s last rally. This price level is crucial for momentum validation, as flipping this into support with strong volume would build strong confidence in the next upward move and show confirmation that it can hold above it. The third and most critical target the XRP/BTC pair is expected to reach is $0.00004300, which aligns with the Fibonacci 1.0 level and XRP/BTCs previous cycle high. A move beyond this level suggests the beginning of a macro rally, unlocking access to higher Fibonacci extension levels, including: 1.272 Fib ($0.00007244) 1.414 Fib ($0.00009546) 1.618 Fib ($0.00014191) 1.888 Fib ($0.00030000) The Altcoin Must Hold Support Or Risk Macro Breakdown While Egrag Cryptos breakout targets paint an optimistic picture, the XRP/BTC LTC analysis comes with a stark warning of a potential crash. The analyst has raised alarm bells, warning not to lose the 0.618 Fibonacci level at $0.00002032. Related Reading: XRP Price To Break Out Of Consolidation: The Next Moonshot That Will Lead To $3 This support range acts as the last kind of defense for XRP/BTCs bullish market structure. The analyst goes as far as to say, Lose an arm, but dont lose this range, emphasizing the importance of maintaining this level. He further predicts that if the pair drops below this support level, it could see a decline to as low as $0.00000611. At the time of the analysis, XRP/BTC was trading at approximately $0.00002516, showing early signs of recovery after dipping below the triangle range. If bulls can defend this level and hold on to their upward momentum, the path toward flipping resistance levels into support becomes potentially clearer. Egrag Crypto has also outlined potential price projections for the XRP based on the bullish scenario where the XRP/BTC pair reaches several upper Fibonacci levels and Bitcoin rallies to key milestones. Featured image from Getty Images, chart from Tradingview.com
XRP is facing a strong resistance level on its path to the $3 price level and above, with the past 24 hours witnessing some sort of rejection at this resistance level. XRP price action has gradually built momentum in May, leading to a sharp move toward the upper $2.60 range. On May 12, XRP briefly touched $2.63 before retreating slightly, now trading around $2.57. Directly ahead is the major resistance at $2.69, and technical analysis shows that this zone now holds the key to whether XRP can continue its march toward $3.00 or undergo a pullback for consolidation. $2.69 Resistance Is Technical For XRP Price Crypto analyst CasiTrades has highlighted the $2.69 price point as an important resistance level for the XRP price moving forward. According to the analysts chart, which accompanied a post on social media platform X, this level represents the 0.236 Fibonacci retracement from XRPs all-time high and is a key level to watch for correction. Related Reading: XRP Price Marks Confluence Support, Technical Indicators Put Next Stop At $3 Notably, this zone has led to multiple retracements since December 2024, with each attempt seeing sellers quickly step in to defend it. It even proved difficult to break when XRP broke to reach $3.3 in January, and an order block was created on the daily candlestick timeframe just before the ensuing rally above it. As noted by the crypto analyst, momentum indicators have remained relatively muted during XRP’s recent rally. The crypto has also completed what appears to be a full 5-wave Elliott count from the analyst. However, instead of a retracement, the price has pressed forward slowly alongside the rest of the crypto market. This slow, controlled push higher often signals strong underlying demand, strong trend, and heavy accumulation. As it stands, the only thing left to do is to see how the XRP price performs at the $2.69 resistance. Breakout Or Rejection: Two Opposite Outcomes With High Impact The analyst warns that the $2.69 level could be a final barrier before XRP is cleared for a run toward $3.00 and beyond. A confirmed breakout, ideally with a strong daily candle close above this level, would invalidate short-term bearish pressures and cause a run above this level. Related Reading: XRP Price Still On Bullish Path To $5 As Long As This Level Holds However, if $2.69 once again proves too strong for bulls to overcome, the altcoin may enter a temporary cooling-off phase. In this case, the next logical support level is around $2.30, which is close to the 0.382 Fibonacci retracement level. This is another breakout/rebound zone that could offer a healthy reset for the XRP price. In either scenario, the price behavior at $2.69 is expected to set the tone for the rest of May and determine whether XRP can extend its 2025 bullish trend. At the time of writing, XRP is trading at $2.57, up 4% in the past 24 hours. Featured image from Getty Images, chart from Tradingview.com
XRP’s price action in the past seven days has been nothing short of impressive. The cryptocurrency reached above $2.6 again in the past 24 hours, the first time doing so since early March, about two months ago. This movement has aligned with the uptrend projected by multiple analysts, who are referencing Fibonacci levels to chart XRPs future trajectory. Notably, a crypto analyst’s interesting outlook on social media platform X using Fibonacci levels suggests that XRP will reach $8.40 and $27 this cycle. Analyst Points To Fibonacci Targets At $8.40 and $27 XRP’s price structure in the current cycle has been significantly shaped by its breakout above a tightening wedge formation, which had compressed price action from 2021 through the early months of 2024. This formation, clearly visible on the monthly candlestick timeframe, served as a multi-year consolidation zone that capped upward momentum and defined a range-bound market. Related Reading: XRP Price At $9 In September: Gann Angle Resistance Grid Predicts Surge The eventual breakout from this structure ended a prolonged bear market and began a fresh bullish phase. Although the past few months have been full of corrections and consolidations after XRP reached $3.31 in January, recent market momentum points to the next leg upward. A crypto analyst on social media platform X has pointed to two Fibonacci extension levels that could serve as the target zones during XRPs next impulsive wave up. According to the analysis, XRP reached both its 1.272 and 1.618 Fibonacci extension targets in the last cycle after breaking from a similar multi-year wedge accumulation structure in 2017. Interestingly, this move in 2017, leading up to the current price action, is part of the same Elliott wave count structure. As shown in the chart, XRP launched from a low of $0.00310 in 2017 to an all-time high of $3.40 in 2018 during its third wave (labeled (3)), hitting both Fibonacci extension levels of 1.272 and 1.618 before retracing in wave four. According to the analyst, the current price action since 2020 constitutes the formation of the fifth impulse wave. Applying the same extension logic to the current structure from the 2020 low of $0.11379, a move to these Fibonacci extensions points to a target of $8.40 at 1.272 and $27.23 at the 1.618 extension. XRP To Reach $8.40 Or Even $27 This Market Cycle? Whether XRP can realistically surge to $8.40 or even $27 during this market cycle is yet to be seen. Although the 2017 to 2018 rally where XRP climbed over 1,000% in a matter of weeks offers a compelling case, market conditions today are more complex. The amount of inflows and trading volume needed to push the XRP price to such levels would be far greater than those witnessed before. Related Reading: XRP Price Cross That Led To 20x Rally In 2017 Returns However, from a technical perspective, these Fibonacci targets can be reached when considering how similar price structures have behaved in the past. An example is the rally from $0.00310 to over $3.40 in 2017. One similar analysis from crypto analyst Ali Martinez suggests that the XRP price could reach $15 very soon. At the time of writing, XRP is trading at $2.50, up by 3.4% in the past 24 hours with an intraday high of $2.61. Featured image from Getty Images, chart from Tradingview.com
Ethereum is back above the $2,500 level after a massive surge that flipped market sentiment nearly overnight. Following months of intense selling pressure that began in late December 2024, ETH spent most of the first quarter struggling to gain traction. However, last weeks powerful rallyan 80% gain in less than a monthhas shifted the tone across the market, reigniting optimism and setting the stage for what could be the beginning of a broader altcoin recovery. Related Reading: Solana Rallies Into Pivotal Zone $180 Level Could Define Next Move Top analyst Jelle shared a technical analysis noting that while Ethereums breakout is impressive, the asset still has a lot of work to do. ETH is now testing a key supply zone that previously marked significant resistance. Whether bulls can push through this area or face a temporary rejection remains to be seen. Still, the magnitude and speed of this recovery suggest that Ethereum may have completed a capitulation bottom and is building toward a more sustainable uptrend. For now, reclaiming $2,500 is a significant psychological and technical milestone. With momentum turning and broader market strength building, Ethereums price action in the coming days could help define the trajectory for the entire altcoin sector in Q2. Ethereum Tests Key Resistance After Explosive Weekly Surge Ethereum has surged over 44% in less than a week, reclaiming major resistance levels with strength and shifting sentiment sharply from bearish to bullish. After months of underperformance, ETH is now leading the charge in what many analysts believe could be the beginning of a long-awaited altseason. The broader market is showing signs of renewed momentum, but Ethereums breakout is particularly significant as it often signals capital rotation into altcoins. ETHs rally has taken it from sub-$1,800 levels to just above $2,500, breaking through key resistance areas that had held since January. Now, the price is testing a crucial supply zone between $2,600 and $2,800a region that previously acted as a distribution top and major rejection point. A successful break above this level could open the door for a move toward $3,000 and beyond. Jelle highlighted the scale of Ethereums comeback, noting that this massive bounce came after the market had largely declared ETH dead. Prices are now firmly back above critical support, and the reclaim of $2,500 is a major technical milestone. Still, as Jelle points out, theres a lot of work ahead before a full recovery is confirmed. While short-term momentum is clearly bullish, Ethereum must consolidate and build structure above this resistance to establish a sustainable uptrend. If that happens, the narrative for altseason becomes significantly stronger, especially after years of drawdowns across the sector. The coming days will be key as Ethereum tests the upper end of this resistance range and sets the tone for altcoins heading into the summer. Related Reading: HYPE Bulls Regain Control After Sharp Recovery Approaching Yearly Highs? ETH Tests $2,600 Resistance As Momentum Builds Ethereum is trading at $2,570 after an explosive rally that pushed the price from under $1,800 to a new local high at $2,625 in just a few sessions. The chart shows a clear vertical breakout, driven by surging volume and reclaim of major moving averages. ETH has now decisively broken above its 200-day EMA (currently near $2,436) and is testing the 200-day SMA around $2,701a zone that represents a significant area of supply. The steep angle of ascent suggests strong bullish momentum, but the price is approaching a key resistance confluence. Historically, the $2,600$2,800 range has acted as both support and resistance, meaning bulls need to consolidate above $2,500 to sustain the uptrend. This move also follows months of consolidation and a long period of underperformance. After a 66% decline from its December highs, Ethereums current rally signals a potential trend reversal. If bulls maintain this pressure and break above the 200 SMA, it could trigger a rapid continuation to $3,000 and beyond. Related Reading: XRP Whales Are Back 880 Million Tokens Accumulated This Month However, volume should remain elevated, and volatility is expected as sellers may step in at these levels. A short-term pullback wouldnt invalidate the trend, but failure to hold above $2,500 could stall momentum. Featured image from Dall-E, chart from TradingView
XRP prices moved by almost 3% in the past day as the crypto market bounce continues. However, the prominent altcoin remains in danger of significant market downside. According to renowned X market expert Crypto Egrag, XRP must close above certain price levels to invalidate this bearish pattern and validate its bullish trajectory. Related Reading: Major XRP Accumulation Alert: Wallets Holding Over 10,000 Coins Cross 300,000 XRP Faces Critical Resistance At $2.41-$2.45, But $2.96 Represents Ultimate Challenge In a recent series of X posts, Egrag Crypto has previously stated that XRP was at a major crossroads facing a pivotal breakout or a potential retest. In line with the crypto market, XRP has seen a sustained price rebound since mid-April, gaining by 35.95%. However, Egrag Crypto warns that the altcoin is facing major resistance at the price range between $2.41-$2.45, which aligns with the descending trend line of the market correction that had dominated the first quarter of 2025. To strengthen the bullish case of its recent breakout, the analyst explains that XRP must move and stay above this price resistance, thereby neutralizing the bearish outlook. If XRP fails to make a convincing breakout above $2.41-$2.45 and slips into consolidation, the altcoin faces the potential of a retest to around $1.2-$1.3, representing a potential 46.05% decline from todays price. However, the analyst explains that such a retest would only provide a massive accumulation opportunity as the long-term outlook for XRP still remains bullish. In a following post on May 10, Egrag Crypto states XRP must also reclaim the $2.96 price zone to confirm a sustainable uptrend. Notably, the $2.96 price level represents the next major price resistance after the descending trendline and is the closest to the current local market top. Related Reading: Bitcoin Advanced NVT Sits Above This Critical Threshold What It Means For Price Action XRP Market Overview At press time, XRP is trading at $2.41, reflecting a 2.77% gain in the past day. On larger time frames, the altcoin holders are in significant profits as indicated by gains of 10.17% and 23.37% on the weekly and monthly charts, respectively. Generally, the market sentiment among XRP investors remains bullish, especially following recent developments in the legal case between Ripple and the US Securities and Exchange Commission (SEC). On May 8, the SEC announced a settlement that includes the return of $75 million held in escrow to Ripple, which comes months after the Commission signaled its intentions to terminate its appeal case against the blockchain company. With a market cap of $241.95 billion, XRP remains the fourth-largest cryptocurrency and third-largest altcoin in the digital asset space. Featured image from Pexels, chart from Tradingview
World Crypto Global opens the door to digital freedom for everyone.
Manage your free WCG Coins securely—where simplicity meets global accessibility.
FREE CRYPTO COINS
AVAILABLE FOR RESERVATION
ALREADY ALLOCATED

No fees. No catch. Your crypto journey starts here.