W o r l d . C r y p t o . G l o b a l

Loading

Welcome at World Crypto Global. This portal is packed with useful content and resources to built out your own crypto skills. WorldCrypto is a site member of Gabriel Vega Network.

Contact Info

CATEGORY: linkusdt


Is Chainlink (LINK) $12 Breakout Imminent? Data Reveals A Rising Open Interest

Author: Sebastian Villafuerte
United Kingdom
Sep 12, 2024 12:05

Is Chainlink (LINK) $12 Breakout Imminent? Data Reveals A Rising Open Interest

Chainlink is in a consolidation phase after weeks of volatility and selling pressure. The price currently holds above a support level of $10, a crucial liquidity level. The altcoin attracts the attention of analysts and investors who anticipate higher prices soon.  Related Reading: Solana (SOL) Surges Past $130 Resistance As Funding Rate Signals Bullish Momentum Data from Santiment reveals rising open interest, which signals sustained demand for Chainlink. As more traders and investors build positions, this increase in open interest suggests that a price rally could be on the horizon. This stabilization around the $10 mark has given some confidence to those who believe LINK may be poised for a breakout. Many analysts see this as a potential turning point for Chainlink, with its current price action reflecting growing optimism for future gains. If the consolidation holds and momentum builds, LINK could potentially push past its recent resistance and aim for higher levels. Chainlink Investors Showing Confidence  Chainlink is testing key supply at its current levels, and top traders and investors are confident in a potential rise for LINK in the coming weeks. One significant indicator signaling strength is the rising Open Interest (OI), as revealed by Santiment. OI tracks the number of active contracts tied to a cryptocurrency, serving as a reflection of market engagement. When OI increases, it signals growing liquidity and interest in the market, while a decrease in OI typically points to reduced exposure. From a price analysis perspective, a rise in OI combined with a price dip often confirms a continuing downtrend. On the other hand, if OI decreases while the price rises, it may signal a bearish reversal. In Chainlinks case, both OI and price are increasing, which suggests that the current uptrend could persist. As investors monitor the market, many are waiting for price confirmation above current levels to keep the momentum going and shift the overall negative sentiment that has clouded Chainlink in recent weeks. Related Reading: Cardano (ADA) Rally Brewing? On-Chain Metrics Suggest Investors Optimism LINKs breakout could fuel a bullish run, as traders expect a more bullish trajectory in the short term. The rising OI serves as a strong indicator that market participants are increasingly confident in LINK’s potential for further gains. LINK Price Testing Supply At $10.8 Chainlink (LINK) is trading at $10.40 after testing local resistance at $10.83, positioning for a potential breakout toward higher prices. The price is struggling to clear the 4-hour 200 moving average (MA) at $10.71, a key indicator that has acted as a resistance since late August. For bulls to maintain momentum, LINK must reclaim the 4H 200 MA and target the next resistance at $12.70. Breaking past this level would signal a reversal and could lead to a more sustained uptrend, offering investors hope for further gains. However, if LINK fails to break through the 4H 200 MA, the altcoin will likely face a pullback, with support anticipated at lower demand levels around $9.30. A failure to hold this support could result in even lower prices, reinforcing the downside risk for traders. Related Reading: Avalanche (AVAX) Ready To Target $28: Investors Expect A Reversal The coming days will be crucial for LINKs price trajectory as the battle between bulls and bears intensifies. Featured image from Dall-E, chart from TradingView

Aug 07, 2024 05:50

Chainlink Drops by 64% In 5 Months, LINK Holders Unfazed: They Are Rapidly Accumulating

Yesterday, August 5, LINK, the native currency of Chainlink, a decentralized Oracle provider, plunged to a six-month low. Changing hands at around $8, LINK fell by 64% from March highs, breaking out from a bull flag, signaling weakness. The correction was across the board, and leading altcoins like Solana and Cardano also posted sharp losses. [...]

The post Chainlink Drops by 64% In 5 Months, LINK Holders Unfazed: They Are Rapidly Accumulating appeared first on Crypto Breaking News.

Aug 02, 2024 12:05

Chainlink At Risk: Key Indicators Signal Further Losses To $12

Chainlink (LINK), one of the major players in the decentralized finance space, is currently facing increased bearish pressure in the market. As LINK’s bearish momentum continues to build, key technical indicators are signaling the potential for further loss toward the critical support level at $12 for the cryptocurrency. With this current price movement, Chainlink could continue to decline, testing lower support levels in the near future, unless there is a significant reversal in market sentiment. This article provides an in-depth analysis by evaluating the current market sentiment around Chainlink, examining key technical indicators, and identifying critical support levels along with their implications for LINK’s price stability. As of the time of writing, it had a market capitalization of over $7.7 billion and a trading volume of over $243 million.LINK was down by 3.75%, trading at around $12.82. In the last 24 hours, both the assets market cap and trading volume have declined by 3.72 and 1.67, respectively. Assessing Current Market Sentiment Around Chainlink Considering the asset’s price movements, it seems the current market sentiment around LINK is still negative. The price, currently, is actively trading below the 100-day Simple Moving Average (SMA), heading toward the $12 mark on the 4-hour chart.  This suggests that the bearish trend might continue. With more selling pressure, this position indicates that Chainlink is likely to decline further as long as it remains below the SMA. The 4-hour Relative Strength Index (RSI) signal line has successfully dropped below 50% into the oversold zone. This suggests that selling pressure is growing, and the asset might experience further downward movement towards the $12.44 level. On the 1-day chart, LINK’s market sentiment is also negative, with the price trading below the 100-day SMA. LINK is showing a bearish trend as it moves toward the $12.44 support level, having formed two bearish candlesticks. If the price breaks below this key level, it could signal further bearish momentum and potentially drive the price toward other support levels. Finally, the 1-day RSI has also dropped below 50%, which further supports the possibility of further price drop. This decline suggests that bearish pressure is rising, as sellers are still active and influential in the market. The fact that sellers are still active implies that LINK will probably continue to decline. Identifying Critical Support And Resistance Levels Chainlink is currently on a bearish path, heading toward the $12.44 support level. If the price breaks and closes below the $12.44 support level, it may continue its bearish movement toward the next support range at $11.10 and possibly even lower levels. However, if the digital asset encounters resistance at $12.44 and fails to break below, it could lead to a potential upward move, reaching the $15.25 resistance mark. Should the price rise above this level, further gains could occur, targeting the $17.96 resistance point and beyond. Featured image from YouTube, chart from Tradingview.com

Jul 09, 2024 12:05

Analyst Predicts ChainLink (LINK) Rally To $13 Could Result In 45% Price Correction, Heres Why

The decentralized oracle network ChainLink and its native token, LINK, have staged a price recovery amid the broader cryptocurrency market’s bounce from a recent significant correction.  Despite experiencing a 16% price retracement over the past month, LINK has regained its stronghold, rising 5% to $13 in the past 24 hours after hitting a six-month low of $11 on Friday. Still, cautionary signals have emerged that caught the attention of crypto expert Ali Martinez.  Bearish Signals For ChainLink  In a recent social media post, Martinez raised concerns about a pattern visible on LINK’s daily chart, suggesting the potential for a substantial price correction ahead.  Specifically, the analyst highlighted a possible retest of the neckline of the head-and-shoulders pattern during the recent upswing to $13.  Related Reading: Mass Adoption? NEAR Protocol Sees Over 12 Million Unique Addresses In 30 Days According to Martinez, this pattern indicates a continuation of the downtrend until the right shoulder is broken, meaning that the ChainLink price would have to break above the $20 level, the top of the right shoulder, to invalidate this scenario. If this scenario is as predicted, ChainLink could face a 45% correction. Martinez previously highlighted the likelihood of such a correction if LINK were to break below the $12.70 support level.  The token’s price might retrace significantly in this bearish scenario, potentially reaching as low as $6.60. Notably, these levels were last witnessed in September 2023, before the commencement of the overall market uptrend that began in November of the same year. Key Levels For LINKs Price Recovery Another analyst, Crypto Ambrosio, presents similar downward scenarios for the ChainLink price in a recent analysis of key indicators.  The analyst suggests that if the 20-week exponential moving average (EMA), depicted by the yellow line in the chart above, remains above the current price action, it would serve as a notable bearish signal for the token. However, breaking above this indicator situated at $14.75 would invalidate this bearish outlook. Additionally, Crypto Ambrosio noted a downtrend pattern in the Relative Strength Index (RSI), further supporting the notion of a new downtrend for ChainLink. To counter these bearish signals, it is crucial for LINK to hold the $12 support level, as noted by the analyst.  Ambrosio also believes that if ChainLink forms a Falling Wedge pattern and breaks the resistance at $15, it could signal a bullish reversal and pave the way for further price recoveries toward its yearly high of $22.89, reached in March. Related Reading: Bitcoin Starts July On A Bearish Note, Will CPI Data Change The Narrative This Week? The token must overcome key upper resistance levels while trading at $13.28 to initiate a potential price recovery. Upon analyzing the LINK/USD daily chart, the token will likely encounter its first significant challenge at the $13.52 price level, which has acted as a resistance for the past two months. Moreover, to invalidate the extension of the bearish scenario and surpass the 20-week exponential average, the ChainLink price would need to surpass and consolidate above the $14.38 resistance level.  Featured image from DALL-E, chart from TradingView.com

Jul 28, 2024 12:05

Analyst Says Chainlink Price Could Climb To $19 Heres How

In recent months, the Chainlink price hasn’t quite been able to replicate the bullish strength it showed at the start of the year. And the past week was a prime example of the coins recent struggles, as the bulls failed to completely stamp control over the last seven-day period. However, it appears that the LINK price inconsistencies might be coming to an end soon, as a popular crypto analyst has identified a bullish pattern on the tokens price chart. How LINK Price Could Soar 48% To Reach $19 Prominent crypto analyst Ali Martinez has shared via a post on X an exciting prognosis on the future trajectory of the Chainlink price. According to the crypto pundit, the cryptocurrency, which has largely struggled, could be set for a price turnaround over the next few weeks. Related Reading: Analyst Says XRP Remains Strongest Compared To Bitcoin And Ethereum, Heres Why The rationale behind this bullish projection is the formation of an inverse head and shoulders pattern on the LINK four-hour price chart. The inverse head and shoulders formation is a technical analysis indicator that features a head (a lower low) in between two shoulders (usually a lower low and a higher low). This chart formation whether in the normal or inverse form is a significant indicator for identifying trend reversals. Specifically, the inverse head and shoulder pattern suggests a shift from a bearish to a bullish trend when the price breaks the neckline, an imaginary line that runs through the peaks of the troughs. Martinez noted in his post on X that the price of Chainlink could make a run towards the $19 mark over the next coming days. However, the cryptocurrency must break above the neckline around the $15 level, as shown in the chart above. A rally to the $19 mark would represent an almost 50% price leap from the current price. And a return to this price level would be most welcomed by the altcoin’s investors, having spent the last two months beneath it. Chainlink Price At A Glance As of this writing, the Chainlink price has jumped slightly above $13.5, reflecting a 3.6% increase in the last 24 hours. However, this price gain is not significant enough to wipe the tokens loss over the past seven days. Related Reading: Toncoin Under Pressure As TON Price Falls Below 100-Day SMA, $6 Looms According to data from CoinGecko, the LINK token experienced a 3% decline in value in the past week. Nevertheless, the cryptocurrency still ranks among the top 20 largest assets in the sector, with a market cap of more than $8.2 billion. Featured image from Unsplash, chart from TradingView

Jul 14, 2024 12:05

Chainlink Investors In Accumulation Mode LINK Price Primed For A Rally?

The price of Chainlink has mostly struggled in the past few weeks, mirroring the stagnant condition of the general market. Interestingly, investors seem motivated to keep faith in the altcoin rather than be discouraged by the sluggish price action observed in recent weeks. According to the latest on-chain revelation, investors appear to be shifting to a long-term holding strategy, with a focus on the future promise of the Chainlink token. This leaves the question could the LINK price be primed for a rally? $110 Million Worth Of LINK Leave Centralized Exchanges According to the latest on-chain observation, the Chainlink token appears to be undergoing an accumulation trend, with investors moving their assets from centralized exchanges. Latest data from IntoTheBlock shows that approximately 8.7 Million LINK tokens (worth about $110 million) have been withdrawn from exchanges in the last two weeks. Related Reading: Analyst Predicts 2,750% Celestia (TIA) Price Explosion To $188, Heres The Roadmap This observation is based on the Netflows metric, which tracks the difference between the amount of tokens that are transferred in and out of centralized exchanges. When the value of this metric is negative, it implies that more assets are leaving than entering crypto exchanges. Conversely, a positive value of the Netflows metric indicates that more assets are flowing in than out of exchanges. While it is difficult to unravel the rationale behind the increased outflow of Chainlink tokens from exchanges, the exodus of massive LINK amounts signals a shift in investor sentiment. Specifically, the direction of the funds movement suggests an increase in investor confidence, as they appear to be moving their tokens away from trading platforms. IntoTheBlock said in the post:  Such activity is typically associated with an accumulation phase, indicating that investors are moving $LINK off exchanges and into long-term holdings. A corroborating data point came from another blockchain firm, signaling major accumulation by major Chainlink stakeholders. According to Santiments data, investors holding between 10,000 – 1,000,000 coins have added 9.2 Million LINK since June 24. This brings the holdings of this investor cohort to 207.29 million coins, an 8-month high. Chainlink Price At A Glance As of this writing, the price of LINK stands around $12.94, reflecting a 3.4% increase in the past 24 hours. According to CoinGecko data, the Chainlink token is up by 2.5% in the past week. However, this recent show of strength hasn’t been to reverse Chainlinks almost 10% decline in the past two weeks. On a positive note, though, the declining supply of LINK tokens on centralized exchanges could set the stage for a bullish rally for the altcoin.  Related Reading: Bitcoin Price Trajectory Remains Bearish, $49,000 Liquidity Zone Looms As Next Downside Target Featured image from Binance Academy, chart from TradingView

Jun 24, 2024 12:05

19 Million Chainlink Tokens Transferred To Exchanges More Downside For LINK Price?

The cryptocurrency market witnessed severe bearish pressure over the past week, and the price of Chainlink (LINK) wasn’t an exception. The altcoin has continued to struggle with its torrid form, losing nearly 10% of its value in the last seven days. Interestingly, the bears seem to still be in control at the moment, with the latest on-chain revelation suggesting that there might be further downside for the LINK price over the next few days. Are Chainlink Investors Offloading Their Assets? Popular crypto analyst Ali Martinez revealed in a post on the X platform that huge amounts of the Chainlink token have made their way to centralized exchanges in the past day. This on-chain observation is based on Santiments Supply on Exchanges metric, which tracks the amount of a particular cryptocurrency being held on centralized exchanges. Related Reading: Little-Known But Important Dogecoin Indicator Goes Off, How High Can It Drive Price? When this metrics value increases, it implies that investors are making more deposits than withdrawals of a cryptocurrency (Chainlink, in this case) into centralized exchanges. A decrease in the metrics value, on the other hand, indicates that holders are moving their coins out of the trading platforms. According to data from Santiment, more than 18.77 million LINK (worth roughly $256.2 million) were transferred to cryptocurrency exchanges in the past day. This substantial transfer represents one of the largest single-day movements for the Chainlink token in recent months.  Interestingly, a report from SpotOnChain revealed that 21 million tokens were unlocked from Chainlinks non-circulating supply contracts on Friday, June 21. Specifically, the contract transferred 2.25 LINK tokens were sent to the multi-sig wallet 0xD50f More notably, 18.25 million LINK tokens were sent to Binance, the worlds largest cryptocurrency exchange. This significant token unlock presents a case of supply inflation, which can impact the value of the token especially if a sell-off occurs. Moreover, these fund movements can precipitate an increase in market volatility and possibly lead to price fluctuations. Given the magnitude and destination of these transfers, there is a greater likelihood of increased selling pressure, which can drive down the price of LINK.  Is A Return To $12 On The Cards? As of this writing, the price of Chainlink is barely holding above $13.6, having declined by more than 3% in the past day. Meanwhile, the altcoin slumped 9% from about $15 to $13.5 over the past week, according to data from CoinGecko. If the recent selling pressure continues, then further decline might be on the horizon for LINKs price. This could see the cryptocurrency make a return to around the $12 price zone for the first time in more than a month. Related Reading: Toncoin Transfer Volume Hits $10 Billion, Social Appeal Soars Nevertheless, the Chainlink token ranks amongst the top 20 largest cryptocurrencies in the sector, with a market capitalization of over $8.27 billion. Featured image from Binance Academy, chart from TradingView

Jun 02, 2024 05:50

Chainlink Is Not Done: Analyst Predicts 300% Rise Against Bitcoin

A crypto analyst has highlighted the Chainlink remarkable resilience amidst market volatility, predicting that the cryptocurrency is getting ready to witness a 300% surge against Bitcoin, the worlds largest cryptocurrency.  Chainlink Poised For 300% Increase Against Bitcoin Chainlink, a decentralized blockchain oracle network has been gaining traction recently, bolstered by the innovative developments within its [...]

The post Chainlink Is Not Done: Analyst Predicts 300% Rise Against Bitcoin appeared first on Crypto Breaking News.

May 10, 2025 12:10

Chainlink Holds Strong At $15.29 Support Is A New Breakout Imminent?

Chainlink (LINK) continues to showcase resilience, holding firm within a well-established uptrend as the price consolidates near a critical support level at $15.29. This zone, which has previously acted as a launchpad for bullish momentum, is once again drawing attention as bulls defend it with determination. The current price action suggests that the market is taking a breather, potentially setting the stage for a fresh leg higher. With bullish sentiment gradually building and support holding steady, speculations are whether LINK can capitalize on this consolidation and ignite its next rally toward higher resistance zones. Why Chainlink Bulls Are Still In Control The current price action reveals that Chainlink has resumed its upward movement following a brief and healthy pullback. After testing the immediate support zone and holding firm above the $15.29 level, the bulls have stepped back in with renewed confidence. LINKs rebound suggests that the temporary pause in momentum was likely a consolidation phase rather than a full-fledged reversal, allowing the market to reset before continuing its ascent. Related Reading: Chainlink (LINK) Targets Rebound To $19 But Only If This Key Support Holds One of the standout bullish signals is LINKs recent break above the 100-day Simple Moving Average (SMA). This moving average often acts as a dynamic resistance in downtrends, and a successful close above it suggests a potential trend reversal or continuation of bullish momentum. Such a move typically garners the attention of technical traders, increasing the likelihood of follow-through buying pressure. Further confirmation comes from the MACD (Moving Average Convergence Divergence) indicator, which has now made a bullish crossover and climbed above the zero line. This momentum shift reflects a strengthening buying trend and hints that LINK could be gearing up for a broader breakout. If the current setup holds, LINK may soon challenge higher resistance zones, opening the door for a sustained rally. What Could Derail The Uptrend? While Chainlink shows promising signs of continuing its uptrend, the bullish momentum is still at risk. A failure to hold above the immediate support at $15.29 could invite increased selling pressure and signal a potential shift in sentiment. If bears push the price below this level, a deeper retracement toward the next major support zones is probable. Related Reading: Chainlink Shake-Up: Investors Pull $120 Million From Exchanges Additionally, overbought signals from momentum indicators such as the RSI might suggest exhaustion among buyers if they begin to flash warning signs. A bearish crossover or weakening in the MACD could further confirm waning strength. Traders should also be cautious of broader market volatility or negative macroeconomic developments, which can weigh heavily on sentiment even for technically strong assets like LINK. Keeping an eye on volume and price reaction at key levels will be critical to assess whether the uptrend remains intact or is at risk of faltering. Featured image from Pixabay, chart from Tradingview.com

May 29, 2024 12:05

Chainlinks Performance Crucial For Altcoin Market, Analyst Suggests Rally Ahead

Chainlink (LINK) has recently been identified as a significant influencer within the altcoin sector. Noted by crypto analyst Michaël van de Poppe, LINK’s market movements are increasingly seen as a barometer for the broader altcoin ecosystem. This observation places Chainlink at the center of potential market trends, suggesting that its performance could presage movements across other cryptocurrencies. Related Reading: While Ethereum Shines, Top Analyst Reveals His Best Under-Radar Altcoin Chainlink $16 Mark: Catalyst for Altcoin Market Optimism Van de Poppe’s analysis, shared on social media platform X, underscores the importance of Chainlink’s price stability around the $16 mark. Maintaining this level is crucial for sustaining LINK’s upward trajectory towards yearly highs. This sentiment reflects broader market optimism surrounding Chainlink, particularly as it navigates pivotal price points. Strong momentum for #Chainlink. Apparently, Chainlink is an indicator for the altcoins. If Chainlink does well, then I expect the altcoins to continue moving. As long as $16 holds, we’ll see a continuation on Chainlink towards the yearly highs. pic.twitter.com/nOl1r3gicW Michaël van de Poppe (@CryptoMichNL) May 28, 2024 Over the past week, Chainlink has shown robust performance, registering a near 10% increase and stabilizing above the critical $16 threshold. Current trading prices are around $18.09. This uptrend coincides with a general bullish sentiment across the altcoin market, highlighted by the overall market cap for altcoins increasing from $930 billion earlier in the month to $1.156 trillion. This positive trend in the altcoin market is further exemplified by the major cryptocurrencies like Ethereum, BNB, and XRP, which, despite minor retracements, continue to show strong market potential. For instance, while these top altcoins have seen slight declines in the past 24 hours, Solana has experienced a 2.7% increase, which could indicate selective investor confidence in specific altcoins. Analysis and Predictive Insights So far, the altcoin market cap shows a recent breach and conversion of major resistance into support, marking a brewing upsurge in the altcoin market. Meanwhile, trader Tardigrade from the crypto analytics community has recently posited that the altcoin market could triple if the ‘Crypto Total Market Cap excluding Bitcoin’ successfully breaks out of its current inverse Head & Shoulders pattern. #Altcoin market will surge 3x if $Total2 (Crypto Total Market Cap excluding #Bitcoin) breakout this inverse Head & Shoulders Pattern. We are now at the end of the right shoulder. It is expected to breakout in a few weeks time according to this pattern.#Altseason #ETH #SOL #Alts pic.twitter.com/sIEZ99xwfg Trader Tardigrade (@TATrader_Alan) May 26, 2024 This breakout is anticipated to occur within the next few weeks, marking a possibly transformative period for the altcoin market. Related Reading: Altcoin Season Soon? Quant Says This Ethereum Pattern Could Suggest So Echoing this bullish outlook, RektCapital points out the possibility of the Altcoin Market Cap achieving its highest weekly close since early April 2024, adhering closely to previously outlined projections. Featured image created with DALL·E, Chart from TradingView

May 21, 2025 12:05

Chainlink In Rally Mode: Rising Channel Formation Signals Continued Climb

Chainlink (LINK) is showing renewed strength as its price moves higher within a well-defined rising channel pattern. After a period of consolidation, LINK has entered a rally mode, forming the channel, a classic signal of sustained upward movement. This technical setup suggests that the bulls are firmly in control, and unless a major shift in sentiment occurs, the uptrend could continue in the short to mid-term. Chainlink Breaks Above 200 MA: Bullish Momentum Builds On M30 In an X post, crypto analyst Thomas Anderson highlighted that Chainlink is exhibiting notable bullish momentum on the 30-minute (M30) timeframe. According to Anderson, LINK has successfully broken above the 200-day moving average (marked in red on the chart), a significant technical milestone that often signals a shift in market sentiment. At the time of his post, LINK was trading around $15.560 and was actively forming an ascending channel,  a bullish price pattern characterized by consistently higher lows and higher highs. Related Reading: Chainlink Holds Strong At $15.29 Support Is A New Breakout Imminent? Anderson noted that the current price structure reflects sustained buying interest, with the Relative Strength Index (RSI) sitting comfortably at 64.23 just below overbought territory, indicating healthy momentum. Additionally, the MACD (Moving Average Convergence Divergence) indicator is in positive territory, further reinforcing the strength of the ongoing uptrend. However, he cautioned traders to remain vigilant as the price approaches the upper boundary of the ascending channel. This zone could act as a short-term resistance level, triggering a pullback or consolidation phase before further upside. Overall, the outlook for Chainlink on the M30 chart remains bullish. LINK Flips Bearish Structure On Daily Timeframe A crypto analyst @Whales_Crypto_Trading shared a bullish outlook on LINK, noting that the asset is currently breaking out of a descending channel on the daily timeframe. This long-standing pattern had previously kept LINK locked in a downward trajectory, but the recent price action suggests that momentum is shifting in favor of the bulls. A breakout from this structure is typically seen as a strong technical signal, indicating the potential for a significant trend reversal. Related Reading: Chainlink Flashes Daily Buy Signal Breakout Next? According to the analyst, a complete descending channel pattern suggests that Chainlink is no longer confined in a bearish trend and may now be positioned for a substantial upside move. With market sentiment showing early signs of turning positive, the breakout could mark the beginning of a new bullish phase for LINK, supported by improved technical indicators and increasing volume. He concluded by stating that this breakout sets the stage for a massive rally, with $28 identified as the next major target. Reaching this level would represent a strong recovery and a clear signal that bulls have regained control.  Featured image from Freepik, chart from Tradingview.com

May 21, 2024 12:05

Crypto Analyst Sounds Warning Alarm For Potential 50-60% Crash In Chainlink Price, Heres Why

Crypto analyst CrediBULL Crypto recently warned that Chainlink (LINK) could experience a 50% to 60% drop in its price. However, based on his explanation, LINK holders may not have cause to worry as such a price drop is part of the crypto tokens growth. Why Chainlink Will Experience A Price Drop CrediBULL Crypto explained in an X (formerly Twitter) post that a 50-60% drawdown is normal, natural, and healthy given that Chainlink has experienced ten months of up only and a 4x rally. The analyst expects this price drawdown to last about two to three months and suggested that Chainlink could see brief price surges, but that doesnt invalidate the current bearish trend.   Related Reading: Crypto Analysts Reveal Sub-$1 Altcoins Set To Outperform In The Bull Run In a video posted on his YouTube channel, CrediBULL Crypto further explained why he is so confident in shorting Chainlink. He alluded to the rise in the crypto tokens open interest and claimed that many levered players entered Chainlink on the pump to a major resistance level. He expects that those investors who opened longs will likely begin to close their positions as soon as Bitcoin experiences a pullback and the crypto market starts bleeding again.  The crypto analyst added that these investors will capitulate at the lows, which will bring Chainlinks price to the range lows. CrediBULL Crypto claimed that this move will bring LINK back down to $11.96, about a 30% drop from its current price levels. Based on this, he revealed that he will be looking to short Chainlink around $16, which is the likely level for rejection.  Same Expectations For Meme Coins CrediBULL Crypto also expects meme coins to experience a significant price drawdown, given the parabolic rally they have enjoyed since the beginning of the year. Meme coins Dogwifhat (WIF) and Pepe (PEPE) have been the most significant year-to-date (YTD) gainers among the top 50 crypto tokens, with price gains of over 1,400% and 500%, respectively.  The crypto analyst warned that some major meme coins have already seen their tops and will likely experience significant declines. In the YouTube video he posted, he also gave insights into how low Dogecoin, WIF, and Pepe could drop.  Related Reading: Crypto Expert Willy Woo Predicts Bitcoin Has Room To Run Here Are The Drivers For Dogecoin, he predicts that the foremost meme coin could drop to as low as $0.10. However, CrediBULL Crypto noted that he cant short Dogecoin yet because he expects a relief pump to $0.18, the range he is looking to open a short position.  Meanwhile, he predicts that WIF could drop to as low as $1.6, revealing that he will be looking to short it at $3.90 because he expects the meme coin to enjoy one last push to the upside before dropping to the downside. CrediBULL also predicts a significant price decline for PEPE. He claims the meme coin could experience a drawdown of as much as 60% since it recently hit a new all-time high (ATH). Featured image created using Dall.E, chart from Tradingview.com

Chainlink Struggles At Key Resistance Level  $10 Support Back In Focus

Author: Sebastian Villafuerte
United Kingdom
May 20, 2025 12:05

Chainlink Struggles At Key Resistance Level $10 Support Back In Focus

After weeks of consistent buying pressure and bullish sentiment, Chainlink (LINK) is now facing a critical moment. The price failed to reclaim the $18 resistance level and has since dropped more than 16%, showing signs of weakening momentum. This recent rejection has sparked concerns among investors and traders, as downside risk intensifies in the short term. Related Reading: Cardano Whale Activity Spikes 80 Million ADA Added In 48 Hours Top crypto analyst Ali Martinez shared a technical analysis pointing to a potential retracement toward lower demand levels. According to Martinez, the recent failure to break above key resistance may trigger further selling pressure, especially if broader market conditions remain uncertain. He suggests that LINK appears to be losing its bullish structure and could be preparing to revisit lower support levels before any meaningful rebound. Chainlinks current position highlights a shift in sentiment, as bulls struggle to hold key zones. While the broader market remains relatively stable, LINK’s inability to maintain higher levels could signal an early sign of deeper correction if volume and momentum do not pick up. With volatility returning to the altcoin space, the coming days will be decisive for Chainlink. Holding above interim supports will be key if bulls want to regain control and avoid further losses. Chainlink Struggles As Momentum Fades: Downside Risks Grow Chainlink (LINK) is showing signs of exhaustion after weeks of upward movement, now trading under mounting pressure as the market grapples with renewed volatility and global financial uncertainty. Bulls remain active, defending key demand zones and continuing to call for a breakout, but fading momentum and growing fear are starting to weigh on sentiment. The failure to breach the $18 resistance level marked a turning point. Since then, Chainlink has slipped over 16%, losing critical support zones and entering a vulnerable technical position. According to Martinez, this rejection could be the start of a deeper correction. Martinezs analysis suggests that LINK is now poised to revisit the $10 level a psychological and structural support that aligns with historical price behavior. The next few trading sessions will be crucial. If bulls cant reclaim higher levels or at least stabilize price action above $14, the selling pressure could accelerate. Adding to the uncertainty is a broader lack of clarity in global markets, with investors closely watching central banks, inflation data, and geopolitical developments for guidance. While some traders are still positioning for a bounce, the current structure points to caution. Chainlinks performance in the coming days could either confirm a local top or offer a high-risk, high-reward entry point if support holds and momentum returns. Either way, the $10$12 range may soon be tested, and how LINK responds there will define its next major trend. Related Reading: XRP Flashes Bullish Signal Technical Indicator Hints At Imminent Rebound LINK Faces Pullback As Buy Pressure Weakens Chainlink (LINK) is under pressure after failing to hold above the $17.50$18 resistance zone. The daily chart shows a sharp rejection near the 200-day SMA (currently at $17.79), followed by a 16% drop that pushed LINK below the 200-day EMA ($16). This move confirms a breakdown of bullish momentum and highlights growing downside risk as traders reassess short-term expectations. Volume has picked up during the recent pullback, suggesting active profit-taking or renewed selling interest. The current support zone lies around $14.80$15.00, a region previously tested in late April and early May. If bulls fail to hold this level, the next major support rests closer to $13.20, potentially opening the door for a deeper correction toward the $10 markan area cited by analyst Ali Martinez. Related Reading: Ethereum Faces Resistance Against Bitcoin ETH/BTC Bullish Structure In Question To regain momentum, LINK must first reclaim the $16 zone and flip the 200 EMA back into support. A daily close above both the 200 EMA and SMA would shift sentiment and restore the bullish structure. Until then, traders should watch for continuation signals or further weakness, especially if broader market volatility persists. LINK is in a make-or-break phase, with the next few days likely to set the tone for its short-term trajectory. Featured image from Dall-E, chart from TradingView

May 17, 2024 05:55

Major Success For Chainlink: US Banks Pilot Program Propels LINK Price Up 6%, Details

The Depository Trust and Clearing Corporation (DTCC) has partnered with blockchain oracle Chainlink and several prominent banking institutions in the United States to conduct a successful pilot aimed at accelerating the tokenization of funds.  The collaboration has not only paved the way for the adoption of blockchain technology in the traditional asset management sector but [...]

The post Major Success For Chainlink: US Banks Pilot Program Propels LINK Price Up 6%, Details appeared first on Crypto Breaking News.

Apr 07, 2025 12:10

Chainlink (LINK) Targets Rebound To $19 But Only If This Key Support Holds

Despite a widespread weekly gain in the crypto market, Chainlink (LINK) remains under significant bearish pressure printing losses across multiple time frames. Since hitting a local price peak of $29.28 in December, the altcoin has slipped into a downtrend losing over 56% since then. Amid this negative performance, top crypto analyst Ali Martinez postulates LINK could soon experience some short-term price gain. Related Reading: Massive Chainlink Demand Wall At $6.26 As 90K Investors Buy 376M LINK LINK Recovery Depends On Critical Trendline Support  In a recent post on X, Martinez shares a positive technical outlook on LINK hinting the altcoin is likely to experience an upswing. This price forecast is based on a crucial ascending trendline that has acted as price support since mid-2023, ensuring a consistent formation of higher lows and higher highs. Based on the trading chart by Martinez, Chainlink is currently heading for a retest with the identified trendline near the 0.5 Fibonacci retracement level at $12.00. If LINK bulls can induce a sufficient surge in demand at this level, the following price bounce could ignite a bullish reversal. Looking at historical price patterns, such a price rally could drive Chainlinks price to around $19, which represents the next resistance zone. In the presence of robust buying pressure, the altcoin could even rise as high as $30 suggesting a potential 147% price increase on current market prices. On the other hand, a failure to stay above $12.00 would cause an initial price decline to around $10.00, with the potential to trade as low as $5.00. Related Reading: Bitcoin Taker Buy Volume Witnesses Notable Spike Is BTC Price Next? Chainlink Integrated Into PayPals Ecosystem In other news, prominent American payment platform PayPal Holdings has announced the inclusion of Chainlink in its crypto offerings. In a statement released on April 4, PayPal stated that users will now be able to buy, hold, send, and receive Chainlink and Solana (SOL) on both their PayPal and Venmo wallets. This development marks a significant step in the mainstream integration of LINK which is crucial to driving token demand in the future. In addition to both tokens, PayPal also offers users access to Bitcoin (BTC), Ethereum (ETH), Litecoin (LTC), and Bitcoin Cash (BCH). At press time, LINK continues to trade at $12.91 reflecting a 0.62% decline in the past 24 hours. On larger time frames, the token maintains a bearish form with losses of 5.03% and 21.81% in the past seven and thirty days respectively. According to data from Coincodex, investor sentiments in the LINK market remain highly bearish with a Fear & Greed Index of 26 signaling near-extreme fear. However, the analysts at this firm foresee a price rebound similar to Martinez’s with a forecast of $15.32 in five days and $17.46 in a month.  Featured image from Virtune, chart from Tradingview

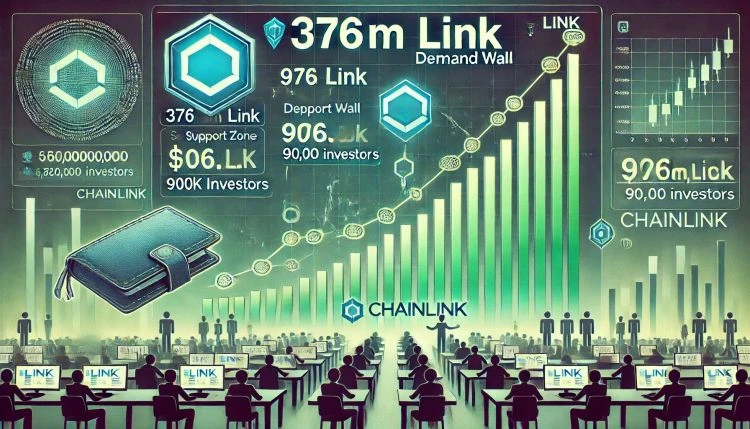
Massive Chainlink Demand Wall At $6.26 As 90K Investors Buy 376M LINK

Author: Sebastian Villafuerte
United Kingdom
Apr 06, 2025 12:05

Massive Chainlink Demand Wall At $6.26 As 90K Investors Buy 376M LINK

Chainlink is currently trading at critical demand levels as the broader crypto market faces ongoing pressure. With global financial conditions growing increasingly fragile, volatility continues to dominate across risk assets. Geopolitical tensions and sweeping tariffs imposed by world leaders including recent moves by US President Donald Trump have only added to the uncertainty, shaking investor confidence and stalling bullish momentum in crypto. Related Reading: Ethereum Whales Buy the Dip Over 130K ETH Added In A Single Day Amid this backdrop, Chainlink has struggled to reclaim higher ground, instead consolidating around a key support zone. According to on-chain data, LINK’s most critical demand wall sits at $6.26. This concentration of buying interest marks a potentially strong support area that bulls must defend to avoid a deeper correction. As markets react to shifting macroeconomic signals, Chainlinks ability to hold this demand zone could determine its next move. If this level fails, additional downside may follow. But if it holds, it could serve as the base for a potential rebound once sentiment improves. For now, all eyes remain on LINKs price action as it tests one of the most important accumulation zones on its chart. Chainlink Consolidates As Next Demand Level Lies Below Despite broader market uncertainty, Chainlink remains one of the most prominent players in the real-world asset (RWA) tokenization narrative a sector expected to see substantial growth in the coming years. As traditional finance continues exploring blockchain infrastructure, Chainlinks oracle technology and decentralized data feeds remain essential to bridging off-chain assets with on-chain applications. However, in the short term, LINKs price action has mirrored the broader crypto market downturn. Chainlink is down 17% since March 26, with current price action showing continued uncertainty. LINK is consolidating just above a key demand level, and although bulls have struggled to regain momentum, some analysts believe the worst may be behind. Fears of ongoing selling pressure persist, but overall market conditions suggest that the sharpest drawdowns could be over. Supporting this view, Ali Martinez shared on-chain data revealing that the most critical demand wall for Chainlink sits at $6.26, where nearly 90,000 investors accumulated approximately 376 million LINK tokens. This strong accumulation zone may provide the foundation needed for price stabilization and a potential reversal, especially if broader market sentiment begins to recover. While analysts still warn of a possible deeper correction, the fading intensity of selling and the presence of strong support indicate growing resilience. Chainlinks long-term fundamentals, particularly its leadership in the RWA space, continue to attract attention even during times of market stress. If the $6.26 level holds, LINK could be well-positioned for a rebound once bullish momentum returns across the crypto landscape. Related Reading: Bitcoin Rejected At Descending Resistance Again Is $78,600 Still In Play? LINK Holds Solid Ground As Bulls Eye Recovery Confirmation Chainlink (LINK) is trading at $12.8 after enduring several days of heavy selling pressure. Despite the recent downside, bulls have managed to defend the crucial $12.3 support level, which has so far acted as a solid demand zone. This hold is a key short-term victory, but the broader trend remains fragile as LINK struggles to regain upward momentum. To confirm a potential recovery rally, bulls must push LINK above the $14.6 level a critical resistance zone that aligns with both the 4-hour 200-day moving average (MA) and the exponential moving average (EMA). A decisive breakout above this area would signal renewed strength and potentially attract more buyers back into the market. Related Reading: SUI Forms Inverse Head And Shoulders Can Bulls Break Above $2.52? However, the risk of further downside still looms. If LINK loses its grip on the $12.3 demand zone, the next logical support could lie near the $10 mark, a psychological level that hasnt been tested since early Q4 2023. With the broader crypto market still under pressure and sentiment cautious, LINK remains at a crossroads. The coming days will be pivotal as bulls attempt to reclaim momentum and avoid slipping deeper into correction territory. Featured image from Dall-E, chart from TradingView

Chainlink Whales Dump Over 170 Million LINK In Three Weeks  Selling Pressure Ahead?

Author: Sebastian Villafuerte
United Kingdom
Apr 05, 2025 12:05

Chainlink Whales Dump Over 170 Million LINK In Three Weeks Selling Pressure Ahead?

Chainlink is trading at crucial demand levels as the entire crypto market faces heightened selling pressure and uncertainty. After weeks of volatility and downside moves, bulls continue to struggle to regain control, with LINK failing to break above key resistance levels. Still, there are early signs that the worst may be behind. Price action is beginning to stabilize, and some traders believe the current consolidation could lay the groundwork for a recovery phase. Related Reading: Bitcoin Rejected At Descending Resistance Again Is $78,600 Still In Play? However, not all signals are bullish. According to on-chain data from Santiment, whales have sold over 170 million LINK in the last three weeks. This significant outflow from large holders has fueled speculation that additional downside could still exist. Whale behavior is often a leading indicator of broader market sentiment, and continued selling from top wallets may reflect a lack of confidence in the short-term price outlook. While selling pressure appears to be fading for now, the market remains cautious. For Chainlink to break free from this uncertain range, bulls will need to defend current support and reclaim key levels. Until then, whale activity and broader market sentiment will continue to play a major role in determining LINKs next move. Chainlink Consolidates At Key Support As Whale Selling Clouds Outlook Chainlink is down 17% since March 26, and its price action remains uncertain as it consolidates above a critical demand zone. While the broader crypto market continues to struggle with volatility and macro-driven selling pressure, LINK has been particularly vulnerable. Analysts are increasingly voicing concerns about a potential deeper correction, citing weak momentum and ongoing bearish sentiment across risk assets. The fear of extended downside remains high, with many traders hesitant to step back in until clearer bullish signals emerge. The entire crypto landscape has been affected by economic instability and market indecision, and Chainlink is no exception. Still, some believe LINK has room to recover. The project continues to expand its role in the decentralized finance (DeFi) space, with steady development and increasing adoption of its oracle infrastructure. These long-term fundamentals offer hope that once the current market pressure fades, Chainlink could be among the first altcoins to rebound. Adding to the uncertainty, however, are troubling whale activity metrics. Crypto analyst Ali Martinez recently shared on X that whales have sold over 170 million LINK in the past three weeks. This heavy distribution supports the prevailing bearish trend and suggests that major holders are not yet confident in an imminent recovery. For now, all eyes remain on whether LINK can hold its current support zone. A break below could open the door to further losses, while a bounce and reclaim of higher resistance levels may finally mark the beginning of a recovery phase. Until then, market participants are treading carefully as Chainlink balances between bearish pressure and the potential for a turnaround. Related Reading: SUI Forms Inverse Head And Shoulders Can Bulls Break Above $2.52? LINK Struggles As Bulls Fight to Avoid Further Losses Chainlink (LINK) is trading at $13.1 after failing to reclaim the $15 level, reflecting continued weakness following weeks of selling pressure. The rejection from $15 has left bulls in a defensive position, with price action hovering just above a key demand zone. To regain control and confirm the start of a recovery rally, LINK must not only hold above current levels but also break decisively above the 200-day moving average (MA) and exponential moving average (EMA), both sitting around $17.2. These moving averages represent critical resistance, and only a clean breakout above them would signal a shift in momentum. Until then, LINK remains vulnerable to further downside, especially if market conditions stay fragile. If bulls fail to defend the $13 zone, a drop toward $10 becomes a likely scenario a level that hasnt been tested since late 2023. Related Reading: Whales Dump 760,000 Ethereum in Two Weeks Is More Selling Ahead? With broader market uncertainty and fading momentum across altcoins, LINK holders are watching closely. A failure to hold current support could trigger stronger selling pressure, while a successful push above $17.2 could pave the way for a stronger rebound. The coming days may be pivotal in determining whether Chainlink stabilizes or continues its downtrend. Featured image from Dall-E, chart from TradingView
Chainlink Consolidates In Triangle Pattern  Is A 35% Breakout Imminent?

Author: Sebastian Villafuerte
United Kingdom
Apr 03, 2025 12:10

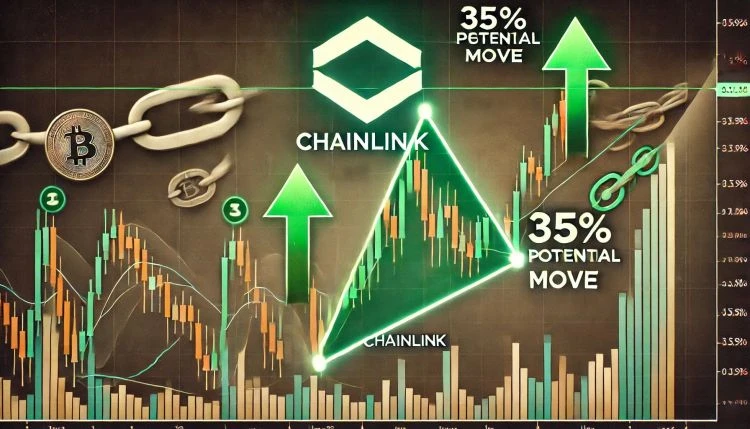
Chainlink Consolidates In Triangle Pattern Is A 35% Breakout Imminent?

Chainlink is currently trading at a crucial demand zone after enduring heavy selling pressure throughout Q1 of this year. Like many altcoins, LINK has struggled to recover in the face of broader macroeconomic instability and a hostile market environment fueled by U.S. President Donald Trump’s unpredictable policy decisions. Tariffs, trade tensions, and volatile global sentiment have created significant headwinds for high-risk assets, and Chainlink has been no exception. Related Reading: XRP MVRV Ratio Dips Below The 200-Day MA Trend Shift Underway? Despite the recent weakness, some analysts believe a turnaround may be near but only if LINK can hold its current support levels. A strong defense here could lay the foundation for a meaningful recovery rally in the weeks ahead. Top analyst Ali Martinez shared new insights on X, highlighting a potentially bullish setup forming on Chainlinks chart. According to Martinez, LINK is currently consolidating within a triangle pattern, which often precedes major moves. He notes that this structure could be setting up for a significant price move, with a breakout potentially imminent. As LINK coils tighter within this pattern, traders are watching closely. A confirmed breakout from this zone could spark a strong directional move and possibly mark the beginning of Chainlinks next major trend. Chainlink Struggles Below Key Levels as Triangle Pattern Signals Imminent Move Chainlink is currently trading below critical resistance levels after losing nearly 30% of its value since late February. The sharp drop has left bulls in a defensive position, struggling to hold prices steady and spark a meaningful recovery. The $13 mark now stands as a crucial support level a zone that must hold to preserve market structure and investor confidence. A decisive defense of this area could provide the foundation needed for a recovery rally. While selling pressure has dominated in recent weeks, bears have so far failed to break LINK below its current demand zone. This has led to cautious optimism among traders, who see a potential reversal if buyers can defend key levels and reclaim momentum. If LINK maintains support above $13 and gains strength, a push toward higher liquidity zones could quickly follow. However, risks remain. US President Donald Trump’s unpredictable economic policies, especially on tariffs and trade, continue to shake financial markets and drive uncertainty. Crypto, as a high-risk asset class, remains particularly vulnerable to this kind of volatility. Martinez’s technical analysis noted that Chainlink is consolidating within a triangle pattern a structure that often precedes significant price movements. According to Martinez, this setup could result in a 35% breakout, with $16 identified as the level to watch closely for confirmation. If bulls can reclaim that level, a powerful move higher may follow. For now, all eyes are on the $13 support and the triangles upper boundary as Chainlink coils tighter and prepares for its next major move. A breakout in either direction appears imminent. Related Reading: Whales Offload 200M Cardano During March The Start Of A Trend? Bulls Hold Support But Battle Key Resistance Chainlink (LINK) is trading at $13.5 after several days of consistent selling pressure, struggling to gain momentum below the critical $16 mark. The current level now acts as a short-term support zone, and bulls must defend it to avoid further downside. A successful hold above this price could offer a foundation for recovery, but the path forward remains challenging. To shift sentiment and reignite bullish momentum, LINK must reclaim the $17.20 level an area that aligns closely with both the 200-day moving average (MA) and the 200-day exponential moving average (EMA). These indicators have historically marked key trend reversals, and a clean breakout above them would signal strength returning to the market. If bulls manage to push LINK above the $18 mark, a strong rally could follow, possibly retesting higher resistance levels and restoring confidence in the broader trend. However, if LINK fails to reclaim these levels in the near term, it risks slipping into a consolidation phase or even experiencing a deeper correction. Related Reading: Dogecoin Holds Key Support: A Demand Spike Could Trigger A Rally A breakdown below $12.5 would likely trigger further losses and shift the short-term outlook more bearish. For now, LINK remains in a fragile state, and the next move will depend on the bulls ability to reclaim momentum. Featured image from Dall-E, chart from TradingView

Apr 20, 2025 12:05

Chainlink Price Continues To Hover Around $12.5 Levels To Watch

The Chainlink price has not seen a lot of action in recent weeks, oscillating between the $12 and $13 levels since the start of April. This inactivity suggests that the altcoin is yet to recover from its uninspiring run in the first quarter of 2025. With the way the LINK price is currently set up, the altcoin does not seem likely to witness a lot of action in the short term. However, a prominent crypto analyst on X has identified important levels that could be pivotal in the future trajectory of the Chainlink price. Where Is LINKs Next Major Resistance? Popular crypto analyst Ali Martinez took to the X platform to offer on-chain insights into the current setup of the Chainlink price. While the LINK price continues to move within the $12 – $13 consolidation range at the moment, certain on-chain levels could be critical to its long-term journey. Related Reading: Solana Price Enters Consolidation Trend Above $130 That Could End In A Breakout This analysis is based on the average cost basis of several Chainlink investors. For context, cost-basis analysis evaluates the capacity of a level to serve as support or resistance, depending on the total amount of coins last acquired by investors at that price level.  As observed in the chart above, the size of the circle represents the amount of LINK tokens purchased within each price region and its corresponding strength. The bigger the dot, the higher the number of tokens, and the stronger the support or resistance; the green dots refer to support as they are beneath the current price, while the red dots refer to resistance as they are above the current price. Data from IntoTheBlock shows that the Chainlink price has key support around the $12.28 $12.62 region, where 11,130 addresses purchased 26.55 million LINK tokens (worth $331.07 million at an average price of $12.47). This region would act as an on-chain support, as investors with their cost basis around the level would likely defend their positions by buying more tokens, thereby cushioning the LINK price. Martinez added that the altcoin faces major resistance around the $14.19 $14.58 zone, where 20,930 investors acquired 21.19 million LINK tokens (worth $304.5 million at an average price of $14.37). Investors who bought tokens around this level are likely to sell if the Chainlink price returns around their cost basis, which would dampen the tokens bullish momentum and probably halt its upward movement. As mentioned earlier, these support and resistance levels could be pivotal to LINKs trajectory over the next few weeks. Specifically, losing the $12.28 support could see LINK fall below $11, as there is no significant cushion beneath it. Chainlink Price At A Glance As of this writing, the price of LINK stands at around $12.58, reflecting a mere 1% jump in the past 24 hours. Related Reading: BONK Symmetrical Triangle Squeeze: Is A Mega Breakout Imminent? Featured image from Waratah Fencing, chart from TradingView

Apr 15, 2025 12:05

Chainlink Just Retested Key Support Heres Where Price Could Be Headed Next

Chainlink (LINK) is showing renewed promise after a fresh retest of a crucial support level, hinting that the bulls may be gearing up for the next phase of its upward move. The recent bounce off this key support area, previously acting as a barrier, reinforces the idea that the level has now become a strong foundation.  This move reinforces the strength of the support and builds the case for a potential upside run. As LINK stabilizes above this key level, eyes are now on the next resistance zones that could define the near-term direction. With momentum gradually rebuilding, the stage might be set for a breakout that could catch the broader market’s attention. Chainlink Holds Strong: Breaking Down The Critical Support Retest According to Jimmy X in a recent post on X, Chainlink has broken out of a falling wedge pattern on the daily chart, a formation often considered a bullish reversal signal. This technical development is catching attention as it hints at a possible shift in momentum after a period of downward consolidation. Related Reading: Chainlink (LINK) Targets Rebound To $19 But Only If This Key Support Holds Jimmy noted that LINK is currently testing the upper trendline resistance of the wedge, with trading volume steadily increasing, a strong sign that buyers are stepping in with conviction. Rising volume alongside a breakout typically reinforces the validity of the move, suggesting that this isnt just a short-lived spike but possibly the beginning of a more sustained upward trend.  He further emphasizes that a confirmed breakout followed by a successful retest of the previous resistance as support could trigger a parabolic move for Chainlink. This bullish setup, often seen as a launchpad for accelerated rallies, places LINK on track to target multiple upside levels.  Key resistance points include $15.40 and $17.50, which have historically served as barriers during past price surges. Beyond these are the $20.00, $23.80, and $26.50 price levels. With technical indicators aligning and sentiment shifting, a sustained move above the breakout zone may set the stage for an extended rally. Downside Potentials While Chainlinks recent retest of support shows bullish promise, it’s crucial to acknowledge the downside risks in case momentum weakens. If the price fails to maintain its current structure, the first level of support lies around $12.50. This level has previously served as a strong demand area, and a breakdown below it might signal the start of a deeper correction. Related Reading: Support Or Resistance? Chainlink (LINK) Investor Data Suggests Key Price Zones Further down, the $11.10 level becomes the next critical point. This area marks a prior consolidation zone and aligns with the lower trendline of the broader ascending channel, making it a vital structure for bulls to defend. A breach below this could open the door for a retest of the psychological $9.28 level, where the market may once again attempt to establish a firm base. Featured image from YouTube, chart from Tradingview.com

Your Crypto Gateway

Claim 1,000
Free WCG Coins

World Crypto Global opens the door to digital freedom for everyone.
Manage your free WCG Coins securely—where simplicity meets global accessibility.

11 bn

FREE CRYPTO COINS

8.9 bn

AVAILABLE FOR RESERVATION

2.1 bn+

ALREADY ALLOCATED

× WCG Coin

🎉 Get 1,000 WCG Coins

No fees. No catch. Your crypto journey starts here.