Hashrate recovery reduces Bitcoin miners selling pressure in July
Miner revenues soar 50%, pushing Bitcoin hashrate higher and reducing selling pressure from miners reserves.
Loading
Welcome at World Crypto Global. This portal is packed with useful content and resources to built out your own crypto skills. WorldCrypto is a site member of Gabriel Vega Network.

Miner revenues soar 50%, pushing Bitcoin hashrate higher and reducing selling pressure from miners reserves.
Another wave of Bitcoin could be flooding the market as Mt. Gox prepares to continue creditor repayments. Will 99% of the Mt. Gox creditors really sell their Bitcoin?
Recently, the price of Bitcoin (BTC) has entered a consolidation phase, fluctuating between $61,000 and $62,000 after a brief drop to $58,000 on June 24. While retail investors have shown renewed interest alongside institutional counterparts, the market faces a mix of bullish signs and potential headwinds. Retail Investors Return To Bitcoin In a recent social media post, crypto analyst Ali Martinez highlights the resurgence of retail investors, as evidenced by a four-month high in new BTC addresses reaching 432,026, adding to the sentiment that investors are betting on a significant price increase for BTC in the coming months, despite recent price volatility. Related Reading: Ethereum Suffers 3rd Straight Weekly Outflows, Becomes 2024s Worst Performer In a separate post analyzing BTC’s recent price action, Martinez also suggested that the largest cryptocurrency on the market is currently confined within a parallel channel, with a potential rebound to $63,200 or $63,800 if the lower bound at $62,500 holds. In particular, Martinez cites the critical resistance areas of $65,795 and $78,700 as key targets if BTC breaks above them. However, not all news is positive for the Bitcoin market. In the past 72 hours, BTC miners have sold over 2,300 BTC worth approximately $145 million. This selling pressure adds to the US and German governments’ ongoing sell-off of confiscated BTC. Mining Industry Under Pressure The mining industry faces challenges due to lower network fees and reduced block rewards resulting from the Halving event in April. Kaiko Research notes that average network fees have decreased from $3 to $5, a significant drop from around $45 in January. The halving saw block rewards reduce from 6.25 BTC to 3.125 BTC, impacting miner revenue. This revenue squeeze has put pressure on miners, eroding profitability while fixed expenses such as energy, wages, and rent remain constant. The decline in network fees has further contributed to the reduction in revenue. Historically, Bitcoin price rallies following Halving events have helped miners compensate for the drop in rewards. However, the price of Bitcoin has remained relatively unchanged since the April 19 software update. Related Reading: 36% Explosion! ENS Coin Steals The Spotlight In The Crypto Market In April, fees briefly surged to nearly $150 due to the increased minting of non-fungible tokens (NFTs) on the BTC blockchain. Although this temporarily relieved miners, fees have since returned to average levels. According to Bloomberg, Marathon Digital, one of the largest Bitcoin miners, sold 390 BTC in May and plans to sell more tokens to manage its finances. Kaiko Research warns that the risk of forced selling by miners may persist in the coming months. As a result, the industry is expected to witness consolidation as miners seek to “consolidate assets” and “increase efficiency.” Notable examples include miner Riot Blockchain’s hostile takeover attempt of Bitfarms Ltd. and CleanSpark Inc.’s recent agreement to acquire Griid Infrastructure Inc. for $155 million in an all-stock transaction. At the time of writing, BTC is still consolidating within its range at $61,880, down 2% in the 24-hour time frame, wiping out all gains in the past 30 days, as losses in this time frame amount to 9%. Featured image from DALL-E, chart from TradingView.com
The crypto market could bounce back this month after a rocky June, with stablecoin outflow from exchanges showing slowing selling pressure.
Repeated Bitcoin transfers to centralized exchanges suggest the government plans to sell its $2.75 billion in BTC holdings.
Using five different crypto exchanges suggests that the wallet sought to maximize liquidity on each order book and sell Bitcoin as soon as possible.
On-chain data shows that Bitcoin long-term holders have potentially been selling recently, something that may explain BTC’s continued bearish momentum. Bitcoin Exchange Inflow CDD Has Registered Huge Spikes Recently As an analyst in a CryptoQuant Quicktake post explained, old cryptocurrency tokens have recently been deposited in large quantities in centralized exchanges. The on-chain metric of interest here is the “Exchange Inflow Coin Days Destroyed (CDD).” A “coin day” refers to a quantity that 1 BTC accumulates after staying dormant on the blockchain for 1 day. Related Reading: Bitcoin Crash Forced Weak Hands Into Largest Loss-Taking Since 2022 Lows: Report When a coin that had been sitting still inside a wallet is finally moved, its coin days counter naturally resets back to zero, and the coin days it had been carrying before the move are said to be “destroyed.” The CDD keeps track of the total amount of coin days being reset in this manner across the network. In the context of the current topic, though, the general CDD isn’t the one of focus, but rather the Exchange Inflow CDD, which only keeps track of the coin days being destroyed through transactions into wallets connected to exchanges. Now, here is a chart that shows the trend in the Bitcoin Exchange Inflow CDD over the past month or so: As is visible in the above graph, the Bitcoin Exchange Inflow CDD has registered some spikes of considerable scale this month. This would imply that many dormant coins have recently seen deposits into exchanges. Generally, spikes in the CDD correlate to movement from the long-term holders (LTHs), as these HODLers tend to accumulate large amounts of coin days. Therefore, the recent spikes in the Exchange Inflow CDD suggest that these diamond hands have been transferred to exchanges. Holders make transactions into exchanges when they want to use one of the services these platforms provide, which can include selling. The chart shows that the spikes earlier in the month had come when Bitcoin had plunged towards its lows, implying that the selling pressure from this cohort may have played a role in the crash. The latest spike, larger in scale than the others, has come while BTC has been trying to start a recovery rally from these recent lows. So far, BTC has had no luck, suggesting that the selling from the LTHs has potentially been holding the coin back. Related Reading: Chainlink Traders Capitulate After 10% Plunge: Bottom Here? It remains to be seen how the Exchange Inflow CDD behaves in the coming days and if any potential further spikes would impede Bitcoin in its path to recovery. BTC Price At the time of writing, Bitcoin is trading at around $57,900, up more than 4% over the past week. Featured image from Dall-E, CryptoQuant.com, chart from TradingView.com
In an analysis provided by CryptoQuant, a significant change in Bitcoin miner behavior has been noted, potentially indicating a turning point. CryptoQuant analyst, known as Crypto Dan, outlined a reduction in miners’ selling pressure, which has historically been a pivotal factor affecting Bitcoin’s price trajectory. Bitcoin Mining Selling Pressure Decreases According to Crypto Dan, “Miners’ selling pressure decreases. One of the whales that have caused the cryptocurrency market to fall recently have been miners.” He explained that the BTC halving, which halved mining rewards, led to a decrease in the use of older, less efficient mining rigs, subsequently reducing overall mining activity. This change forced miners to sell Bitcoin in over-the-counter (OTC) transactions to sustain their operations. The analysis suggests that the market is currently absorbing the sell-off, with a notable decline in the volume and frequency of Bitcoin being transferred out of miners’ wallets. “The current market can be seen as being in the process of digesting this sell-off, and fortunately, the quantity and number of Bitcoins miners are sending out of their wallets has been rapidly decreasing recently,” Crypto Dan stated. Related Reading: BlackRock Global Allocation Fund Reveals Major Bitcoin ETF Stake With 43,000 Shares The implications of this shift are significant. Crypto Dan added, “In other words, the selling pressure of miners is weakening, and if all of their selling volume is absorbed, a situation may be created where the upward rally can continue again.” He projected optimism for the market, predicting positive movements in the third quarter of 2024. Historical data from CryptoQuant corroborates the analysis. BTC has previously shown a similar pattern where miner selling activity exerted a strong influence on market prices, particularly noted from May to September 2023 and from December 2023 to January 2024. During these periods, prolonged sideways movement in BTC prices was observed, aligning with peaks in miner selling. Notably, when these selling activities diminished, Bitcoin prices resumed an upward trend. This pattern suggests that the recent decrease in miner selling could be the precursor to another significant bullish phase for Bitcoin, as market conditions appear ripe for a similar reversal of fortunes. Key Price Level For A Bullish Breakout Further insights from technical analysts at alpha dj provide a granular view of the market conditions. Their daily update on Bitcoin through X underscores the current market indecision, characterized by Bitcoin “chopping around” without clear directional movement. However, the analysts have identified critical price levels which could indicate future market movements: “If BTC reclaims the $63.5k area, it would be bullish; if it loses the $60k level, it would be bearish.” Related Reading: Fears Of Bitcoin Sales By US And German Govts Are FUD, Even Bullish: Experts The technical analysis also reveals that the liquidity in the Bitcoin market is currently dispersed, with few substantial clusters of orders. The most notable concentration of orders is around the $63.5k level, suggesting that this price point is pivotal for market sentiment and potential bullish momentum. The order book data provided by alpha dj highlights a current dominance of sell orders, indicating a bearish sentiment among traders. Conversely, the bid side is described as weak, with fewer buy orders supporting upward price movements. This imbalance suggests that the market is currently cautious, potentially awaiting more definitive signals before committing to more substantial positions. At press time, BTC traded at $61,704. Featured image created with DALL·E, chart from TradingView.com
Keshav is currently a senior writer at NewsBTC and has been attached to the website since June 14, 2021. Keshav has been writing for many years, first as a hobbyist and later as a freelancer. He has experience working in a variety of niches, even fiction at one point, but the cryptocurrency industry has been [...]
The post This Historical Ethereum Top Signal Is Yet To Appear This Cycle appeared first on Crypto Breaking News.
The largest Friend.tech whale has sold all their holdings, causing the new token to fall over 50% in value while other users can still not claim the airdrop.
Bitcoin outflows from the Mt. Gox exchange have occurred in the past day, making some worry about potential bearish effects. Heres what an analyst thinks. Mt. Gox Has Made Several Bitcoin Transactions In The Last 24 Hours During the past day, several movements from wallets associated with the bankrupt cryptocurrency exchange Mt. Gox have been [...]
The post Is Mt. Gox A Worry For Bitcoin? Crypto Analyst Weighs In appeared first on Crypto Breaking News.
On-chain data suggests the Ethereum whales have shown a burst of activity recently. Heres what these titans have been up to. Ethereum Whale Transactions Are At Their Highest Since March In a new post on X, the market intelligence platform IntoTheBlock has discussed how the ETH whales have become active recently. The on-chain metric of [...]
The post Ethereum Whales Come Alive: Are They Buying Or Selling? appeared first on Crypto Breaking News.
The Bitcoin price recovery above the $67,000 level has triggered a round of selling, but it is not from the usual camp of large investors selling. This time around, it is the small-time traders who are offloading their bags and putting selling pressure on the price. However, this is not an entirely bad thing given that, historically, such selling has been bullish for the Bitcoin price. Bitcoin Retail Are Dumping Their Bags In a report on X (formerly Twitter), the on-chain data tracker Santiment revealed an interesting trend among small-time Bitcoin investors. As the price of Bitcoin rallied past $67,000 over the weekend, these small wallets took this as the time to sell and secure profit. Related Reading: Cardano Whales Return To The Table, Increase Massive Holdings By 10% These wallets are those holding below 0.1 BTC on their balances. This means that at the high end, these wallets are holding an average of $6,000. In the space of one week, Santiment notes that their collective holdings had dropped 0.46%. #Bitcoin is dancing just above $66.1K as small traders continue to #liquidate their holdings despite the #crypto bounce over the past week. Historically, small wallets dumping their coins to larger wallets is an encouraging and #bullish sign for $BTC. https://t.co/wlz4XPhfMD pic.twitter.com/dTJAy5G6pL Santiment (@santimentfeed) May 19, 2024 Selling among smaller wallets is not new, but at this level, it could have a significant impact on the price. However, compared to when whale and sharks sell their BTC holdings, retail investors selling is usually bullish for the price. This is because as the smaller traders sell, the BTC is picked up by the larger traders, who are usually longer-term holdings. As blockchain agency Crynet explains in a response to Santiment: While small traders divesting might seem concerning, it’s often a bullish signal. Historically, this redistribution to larger holders indicates stronger hands in the market. Let’s see how this plays out. Bullish Sentiment Rises Among Investors The selling by small Bitcoin traders comes amid a jump in bullishness. As Santiment reported in a previous post, bullishness among Bitcoin investors has now jumped to a 4-month high. The last time that investors were this bullish was back in January 2024 when the price of BTC had jumped above $45,000. Related Reading: Crypto Analysts Reveal Sub-$1 Altcoins Set To Outperform In The Bull Run Bitcoins weighted sentiment is now sitting at a value of 0.99, and although this is still lower than its January high of almost 1.8, it remains one of the highest among large caps. Currently, only the Chainlink (LINK) weighted sentiment is higher after rising to a new one-year high of 1.829. The crowd’s sentiment has shifted toward #Bitcoin after the surprise bounce above $66K Wednesday (and now above $67.2K). Additionally, #Chainlink is seeing its most #bullish sentiment in over a year. #FOMO staying low will help these rises continue. https://t.co/TcEPBdS9Oh pic.twitter.com/czvE1mOgId Santiment (@santimentfeed) May 17, 2024 The Ethereum weighted sentiment is currently sitting at a low -0.44, while XRP and Binances BNB are sitting at around -0.37. This suggests that bearishness continues to dominate among these assets while crypto investors look to Bitcoin to lead the market. At the time of writing, the BTC price is still trading at a high price of $66,900. The largest cryptocurrency by market cap is seeing a 6.78% increase in the last week and a small decline of 0.5% in the last day, according to data from Coinmarketcap. Featured image created using Dall.E, chart from Tradingview.com
Despite the excitement around the Hong Kong ETF debut, the inflows are only a fraction of the outflows from U.S. ETFs. Could the Bitcoin price revisit the $50,000 mark next?
Traders disinterest in Bitcoin shorting during this bull cycle improves market stability, allowing people to anticipate smoother price
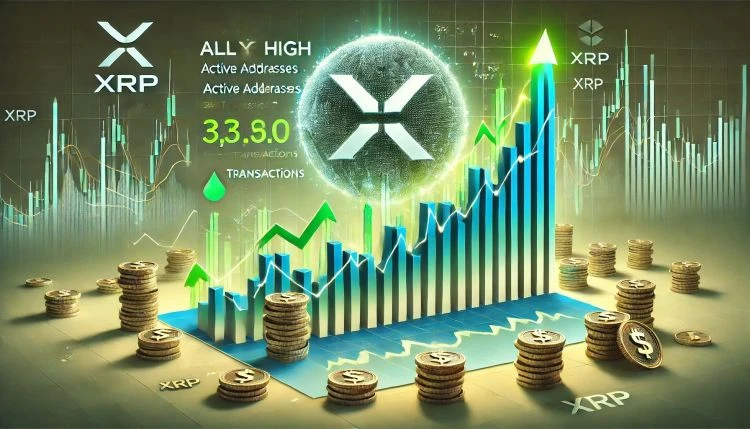
XRP has broken down from critical support levels, joining the broader crypto market in a wave of selling pressure driven by growing macroeconomic uncertainty. As risk sentiment weakens, bulls are struggling to defend key zones that previously held firm. Now, the focus shifts to reclaiming a pivotal level that could reverse the recent bearish trend and restore some confidence to investors. Related Reading: XRP Breaks Out Of Head-And-Shoulders Pattern Eyes Move Toward $1.30 Despite the harsh market conditions and price volatility, on-chain data reveals a promising development beneath the surface. According to Glassnode, the XRP network has reached a new all-time high of 6.26 million addresses holding 1 XRP or more. This metric signals growing adoption and distribution, even as prices slide a potential bullish divergence that often precedes long-term strength. The surge in small wallet growth suggests that retail investors are still entering the market, seeing value in XRP at current levels. While the short-term price action remains uncertain, the expanding network base may point to renewed demand once market conditions stabilize. Is this trend a sign of strength or simply a temporary reaction to lower prices? In a market full of fear, such network milestones could serve as a glimmer of optimism for XRPs long-term outlook. XRP Holds Below $2 As Analysts Split on What Comes Next XRP is now facing a critical test just below the $1.80 mark a level that many analysts view as the last key support before a potential steep decline. Market sentiment remains fragile, with bulls under immense pressure and bears steadily gaining ground. If XRP fails to hold this zone, some analysts warn that a sharp drop toward lower demand levels could follow, further weakening investor confidence. The atmosphere is tense and filled with uncertainty. Bulls argue that once broader market conditions begin to recover, XRP could be one of the first altcoins to rebound and reclaim its previous range highs. On the other hand, skeptics believe that XRPs trend has clearly broken down, and a return to bullish momentum could take longer than many anticipate if it happens at all. Despite the conflicting views on price action, on-chain data offers a glimmer of optimism. Top analyst Ali Martinez shared insights on X, revealing that the XRP network is quietly growing stronger. According to Glassnode, the number of wallets holding at least 1 XRP has reached an all-time high of 6.26 million. This surge in network participation could be a signal of long-term strength and resilience. If the broader market stabilizes, such steady growth in network fundamentals may give XRP the momentum it needs to mount a serious recovery. But for now, the $1.80 level remains the line in the sand and all eyes are on whether it holds or breaks. Related Reading: Oversold Altcoins Like Solana Flash Bullish Divergences Are Relief Bounces Coming? Price Struggles Below Key Averages as Selling Pressure Mounts XRP is currently trading at $1.82 after a sharp drop below the 200-day Exponential Moving Average (EMA) at $1.94 and the 200-day Simple Moving Average (MA) at $1.85. These technical levels were acting as key support during recent consolidation, but bulls failed to defend them, signaling growing weakness in the current trend. The breakdown began when XRP lost the $2 mark a psychological and technical level that had previously provided stability. Since then, bearish momentum has intensified, and buyers have struggled to regain control. With XRP now firmly below major moving averages, the risk of continued downside remains high. However, all is not lost. A decisive reclaim of the $1.95 level, ideally with strong volume and follow-through, could spark a recovery back above the $2 threshold. Such a move would likely restore short-term bullish sentiment and provide the foundation for a broader rebound. Related Reading: Ethereum Capitulation May Be Nearing End Will A Fed Pivot Spark A Recovery? On the flip side, losing the $1.80 support would be a major blow for bulls. If this level fails to hold, XRP could rapidly descend toward the $1.50 zone, where the next meaningful support lies. For now, traders are watching these levels closely as XRP battles to regain stability amid broader market turbulence. Featured image from Dall-E, chart from TradingView
XRP is trading at critical levels after dropping below the $2 mark on Sunday, following a wave of panic selling across the crypto market. The move came as global financial markets reacted sharply to aggressive new U.S. tariffs, escalating trade tensions and sending risk assets tumbling. XRP, like many altcoins, has been hit hard by the volatility, with sentiment turning increasingly bearish. Related Reading: Solana Drops Below $100 For First Time In A Year Is An 80% Correction Underway? Adding to the concern, top analyst Ali Martinez shared technical insights that point to further downside. According to Martinez, XRP is currently breaking out of a head-and-shoulders pattern a classic bearish setup that often signals the beginning of a larger correction once the neckline is broken. If the pattern plays out, XRP could be heading toward the $1.30 level, a key zone of historical demand and potential support. With market conditions already fragile and uncertainty growing, this pattern reinforces the bearish outlook for XRP in the short term. Unless bulls can reclaim $2 and invalidate the breakdown, XRP may continue to bleed alongside the broader market. All eyes are now on how price behaves in the coming sessions, as traders assess the strength of this technical signal. XRP Faces Bearish Outlook As Head-and-Shoulders Pattern Confirms Breakdown XRP has now lost over 50% of its value since reaching its recent all-time high, and the market is showing no clear signs of stability. As fear spreads across both traditional and crypto markets, XRP remains under heavy pressure, with volatility intensifying in recent sessions. The broader landscape clouds with macroeconomic tension, particularly US tariffs that have triggered global trade concerns and sent risk assets into a tailspin. The sentiment surrounding XRP is deeply divided. While some investors still believe that a broader market recovery could help XRP reclaim range highs, others remain skeptical. For now, price action supports the latter. Bulls have failed to defend the $2 mark a critical psychological and technical level and XRP has continued to trend lower. Martinez added to the bearish narrative, sharing a technical breakdown on X that shows XRP is currently breaking out of a head-and-shoulders pattern. This formation is widely regarded as a bearish reversal signal, and Martinez suggests that the confirmed breakdown could send XRP tumbling toward the $1.30 level. That target aligns with historical demand and previous support zones, making it a likely destination if current momentum continues. Unless bulls reclaim $2 quickly and invalidate the pattern, XRP may struggle to recover in the near term. With the broader market still unstable and high-risk assets under pressure, the bearish outlook for XRP appears to be gaining traction. The coming days will be critical as traders watch whether XRP stabilizes or slips further into its current downtrend. Related Reading: Ethereum Capitulation May Be Nearing End Will A Fed Pivot Spark A Recovery? Bulls Struggle At $1.86 And Fight To Avoid Deeper Correction XRP is trading at $1.86 after several days of struggling to reclaim higher levels, with selling pressure dominating price action. Bulls lost momentum once the price broke below the key $2 support, which had previously served as a psychological and technical floor. Since then, XRP has continued to slide, failing to generate enough buying volume to spark a meaningful recovery. The current level around $1.86 is now acting as a short-term support zone, but it remains vulnerable. If XRP doesn’t hold above this area, sellers will likely push it toward the $1.50 region. This level marks a significant demand zone from previous market cycles and could act as the next stop in the event of continued bearish pressure. Related Reading: Ethereum Lags Behind Bitcoin In Q1 Performance Amid Market Downturn Details On the flip side, if bulls can manage a swift rebound and push the price back above $2, it may trigger a short-term relief rally. Reclaiming that level would invalidate some of the recent bearish momentum and potentially set the stage for XRP to target higher resistance around $2.20 and beyond. For now, XRP remains caught in a delicate spot and what happens next will depend largely on whether buyers step in to defend the current support zone. Featured image from Dall-E, chart from TradingView
Solana is now trading below the $100 mark after intense selling pressure swept through the crypto market over the weekend. Sundays drop pushed SOL into its lowest price zone in more than a year, signaling a sharp shift in sentiment as fear grips the market. Since the start of March, Solana has lost more than 45% of its value, and momentum suggests the downtrend may not be over yet. Related Reading: Dogecoin Faces Make-Or-Break Support Level Will DOGE Hold? The breakdown has sparked concern among investors and analysts alike, with many warning that SOL could be headed for deeper lows if current support fails to hold. Top analyst Jason Pizzino shared a technical analysis pointing out that this is the first time in over 12 months that Solana is trading below the $100 level a historically significant threshold. According to Pizzino, the next major price targets sit at levels levels that would represent an 80% total decline from Solanas recent highs. Such moves, while steep, arent uncommon during heavy altcoin corrections. With macro uncertainty and broad market weakness driving risk-off behavior, Solanas path forward will likely depend on whether bulls can reclaim key levels or if more downside is still to come. Solana Faces Critical Breakdown As Analysts Eye Deeper Correction Solana is now undergoing a crucial test as the price trades below $100 for the first time in over a year. Bulls are under pressure to reclaim key levels quickly in order to prevent further downside. However, the broader macroeconomic landscape paints a grim picture. Global markets remain rattled by escalating trade war tensions and policy uncertainty stemming from the U.S. and China, with financial conditions tightening across the board. For high-risk assets like Solana, the backdrop suggests the decline may still have room to continue. Pizzino has shared a bearish technical outlook that supports this view. He highlights the significance of Solanas repeated bearish signals using the 3-bar rule. The first warning appeared in November 2024, followed by another in January 2025. Now, with SOL firmly trading below $100, Pizzino believes the next targets lie at $80 and potentially sub-$60 a level that would represent an 80% correction from Solanas recent highs. While that may seem extreme, such pullbacks are not unusual in major altcoin cycles, particularly when driven by broader market panic. Related Reading: Ethereum Lags Behind Bitcoin In Q1 Performance Amid Market Downturn Details For Solana, the path forward hinges on whether bulls can reclaim momentum soon. A push back above the $110$120 zone could shift sentiment and delay deeper losses. Until then, the market remains on edge. Solana Bulls Fight to Avoid Further Losses Solana is currently trading at $100 after briefly dipping to $95 a price level not seen since February 2024. The sharp correction highlights the intense selling pressure that has taken hold of the market in recent weeks. As fear and uncertainty continue to dominate sentiment, SOL remains vulnerable to deeper losses if bulls fail to step in. The $100 level is now a psychological and technical battleground. While bulls are attempting to defend it, the broader market context shaped by global macroeconomic instability and weakening investor confidence suggests the recovery may face significant resistance. For Solana to regain momentum and signal a possible trend reversal, it must reclaim the $120 zone, which previously served as a key support level. Related Reading: Massive Chainlink Demand Wall At $6.26 As 90K Investors Buy 376M LINK However, selling pressure remains strong, and if SOL fails to hold the $100 threshold, a move into lower demand zones becomes increasingly likely. Analysts point to the $80 level as the next critical area where buyers may look to step in. Until then, price action remains fragile, and the downtrend could extend if broader market conditions fail to improve. For now, all eyes are on whether $100 can hold or break. Featured image from Dall-E, chart from TradingView
Ethereum has extended its downtrend, setting fresh lows around $1,400 a level not seen since early 2023. The continuation of selling pressure has shaken market sentiment, with many investors fearing that the worst is still ahead. Ethereum, down over 65% from its 2024 highs, has failed to find a solid support level amid broad market weakness and growing macroeconomic uncertainty. Related Reading: Ethereum Lags Behind Bitcoin In Q1 Performance Amid Market Downturn Details Despite the bearish outlook, some analysts believe a turning point may be near. According to top analyst Ted Pillows, Ethereum is now deep in a capitulation phase. He suggests that while there may still be one final 5%10% dump left in the tank particularly given the recent weakness in equities the broader market structure may be setting the stage for a rebound. Pillows points to a potential Federal Reserve pivot as a key catalyst. With traditional markets under pressure and volatility rising, a shift in monetary policy could bring relief. Historically, changes in the Feds stance have provided a strong boost to risk assets. If support from policymakers emerges, Ethereum could stabilize and begin recovering from its recent lows but not before weathering one last wave of fear and uncertainty. Ethereum Capitulation Deepens, But Fed Pivot Could Spark Rebound Ethereum is trading at $1,450 after suffering a sharp 20% decline in just hours, marking one of its steepest drops this year. The panic-driven selloff has shaken investor confidence, with fear now dominating the market. Ethereum, once expected to lead the altcoin rally in 2025, has failed to deliver on those expectations. Instead, it continues to disappoint as bearish momentum builds and selling pressure intensifies. Wider market conditions are adding to the pain. Trade war tensions, policy uncertainty from the US President Donald Trump administration, and mounting fears of a global recession are dragging both equities and crypto lower. With the S&P 500 already down sharply, the fear of a broader financial contagion is rising. Pillows’ analysis supports that Ethereums current plunge reflects a full-blown capitulation. However, he suggests that the market could be nearing a turning point. Maybe theres one last dump left, but after that, itll bounce, Pillows said. The key reason? A likely pivot from the Federal Reserve. Pillows points to a potential Federal Reserve pivot as the catalyst. With the S&P 500 down over 10% in just two days and volatility rising, any further drop could force an emergency Fed response. Historically, rate cuts and renewed quantitative easing (QE) have been bullish for risk assets like Ethereum. If a pivot arrives, Ethereum could quickly bounce from current levels but only after one final shakeout. Related Reading: Solana Faces Defining Level At $120 Will History Repeat? Ethereum Slides To $1,410 As Bears Maintain Control Ethereum has plunged to $1,410 after losing the crucial $1,800 support level, triggering a wave of aggressive selling and panic across the market. With no clear support zone immediately below current levels, bearish momentum appears firmly in control as ETH struggles to find footing. The breakdown below $1,800 marked a major technical failure, erasing confidence among traders and accelerating downside pressure. For now, the path of least resistance remains to the downside. If sentiment doesnt stabilize soon, Ethereum could continue sliding into lower demand zones, possibly retesting levels not seen since early 2022. The lack of a defined support structure beneath current prices leaves ETH exposed to more volatility in the near term. Related Reading: Dogecoin Faces Make-Or-Break Support Level Will DOGE Hold? However, hope remains for a recovery but it hinges on a swift reclaim of the $1,800 level. A strong bounce back above this mark could signal that capitulation is complete and invite renewed buying interest from sidelined investors. Until then, Ethereum remains vulnerable, and any upside attempts will likely face resistance unless backed by broader market strength or a decisive macro shift. Bulls have a narrow window to flip the momentum before deeper losses set in. Featured image from Dall-E, chart from TradingView
Ethereum continues to disappoint investors as its decline deepens, sparking growing fears of further selling pressure across the market. The second-largest cryptocurrency by market cap has failed to hold key support levels, and analysts are increasingly warning of a potential drop below multi-year lows near $1,750. With no clear consensus on where the next reliable support might lie, sentiment remains shaky and uncertain. Related Reading: Massive Chainlink Demand Wall At $6.26 As 90K Investors Buy 376M LINK The broader crypto landscape has faced heavy volatility, but Ethereums underperformance stands out. According to IntoTheBlock, ETH significantly lagged behind Bitcoin in the past quarter. This disparity has raised concerns about Ethereums short-term strength and resilience, especially as it continues to struggle below the $1,900 level. As macroeconomic instability, regulatory uncertainty, and risk-off sentiment continue to pressure financial markets, Ethereums path forward looks increasingly fragile. Without a strong rebound or renewed demand, the current trend suggests a prolonged period of weakness. Until bulls regain control and key resistance levels are reclaimed, the outlook for ETH remains cautious, with investors watching closely for any signs of a potential bottom or further breakdown. Ethereum Holds Ground As Tariff Shock, Underperformance Fuel Market Anxiety Ethereum is trading at critical levels following weeks of mounting selling pressure and fading bullish momentum. The broader crypto market has been hit hard by escalating macroeconomic uncertainty, largely driven by US President Donald Trumps recent policy shifts and sweeping tariffs. These moves have rattled investor confidence, sending shockwaves through both traditional and digital markets. Among major assets, Ethereum has been one of the most affected. Bulls lost control in late February when ETH broke below the $2,500 level, triggering a steady downtrend that has continued to weigh on price action. Attempts to regain support have consistently failed, and ETH now trades near multi-month lows with no clear bottom in sight. According to data from IntoTheBlock, Ethereum underperformed significantly this past quarter losing nearly 50% of its value- while Bitcoin dropped just 15% in the same period. This widening performance gap has become a point of concern for investors who once expected ETH to lead a 2025 rally fueled by Ethereum-based developments and broader adoption. Now, all eyes are on the coming weeks. If bulls can reclaim key levels and reignite momentum, Ethereum may still have a shot at recovery. But if a bearish sentiment continues to dominate, a deeper correction potentially below the $1,750 mark could be next. The pressure is on, and Ethereums next move could set the tone for the rest of the altcoin market. Related Reading: Dogecoin Faces Make-Or-Break Support Level Will DOGE Hold? Price Action Details: Key Levels To Watch Ethereum is currently trading below the $1,800 mark, showing continued weakness as bulls struggle to regain momentum. The price remains firmly below the 4-hour 200 MA and EMA, both of which are clustered around the $2,000 level a critical technical zone that previously acted as strong support. Now turned resistance, this area must be reclaimed for any hope of a sustained recovery. To shift the trend, bulls need to push ETH above $2,000 and ideally reclaim the $2,200 level, which would mark a break from the recent downtrend and signal the start of a potential recovery phase. Without that move, however, price action continues to favor sellers. The $1,800 level is now the last line of defense. Failing to hold and reclaim it quickly could open the door to a much steeper decline. If bears continue to pressure price below this zone, Ethereum may revisit levels not seen since early 2023 with $1,750 and even $1,550 as potential downside targets. Related Reading: Chainlink Whales Dump Over 170 Million LINK In Three Weeks Selling Pressure Ahead? Momentum remains against ETH, and unless bulls step in decisively, the trend looks set to continue lower. The next few days will be critical in determining whether Ethereum stabilizes or breaks further down. Featured image from Dall-E, chart from TradingView
World Crypto Global opens the door to digital freedom for everyone.
Manage your free WCG Coins securely—where simplicity meets global accessibility.
FREE CRYPTO COINS
AVAILABLE FOR RESERVATION
ALREADY ALLOCATED

No fees. No catch. Your crypto journey starts here.