Ripple Price Analysis: is XRP About to Crash Much Lower Than $0.5?

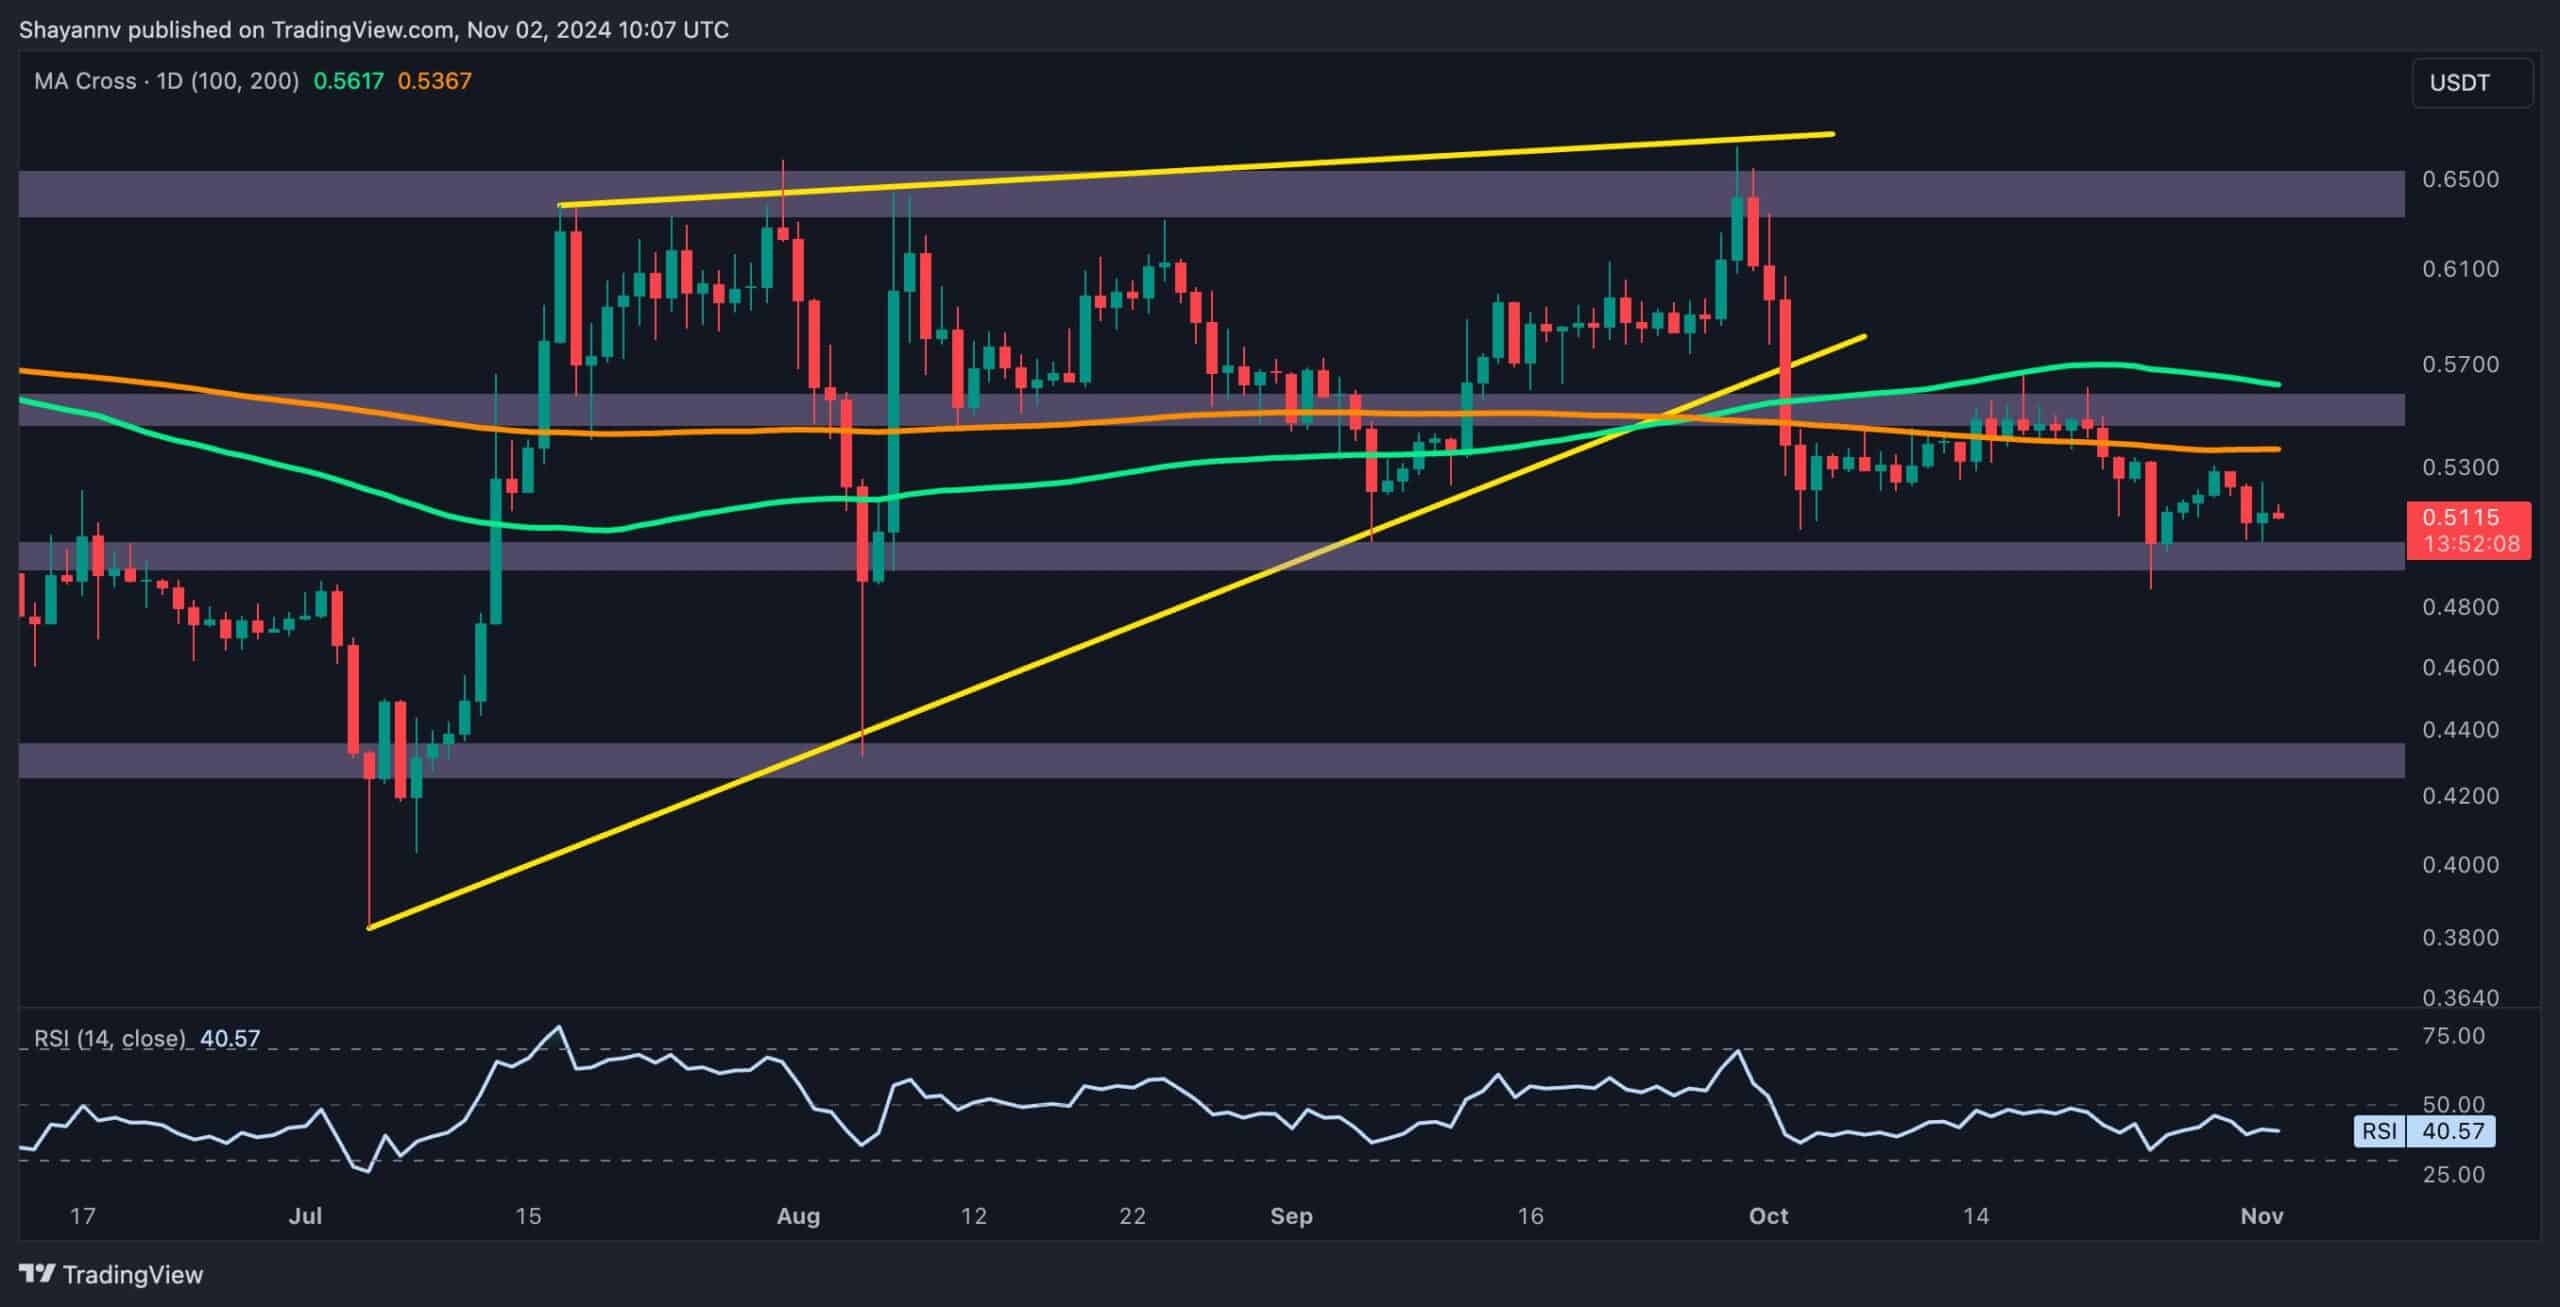
Ripples recent activity has highlighted a bearish trend, with a rejection at the 200-day moving average of $0.53.
This resistance has halted the cryptocurrencys previous upward momentum, driving the price back toward the $0.5 support level. Therefore, this raises concerns about its prospects.
XRP Analysis
By Shayan
The Daily Chart
On the daily chart, XRP recently encountered selling pressure after a minor retracement toward the 200-day moving average, leading to a sharp rejection. This resistance has halted the sustained bullish momentum, causing Ripple to revisit the $0.5 support region.
This level has consistently acted as a stronghold for buyers in recent months, making it a critical area for sellers aiming to drive the price lower. Currently, XRP is trading within the $0.5-$0.53 range, with the impending breakout likely defining the next mid-term trend.
The 4-Hour Chart
The 4-hour chart provides a closer look at Ripples consolidation within a crucial support zone between the 0.5 ($0.52) and 0.618 ($0.49) Fibonacci retracement levels.
XRP has recently encountered resistance around the 0.618 level and the upper boundary of its wedge formation, suggesting seller activity at this juncture.
Should the cryptocurrency break above this resistance level, a bullish rebound towards the $0.55 zone is possible. However, given the broader bearish sentiment, a continuation of the consolidation or a bearish breakdown below the $0.5 level appears more likely in the short term. A decisive break below $0.5 would signal a potential sustained downward trend.
The post Ripple Price Analysis: is XRP About to Crash Much Lower Than $0.5? appeared first on CryptoPotato.
Read more: https://cryptopotato.com/ripple-price-analysis-is-xrp-about-to-crash-much-lower-than-0-5/
Text source: CryptoPotato


