W o r l d . C r y p t o . G l o b a l

Loading

Welcome at World Crypto Global. This portal is packed with useful content and resources to built out your own crypto skills. WorldCrypto is a site member of Gabriel Vega Network.

Contact Info

CATEGORY: ali martinez


Sep 23, 2024 12:05

Solana (SOL) Failure To Break $154 Could Lead To $85 Correction Analyst

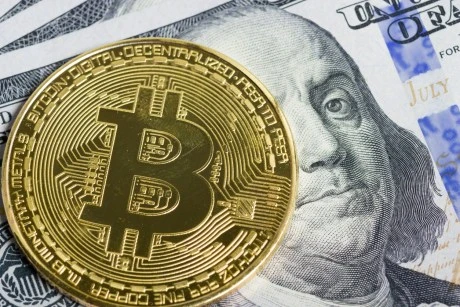
Prominent altcoin Solana was one of the major headliners recently, notching an 8.22% gain in the last seven days, according to data from CoinMarketCap. This positive performance saw Solana climb as high as $150, a price mark last seen in late August. The sentiments around the fifth-largest cryptocurrency are largely bullish, however crypto analyst Ali Martinez has released certain cautionary notes for investors. Related Reading: Solana Liquid Staking Could Touch $18 Billion Will It Benefit These Altcoins? Solanas Price Breakout Crucial To Avoid Slip To $85 In an X post on Sunday, Ali Martinez noted that Solana is currently headed for major price resistance at the $154 price zone. The analyst warns the altcoin must not suffer a rejection at this price level to avoid a major price crash.  In the crypto market, price rejections at certain price marks occur for various reasons including historical evidence of resistance at said price level. According to Solanas daily chart, the $154 price zone presents a strong resistance level stretching as far back as May. If a rejection occurs at this level, Solana could likely fall to around $128 in a best-case scenario. However, the presence of massive selling pressure could drive the altcoins price as low as $85, indicating a potential 44.1% decline from Solanas current price. Alternatively, If Solana breaks past $154, it could attain a market price of $190, at which lies its next major resistance. Such price gain would represent a 23.37% increase in the assets present market valuation.  At the time of writing, Solana continues to trade at $147.37 with a 1.24% gain on the last day, amid a 58.13% decline in trading volume activity. Also, the altcoin remains one of the market’s most resilient assets with 7.65% and 2.27% in the past seven and thirty days respectively despite long periods of market downturn. As the final quarter of 2024 approaches, Solana remains one of the favorite coins for profitability based on historical price data. This bullish stance is further strengthened by a robust meme market valued at $6.56 billion and continuous network development.   Solana To Soon Host cbBTC – Coinbase In other news, American crypto exchange Coinbase has unveiled a plan to integrate its newly launched wrapped Bitcoin asset- cbBTC – with the Solana network. This development was revealed by Coinbase executive Hassan Ahmed while speaking at the Breakpoint conference who cited interest in the Solana network from the exchange customers. Coinbase launched cbBTC on September 12 as a new digital product pegged 1:1 ratio with Bitcoin held in the exchange reserves. The wrapped Bitcoin asset was initially launched on the Ethereum and Base network with availability to customers in the United Kingdom, Australia, Singapore, and the United States barring New York.  Featured image from ProRealCode, chart from Tradingview

Sep 23, 2024 12:05

Bitcoin Whales Take Profit After Latest Price Jump Heres How Much They Sold

The latest on-chain data shows that a particular class of Bitcoin investors has been selling for profit in the wake of the recent price rally. The question here is how much did they sell and how much impact could it have on the Bitcoin price trajectory? Bitcoin Whales Dump 30,000 BTC In Four Days Impact On Price? In a new post on the X platform, prominent crypto pundit Ali Martinez revealed that Bitcoin whales have been increasingly active in the market in the days following BTC’s return to above $63,000. This on-chain observation is based on the drop in the total holdings of whales with balances between 1,000 and 10,000 BTC. Related Reading: Crypto Whales Buy $228 Million In XRP Following $5 Price Prediction According to data from Santiment, this cohort of Bitcoin whales has offloaded more than 30,000 BTC (worth around $1.86 billion) in the past 96 hours. Interestingly, this level of whale activity came after the premier cryptocurrency witnessed a price upswing triggered by the interest rate cut by the US Federal Reserve. Whales which typically refer to individuals or entities holding significant amounts of a particular cryptocurrency are perceived to hold considerable influence over the market due to the size of their holdings. Hence, their buying or selling activities can precipitate abrupt price swings in the short term. The Bitcoin market has been under a considerable amount of bearish pressure so far in September, falling to as low as $53,000 at some point. The Fed rate cut seemed like the perfect catalyst to turn things around and spark a fresh bullish momentum. However, profit-taking observed amongst the large investors could stall this recovery. When whales sell off their assets, it often causes other investors to tread the market with caution, as they wonder what the large holders know. This can lead to heightened selling pressure or a momentary price pullback.  BTC Price At A Glance  Nevertheless, it is worth mentioning that the Bitcoin price has made significant movement in the past few days. As of this writing, the flagship cryptocurrency is valued at $63,131, reflecting a mere 0.1% decline in the past day. According to data from CoinGecko, the value of BTC has increased by more than 5% in the past week. The market leader seems to be performing even better on broader timeframes. Related Reading: Over 150,000 ETH Moved To Exchanges In The Last 24 Hours: Whats Next For Ethereum? For instance, the Bitcoin price performance this month has been nothing short of surprising, as September is historically a bearish period for the premier cryptocurrency. BTC is up by more than 6.8% this month, its highest-ever average return in September. Featured image created with Dall.E, chart from TradingView

Sep 16, 2024 05:50

On-Chain Data Suggests Bitcoin Price Trend Reversal Is Yet To Occur Whats Happening?

The price of Bitcoin (BTC) ended the week on a good note after making a late rally on Friday, September 13. This recent price upswing has led to talks about the Bitcoin price making a comeback following a horrendous start to September. Interestingly, the latest on-chain data suggests that the ongoing price recovery might not [...]

The post On-Chain Data Suggests Bitcoin Price Trend Reversal Is Yet To Occur Whats Happening? appeared first on Crypto Breaking News.

Sep 15, 2024 12:05

112,000 ETH Moved To Crypto Exchanges In The Past Day Impact On Ethereum Price?

The Ethereum price has been one of the major talking points in the crypto space lately, having been under significant bearish pressure in recent weeks. However, the second-largest cryptocurrency seems to be on a recovery path following its first positive weekly performance in more than a month. Recent on-chain data shows that significant amounts of ETH tokens have made their way to centralized exchanges in the past day. The question now is could this hamper the recent progress shown by the Ethereum price? Heres How Rising Exchange Inflow Affects Ethereum Price Prominent crypto pundit Ali Martinez took to the X platform to reveal that Ethereum investors have been moving their assets to centralized exchanges in the past 24 hours. This on-chain observation is based on the CryptoQuant exchange reserve metric, which monitors the total amount of a particular cryptocurrency on all exchanges. Related Reading: Is Bitcoin Heading For A Bear Market? Analysts Weigh In On The Price Struggles Typically, the value of this metric increases when investors make more deposits than withdrawals of a token (Ether, in this case) into a centralized exchange. On the flip side, when the exchange reserve metric falls, it implies that the holders are moving their assets out of crypto exchanges. When investors move their assets from self-custodial wallets to centralized exchanges, it is often because they intend to use the platforms services, which include selling. As a result, an increase in the exchange reserve metric is often associated with increasing selling pressure.  According to data from CryptoQuant, more than 112,000 ETH (worth around $257.6 million) were transferred to cryptocurrency exchanges in the last 24 hours. The movement of these significant Ether amounts could trigger downward pressure on the Ethereum price. Considering its delicate position at the moment, bearish circumstances, such as rising exchange inflows, could hinder the Ethereum prices newly found momentum. Nonetheless, it is worth noting there has not been such an effect on ETHs price in the past day. On the contrary, the altcoin is up by more than 3% while looking to breach the $2,500 level. Are Investors Fleeing The Market? The latest on-chain data shows that investors might be flooding out of the Bitcoin and Ethereum markets. According to Ali Martinez, over $2.6 billion has flowed out of the two largest cryptocurrencies in the last seven days. Related Reading: Cardano (ADA) Whales Securing Gains After 10% Upswing: Whats Next? This revelation is based on Glassnodes aggregate market realized value net position change metric. And it somewhat supports the earlier notion that investors might be offloading their Ether tokens. Moreover, this outflow of capital could spell more trouble for the crypto market, specifically the Bitcoin and Ethereum prices. Featured image created with Dall-E, chart from TradingView

Sep 02, 2024 05:50

Bitcoin Price Under Pressure? Analyst Explains Why Retreat Below $66,000 Is Bad News

A crypto analyst has pinpointed the $66,000 mark as a crucial level for the Bitcoin price and its trajectory over the coming weeks.  Bitcoin Price Needs To Climb Above $66,000 Heres Why Popular crypto pundit Ali Martinez took to the X platform to share an interesting on-chain observation for the price of Bitcoin. This [...]

The post Bitcoin Price Under Pressure? Analyst Explains Why Retreat Below $66,000 Is Bad News appeared first on Crypto Breaking News.

Aug 05, 2024 12:05

Bitcoin Triple Threat: Analyst Identifies Three Signals For BTC Price Rebound

A popular crypto analyst on the X platform has sounded the buy alarm for Bitcoin after the premier cryptocurrency fell to the $60,000 level this weekend. Can Bitcoin Price Make A Return To $67,000? In a recent post on X, popular crypto pundit Ali Martinez shared an exciting analysis of the price of BTC over the coming days. According to the crypto analyst, the latest price action shows that the flagship cryptocurrency could be gearing for a rebound to its former highs. Related Reading: Could Bitcoin Outshine Gold? Trading Guru Weighs In On The Historic Financial Duel The reasoning behind this bullish projection is the formation of multiple buy signals by the TD (Tom Demark) Sequential on the Bitcoin four-hour chart. The TD Sequential is a technical analysis indicator used to identify possible points of trend exhaustion and price reversal. The TD Sequential consists of two phases; namely setup and countdown. For the setup, nine candlesticks of the same polarity (bullish or bearish) are counted, upon which a reversal is expected to occur. Typically, the direction of the reversal will depend on the candles involved in the setup I.e., nine bearish candles would represent a buy signal and vice versa. Upon the completion of the setup, the countdown phase commences, which involves 13 candles rather than nine of the same polarity. A completion of the second phase implies that there is likely another reversal point.  According to Martinez, the TD Sequential has pinpointed a potential reversal for the Bitcoin price. On the four-hour chart, the indicator presents an aggressive 13, a sequential 13, and a red 9 candlestick. The aggressive 13, sequential 13, and red 9 all suggest that the current downward trend might be losing momentum, thereby hinting at a possible trend reversal in the short term. Ultimately, these signals are indicating a strong buy opportunity for premier cryptocurrency, having shed some of its value in recent days. However, if the prediction of a price rebound fails to hold and the $60,000 support crumbles, investors could see the price of Bitcoin fall as low as $57,000.  BTC Price At A Glance As of this writing, the price of Bitcoin continues to hover around $61,000, recording barely any movement in the last 24 hours. According to data from CoinGecko, the premier cryptocurrency has declined in value by more than 10% in the past week. Related Reading: Solana Rebound: SOL To Hit $260 Despite Continuous Dip, Analyst Says Featured image from iStock, chart from TradingView

Aug 25, 2024 12:05

Bitcoin Price Surges Above $64,000 Heres The Resistance Level To Watch

The Bitcoin price performance has been uninspiring in the past week, mirroring the broader cryptocurrency market climate. However, the premier cryptocurrency seems to be ending the week on a high note following an unexpected Friday rally. The price of BTC appears to have received a breath of fresh air following Federal Reserve Chairman Jerome Powell’s Jackson Hole speech, finding its way above the $64,000 mark again with an almost 7% surge. The question now is how far can the Bitcoin price climb? Heres Why $66,250 Is A Crucial Level For BTC Prominent crypto analyst Ali Martinez took to the X platform to share an interesting prognosis for the Bitcoin price over the next few days. The relevant indicator here is the Glassnode UTXO Realized Price Distribution (URPD) metric, which monitors the amount of a particular cryptocurrency that was purchased at a given price level. Related Reading: Is A Bitcoin (BTC) Negative Correlation With Stocks A Bullish Signal? Analyst Reveals Typically, the likelihood for a price level to act as an on-chain support or resistance zone depends on the number of coins that have their cost basis at the specific level. For context, the cost basis of an investor refers to the original price (including the transaction fees) at which they acquired a coin or token. Price levels beneath the current spot value with substantial buying activity will likely act as support zones. On the other hand, levels above the current price could prove to be significant resistance areas. The chart below depicts the distribution of Bitcoin at different price levels surrounding the recent spot price of the coin.  Based on data from the highlighted chart, $64,045 and $66,250 seem to be the next crucial resistance levels to watch. While it appears that the Bitcoin price has flipped the $64,045 resistance wall, the $66,250 zone remains to be breached. According to data from Glassnode, nearly 382,000 coins were moved within the $66,250 price area. The last time BTC climbed above the $66,250 level, it traveled as high as the $70,000 mark before it encountered some resistance. It would be interesting to see how far the price of the premier cryptocurrency would go this time, especially considering that there is no major resistance wall above the $66,250 area based on the URPD indicator. Bitcoin Price At A Glance As of this writing, the price of Bitcoin is around the $64,000 mark, reflecting an almost 7% increase in the past 24 hours. This single-day performance has also shown on the weekly timeframe, with the flagship cryptocurrency climbing by nearly 10% in the past week. Related Reading: Crypto Analyst Predicts 42,263% Breakout For XRP Price To $280, Heres The Roadmap Featured image from iStock, chart from TradingView

Aug 21, 2024 02:30

Mega Whales Shake Ethereum: Price Dips Ahead?

Some of the largest Ethereum whales, holding over 10,000 ETH, have been on a coveted accumulation spree over the past month, with no signs of easing up. Data from Glassnode shows the number of Ethereum mega-whale addresses [those with a balance of over 10,000 ETH] and the 30-day change in that number. The chart also […]

Jul 10, 2024 03:35

Analysts Predict Bitcoin Price Recovery Following Sell-Off Fears

Bitcoin analysts observe key support levels and potential rebound despite bearish sentiment. Amid the recent turmoil caused by selling activities,…

The post Analysts Predict Bitcoin Price Recovery Following Sell-Off Fears first appeared on The Crypto Basic.

Jul 08, 2024 12:05

Analyst Hints Bitcoin Price Recovery Might Be Underway Heres Why

Crypto analyst Ali Martinez has offered an exciting bullish projection for the Bitcoin price. This analysis is even more interesting for the premier cryptocurrency after it fell to a multi-month low over the past week. Is A Return To $60,000 On The Cards For BTC Price? In a new post on the X platform, Martinez shared an interesting analysis of the Bitcoin price, explaining that the coin might be primed for a run to the upside. This is based on two bullish candlestick formations on the three-day chart. Firstly, the pundit noted that the price of BTC is forming a doji candle pattern on the three-day timeframe. As shown below, the specific candlestick pattern developing on the Bitcoin chart is the Dragonfly doji, which looks like a cross or plus sign but with its horizontal line close to the top. Related Reading: Finance CEO Raoul Pal Says Crypto Will Reach $100 Trillion Market Cap Heres When Typically, the dragonfly doji candlestick pattern is an indicator of a potential reversal depending on the price action. Considering that the market has been in a correction in recent days, a reversal would mean a movement of the Bitcoin price to the upside. It is worth noting that the dragonfly doji is not the most reliable signal of an imminent price reversal, as the indicator can be a sign of indecision amongst investors. However, Martinez pointed to another bullish formation that might also be indicating a potential trend reversal. The second bullish formation is based on the Tom Demark (TD) Sequential, which is used in technical analysis to spot potential points of trend exhaustion and price reversal. Martinez said that the indicator has flashed a buy signal on the three-day Bitcoin price chart. Typically, the TD Sequential is made up of two major phases, namely the setup and the countdown. The price of Bitcoin just completed the setup phase, which is made up of nine consecutive candles that closed lower than the candle four periods ago. The potential reversal point appears when the TD Sequential forms the number 9 on top of a candle in a bullish or bearish trend. As shown in the image highlighted by Martinez, the number 9 is on the doji candle suggesting a possible reversal. The question that will be on the minds of most investors is whether the premier cryptocurrency will return to $60,000. While the recent chart formations are suggesting an upward rally, it is difficult to pinpoint the magnitude of the potential bullish run. Bitcoin Price At A Glance As of this writing, the price of Bitcoin is on the verge of $58,000, reflecting a 2.7% gain in the last 24 hours. However, the market leader is still down by more than 5% in the past week. Featured image from iStock, chart from TradingView

Jul 29, 2024 12:05

Bitcoin Miner Capitulation Comes To An End Time To Buy BTC?

Indeed, the Bitcoin price has been on a hot streak in recent weeks, returning to its past heights most investors have become accustomed to. However, the past week was a somewhat quiet one for the premier cryptocurrency, as it was for most of the digital asset market. Interestingly, the latest on-chain insights suggest that the crypto market, specifically the Bitcoin market, might not be inactive for too long.  BTC Price Momentum Shifts To Positive – Impact On Price? In a recent post on the X platform, popular crypto pundit Ali Martinez revealed that Bitcoin miner capitulation has seemingly come to an end. This on-chain observation is based on a shift in the Glassnode Hash Ribbon indicator, which measures BTCs hash rate. Related Reading: Analyst Predicts Solana Rise To $1,400 As Similarities With July 2021 Emerge Typically, the Hash Ribbon features two moving averages; including the short-term (30-day) and long-term (60-day) hash rate. A cross of the short-term moving average below the long-term moving average implies miner capitulation, which is characterized by widespread sell-offs by miners. On the other hand, when the 60-day ribbon falls under the 30-day ribbon, it indicates the end of capitulation and the potential start of a recovery phase for the network. As shown in the chart below, this positive cross appears to be the current situation for Bitcoin, signaling an optimistic future for the flagship cryptocurrency. Ultimately, this means that Bitcoin miners are returning to the network and restarting operations, as they become more profitable. From a historical standpoint, the end of miner capitulation is a bullish sign, as it often precedes significant price leaps for the premier cryptocurrency. Martinez highlighted this in his post on X, saying this could present good buying opportunities. Another indicator that supports this on-chain revelation is the Bitcoin Miner Profit/Loss Sustainability metric, which measures how fair miner revenues are. According to the latest data from CryptoQuant, the BTC miners have been making some profit over the past few days, putting them in the fairly paid region of the indicator. Bitcoin Price At A Glance As of this writing, the price of Bitcoin stands at around $68,230, reflecting a mere 0.7% increase in the last 24 hours. As earlier inferred, the premier cryptocurrency had an uneventful week in terms of price action, dancing between the $64,000 and $68,000 range. Related Reading: Crypto Backs Donald Trump: $4 Million War Chest In Bitcoin, XRP For Re-election According to data from CoinGecko, the BTC price increased by barely 1% in the past week. Nevertheless, the cryptocurrency retained its position as the largest digital asset in the sector, with a market capitalization of more than $1.33 trillion. Featured image from iStock, chart from TradingView

Jul 28, 2024 12:05

Analyst Says Chainlink Price Could Climb To $19 Heres How

In recent months, the Chainlink price hasn’t quite been able to replicate the bullish strength it showed at the start of the year. And the past week was a prime example of the coins recent struggles, as the bulls failed to completely stamp control over the last seven-day period. However, it appears that the LINK price inconsistencies might be coming to an end soon, as a popular crypto analyst has identified a bullish pattern on the tokens price chart. How LINK Price Could Soar 48% To Reach $19 Prominent crypto analyst Ali Martinez has shared via a post on X an exciting prognosis on the future trajectory of the Chainlink price. According to the crypto pundit, the cryptocurrency, which has largely struggled, could be set for a price turnaround over the next few weeks. Related Reading: Analyst Says XRP Remains Strongest Compared To Bitcoin And Ethereum, Heres Why The rationale behind this bullish projection is the formation of an inverse head and shoulders pattern on the LINK four-hour price chart. The inverse head and shoulders formation is a technical analysis indicator that features a head (a lower low) in between two shoulders (usually a lower low and a higher low). This chart formation whether in the normal or inverse form is a significant indicator for identifying trend reversals. Specifically, the inverse head and shoulder pattern suggests a shift from a bearish to a bullish trend when the price breaks the neckline, an imaginary line that runs through the peaks of the troughs. Martinez noted in his post on X that the price of Chainlink could make a run towards the $19 mark over the next coming days. However, the cryptocurrency must break above the neckline around the $15 level, as shown in the chart above. A rally to the $19 mark would represent an almost 50% price leap from the current price. And a return to this price level would be most welcomed by the altcoin’s investors, having spent the last two months beneath it. Chainlink Price At A Glance As of this writing, the Chainlink price has jumped slightly above $13.5, reflecting a 3.6% increase in the last 24 hours. However, this price gain is not significant enough to wipe the tokens loss over the past seven days. Related Reading: Toncoin Under Pressure As TON Price Falls Below 100-Day SMA, $6 Looms According to data from CoinGecko, the LINK token experienced a 3% decline in value in the past week. Nevertheless, the cryptocurrency still ranks among the top 20 largest assets in the sector, with a market cap of more than $8.2 billion. Featured image from Unsplash, chart from TradingView

Jul 22, 2024 12:05

BRETT Price Explodes 30% In A Single Week Whats Next For The Meme Coin?

The crypto market has enjoyed a good run in the last few days, with several large-cap assets posting double-digit gains in the past week. Meanwhile, meme coins like Dogecoin, dogwifhat, Pepe, and Brett, were also among the best-performing assets in the market. Specifically, BRETT witnessed an over 30% increase in its value over the past week. Interestingly, a popular crypto pundit has suggested this recent momentum is only the tip of the iceberg, as the meme tokens price seems set to take off. Analyst Predicts Meme Coin’s Price Will Skyrocket By 300% In a recent post on the X platform, prominent crypto analyst Ali Martinez put forward an exciting projection for the price of BRETT over the coming weeks. According to the pundit, recent price action suggests that the meme coin is gearing for an explosive 300% move to the upside. Related Reading: Crypto Market Rebounds From Lows, But Why Are Cardano Holders Suffering Losses? The rationale behind this bullish projection is the formation of a bull flag on BRETTs daily price chart. A bullish flag formation is a technical analysis and a strong continuation pattern that resembles a flag on a pole.  The pole usually represents a vertical rise while the flag represents a period of price consolidation. The important feature of this chart formation is the breakout from the flag, which typically mirrors the length of the initial pole of the flag.  As shown in the chart above, the BRETT price seems to be on the verge of a breakout, having been in a consolidation range since early June. This consolidation zone or flag was preceded by a vertical upward movement, which saw the tokens price jump from $0.03 to $0.2. Martinez noted in his post that if the meme coins price breaks out of the flag, the $0.15 support level needs to hold strong upon retest. If the support fails to hold, the Brett might just return within the consolidation range. In the case of a successful breakout, the analyst predicted the BRETT price to climb as high as $0.63. BRETT Price Overview As inferred earlier, a price upswing to $0.63 would represent an over 300% rally from the current price point. As of this writing, the price of Brett stands around $0.147, reflecting a nearly 6% increase in the last 24 hours. Related Reading: Is $200 Within Reach For Solana Price? Heres Why This Blockchain Firm Thinks So According to data from CoinGecko, the meme token is up by nearly 30% in the past week. With a market capitalization of over $1.45 billion, BRETT ranks amongst the top 10 largest meme coins in the digital asset sector. Featured image from iStock, chart from TradingView

Jul 21, 2024 12:05

Stalled USDT Liquidity Threatens Bitcoin Price Further Growth Heres Why

The price of Bitcoin has maintained a recovery trajectory over the last week, gaining by a significant 16.25% to move briefly above the $67,000 price mark. Bitcoin investors are likely hopeful the asset will record more price gains and finally embark on a bull run following the halving event in April. However, Bitcoins price future gains are theorized to be tied to multiple factors including the liquidity of the stablecoin market. Why A Stagant USDT Liquidity Is Harmful To Bitcoin? In an X post on Friday, prominent on-chain analytics platform CryptoQuant emphasized the importance of stablecoin liquidity to an appreciation in Bitcoins price. CryptoQuant stated that for premier cryptocurrency to experience further price increases, there is a need for an equal rise in the stablecoin market shares. Related Reading: Coinbase Analysts Warn: Bitcoins Upward Trend Could Hit a Wall Heres Why   For context, stablecoins refer to a type of cryptocurrency with a fixed value that is usually pegged to a reserve asset, usually the US dollar. These assets are combined valued at $163.56 billion and are critical to digital asset adoption for users with a fear of market volatility.  In relation to Bitcoins price, CryptoQuant specifically references Tether (USDT), the largest stablecoin and third largest cryptocurrency with a market cap value of $113.78 billion, as a major influencing factor.  The analytics team explains that USDTs growth in the last month has been near 0% (1.03%), thus suggesting a slight 3.21% increase in Bitcoin’s price over the same period. In contrast, USDTs market shares grew by 6.6% in March 2024, the same time in which Bitcoin rose from $61,168 to secure a new all-time high at $73,750. The relationship between both assets could stem from the prominent use of USDT in crypto trading. Thus, a higher level of USDT liquidity could allow traders to increase demand for risky assets, including Bitcoin. According to CryptoQuant, the Bitcoin market, therefore, requires a rapid rise in stablecoin liquidity to maintain its current positive price performance. Related Reading: Bitcoin Bollinger Bands Squeezing: Is BTC Ready For $140,000? Analyst Highlights Dangerous BTC Price Level In other news, amidst Bitcoins current price rally, popular crypto analyst Ali Martinez has warned that Bitcoin must maintain its price above the $66,385 level to avoid a massive liquidation of about $42.67 million.  At the time of writing, Bitcoin continues to trade at $66,571 with a notable 4.65% gain in the last day. In a similar fashion, the assets daily trading volume is up by 38.08% and valued at $37.2 billion. Featured image from Big Stock Photo, chart from Tradingview.com

Jul 17, 2024 03:35

Market Veteran Sees This Altcoin Surging 300% Amid Bull Flag Pattern

Veteran analyst Ali Martinez identifies a bull flag setup in the BRETT/USDT pair, predicting a potential surge of 300% that…

The post Market Veteran Sees This Altcoin Surging 300% Amid Bull Flag Pattern first appeared on The Crypto Basic.

Jul 15, 2024 12:05

Bitcoin Price To Return Above $63,000? Heres What Needs To Happen

The Bitcoin price has shown good signs of recovery over the past seven days, returning above $58,000 to end the week. Interestingly, a prominent crypto analyst on X has identified a chart formation signaling a potential continuation of this resurgence by the premier cryptocurrency. Bitcoin Price Prints This Chart Pattern What Next? In a new post on the X platform, popular crypto analyst Ali Martinez shared an exciting analysis for the Bitcoin price over the next few days. According to the crypto pundit, the flagship cryptocurrency seems to be at a critical point for a bullish breakout that could see its price reclaim former highs. The rationale behind Martinezs projection is the formation of an ascending triangle pattern on the Bitcoin four-hour price chart. An ascending triangle refers to a technical analysis pattern that features a horizontal line drawn along swing highs and a rising trendline drawn along swing lows. Related Reading: Why Did The Cardano Price Surge 17% Amid The Crypto Market Crash? Typically, ascending triangles are referred to as continuation patterns, as price often breaks out of the triangle in the prevalent trend direction (uptrend or downtrend) in the triangle formation. However, this is not always the case with the chart pattern.  Martinez highlighted that if the Bitcoin price successfully breaks above the triangles horizontal line, which is set around the $59,200 resistance level, it could continue its recovery journey. According to the analyst, the premier cryptocurrency could rally as high as the $63,800 mark. As of this writing, the price of Bitcoin stands at $59,431, breaking above the $59,200 following the failed assassination attempt on United States former President and vocal Bitcoin supporter Donald Trump. A sustained break above this level would make the $63,800 price projection more likely than ever. BTC Weighted Sentiment Falls To Lowest Level Since 2020 In another post on X, Martinez revealed that Bitcoins weighted sentiment witnessed a plunge following the coins recent decline to $53,300. According to data from Santiment, the weighted sentiment fell to -2 on July 5, its lowest level since the COVID-19 crash in March 2020.  A negative sentiment is not exactly a good sign for the Bitcoin price, as it could be a signal of further downside for the coin. Although the Bitcoin weighted sentiment hit a multi-year low a little over a week ago, it is currently moving towards the positive side. Related Reading: 180% Upside For Fetch.ai (FET)? Analyst Makes Bold Prediction Amid Market Jitters However, the metric is still negative at around -0.47 based on Martinezs post on Saturday, July 13. This could imply further downside for the price of flagship cryptocurrency. Featured image from iStock, chart from TradingView

Jul 01, 2024 12:05

14,000 BTC Transferred To Exchanges In Four Days Worrying Trend For Bitcoin Price?

Recent on-chain data shows that substantial amounts of Bitcoin have made their way to centralized exchanges in the last few days. How could this impact the Bitcoin price? Bitcoin Price To Face Further Selling Pressure? In a new post on the X platform, prominent crypto analyst Ali Martinez revealed that Bitcoin investors have been transferring their assets to centralized exchanges in recent days. The relevant indicator here is CryptoQuants Exchange Reserve metric, which tracks the total amount of a particular cryptocurrency held on all exchanges. Related Reading: Shiba Inu Army On The Move: 35 Billion SHIB Invade Shibarium It is worth noting that the value of this metric rises when investors are making more deposits than withdrawals of a cryptocurrency (Bitcoin, in this scenario) into centralized exchanges. Meanwhile, when the metrics value falls, it means that holders are transferring their assets out of the trading platforms. According to CryotoQuant data, more than 14,000 BTC (valued at approximately $851.2 million) have been sent to crypto exchanges in the last four days. As shown in the chart below, the exchange reserve metric is at its highest level in nearly a month. Typically, an increase in the exchange reserve indicates high selling pressure, as investors often use centralized exchanges to sell assets. Consequently, the movement of huge amounts to trading platforms could exacerbate the downward pressure on the Bitcoin price. Furthermore, the exodus of significant amounts to centralized exchanges could trigger price volatility for the premier cryptocurrency. This would imply an increased likelihood of big price movements in the future.  However, there has not been any impact on the Bitcoin price in the past day. As of this writing, the price of the premier cryptocurrency stands at around $60,700, reflecting a bare 0.3% increase in the last 24 hours.  Price Rebound Imminent For BTC: Santiment Fortunately, it is not all gloom for the Bitcoin price at the moment. Prominent on-chain analytics platform Santiment has offered a positive outlook for the price of the market leader. According to the blockchain firm, Bitcoins recovery following dips in the past two weeks has been short-lived. Santiment believes that a price rebound is imminent for the premier cryptocurrency. The rationale behind this analysis is based on two factors; the recent negative sentiment from the crowd and the low relative strength index (RSI). Santiment said in its post: But note the continued negative sentiment pouring in from the crowd, indicating their patience is wearing thin. This, along with a low RSI of just 36, are strong indications a bounce is close. Related Reading: BlackRock Global Allocation Fund Reveals Major Bitcoin ETF Stake With 43,000 Shares Featured image from iStock, chart from TradingView

Jun 25, 2024 03:35

Bitcoin RSI Drops to Oversold Level that Historically Led to an Average 103% Surge

Bitcoin RSI hits oversold zone which previously led to price surges of 60%, 63%, and 198% marking an average of…

The post Bitcoin RSI Drops to Oversold Level that Historically Led to an Average 103% Surge first appeared on The Crypto Basic.

Jun 24, 2024 12:05

19 Million Chainlink Tokens Transferred To Exchanges More Downside For LINK Price?

The cryptocurrency market witnessed severe bearish pressure over the past week, and the price of Chainlink (LINK) wasn’t an exception. The altcoin has continued to struggle with its torrid form, losing nearly 10% of its value in the last seven days. Interestingly, the bears seem to still be in control at the moment, with the latest on-chain revelation suggesting that there might be further downside for the LINK price over the next few days. Are Chainlink Investors Offloading Their Assets? Popular crypto analyst Ali Martinez revealed in a post on the X platform that huge amounts of the Chainlink token have made their way to centralized exchanges in the past day. This on-chain observation is based on Santiments Supply on Exchanges metric, which tracks the amount of a particular cryptocurrency being held on centralized exchanges. Related Reading: Little-Known But Important Dogecoin Indicator Goes Off, How High Can It Drive Price? When this metrics value increases, it implies that investors are making more deposits than withdrawals of a cryptocurrency (Chainlink, in this case) into centralized exchanges. A decrease in the metrics value, on the other hand, indicates that holders are moving their coins out of the trading platforms. According to data from Santiment, more than 18.77 million LINK (worth roughly $256.2 million) were transferred to cryptocurrency exchanges in the past day. This substantial transfer represents one of the largest single-day movements for the Chainlink token in recent months.  Interestingly, a report from SpotOnChain revealed that 21 million tokens were unlocked from Chainlinks non-circulating supply contracts on Friday, June 21. Specifically, the contract transferred 2.25 LINK tokens were sent to the multi-sig wallet 0xD50f More notably, 18.25 million LINK tokens were sent to Binance, the worlds largest cryptocurrency exchange. This significant token unlock presents a case of supply inflation, which can impact the value of the token especially if a sell-off occurs. Moreover, these fund movements can precipitate an increase in market volatility and possibly lead to price fluctuations. Given the magnitude and destination of these transfers, there is a greater likelihood of increased selling pressure, which can drive down the price of LINK.  Is A Return To $12 On The Cards? As of this writing, the price of Chainlink is barely holding above $13.6, having declined by more than 3% in the past day. Meanwhile, the altcoin slumped 9% from about $15 to $13.5 over the past week, according to data from CoinGecko. If the recent selling pressure continues, then further decline might be on the horizon for LINKs price. This could see the cryptocurrency make a return to around the $12 price zone for the first time in more than a month. Related Reading: Toncoin Transfer Volume Hits $10 Billion, Social Appeal Soars Nevertheless, the Chainlink token ranks amongst the top 20 largest cryptocurrencies in the sector, with a market capitalization of over $8.27 billion. Featured image from Binance Academy, chart from TradingView

Jun 24, 2024 12:05

Ethereum (ETH) Records Surge In Active Addresses Incoming Price Rebound?

Ethereum (ETH) is currently down by 0.75% as its price continues a range-bound movement seen all week. However, in its monthly timeframe, the most prominent altcoin displays a concerning performance with a reported loss of 6.40% according to data from CoinMarketCap.  However, popular crypto analyst Ali Martinez has picked up a notable development on the Ethereum network which could spell good fortunes for price action in the coming days. Related Reading: Ethereum Price Retreats: Market Sentiment Slowly Shifts Bearish Ethereum Active Addresses Soar To 3-Month High At 617,170 In an X post on June 22, Martinez reported a significant spike in the active addresses on the Ethereum blockchain. Using data from blockchain analytics company Santiment, the crypto analyst noted there were 617,170 active Ethereum users on June 21, marking the highest value for this metric in the past three months. #Ethereum just saw its largest spike in active $ETH addresses in three months, reaching a total of 617,170 active #ETH addresses. pic.twitter.com/CSqBOnQhEr Ali (@ali_charts) June 22, 2024 This development has sparked much speculation in the Ethereum community as a rise in active addresses often signifies an increase in network activity which is quite important following Ethereum’s overall negative performance in the last month.  In theory, this is a positive omen for ETHs price as higher activity corresponds with a rise in user transactions thus driving higher demand for the cryptocurrency and ultimately producing a price rebound. Many Ethereum enthusiasts would likely hope that this turns out to be the case when the altcoin breaks out of its current condition between $3,400 and 3,600. Related Reading: 3 Reasons To Invest In Ethereum, 1 To Stay Bitcoin-Only: Bitwise CIO ETH Propped For Major Rebound  In other news, another crypto analyst Michaël Van De Poppe has also added to Ethereum’s chances of staging market recovery. Using the ETH/BTC price chart, van De Poppe stated that as long as ETH trades above the 0.05 price mark, the tokens downtrend is set to undergo a reversal soon.  Currently, ETH trades around $3,504.42 with a 1.56% decline in the past week. Notably, the tokens daily volume is down by a staggering 52.93%, presently valued at $7.50 billion. If the bulls are able to mount massive pressure forcing an upward breakout, ETH may return to the $4,000 last seen in March. However, if the bears retain market control, Ethereum could fall as low as $3000, representing a potential 14% decline from its current price. It’s worth stating that all predictions are merely speculations and offer no guarantee. Investors are admonished to conduct proper research before buying any asset. ETH trading at $3,511 on the daily chart | Source: ETHUSDT chart on Tradingview.comFeatured image from, chart from Tradingview

Your Crypto Gateway

Claim 1,000
Free WCG Coins

World Crypto Global opens the door to digital freedom for everyone.
Manage your free WCG Coins securely—where simplicity meets global accessibility.

11 bn

FREE CRYPTO COINS

8.9 bn

AVAILABLE FOR RESERVATION

2.1 bn+

ALREADY ALLOCATED

× WCG Coin

🎉 Get 1,000 WCG Coins

No fees. No catch. Your crypto journey starts here.